Advances in Optical Amplifiers Part 7 pptx
Bạn đang xem bản rút gọn của tài liệu. Xem và tải ngay bản đầy đủ của tài liệu tại đây (1.27 MB, 30 trang )
0
Chromatic Dispersion Monitoring Method Based
on Semiconductor Optical Amplifier Spectral Shift
Effect in 40 Gb/s Optical Communication Systems
Ming Chen
Research Institute of Optoelectronic Technology and School of Information and
Communication, Guilin University of Electronic Technology
P. R. China
1. Introduction
The optical signals degrade as travel down the optical link due to the optical fiber properties
such as chromatic dispersion, polarization mode dispersion, polarization dependent loss,
polarization dependent gain and various fiber nonlinear effects, which are considered as
limitations in the high-speed, lang-haul fiber communication systems. Where chromatic
dispersion causes different wavelengths to travel at different group velocities in single-mode
transmission fiber and it has become a major source of transmission degradation due to
the continuing increase of the bit rate and distance in high-speed long-distance optical
communication systems (Kaminow et al., 2008). In the long-haul optical fiber communication
systems or optical fiber communication networks, the accumulated chromatic dispersion is
managed by creating a dispersion “map”, in which the designer of a transmission optical
fiber link alternates elements that produce positive and the negative chromatic dispersion. In
this dispersion “map”, the dispersion has some nonzero value at each point along the optical
fiber link, the degradations, from nonlinear effects such as four-wave-mixing (FWM) and cross
phase modulation (XPM), are effectively eliminated, but the total accumulated dispersion is
near to zero at the end of the optical fiber link (Kaminow & Li, 2002). It seems that there
need not other dispersion compensation techniques any more. Unfortunately, chromatic
dispersion changes with dynamic optical fiber network reconfiguration and variation with
environmental conditions such as temperature in practice (Agrawal, 2002). This dynamical
action causes dynamical residual chromatic dispersion in a dynamical fiber link. In addition,
signal tolerance to accumulated chromatic dispersion diminishes as the square of the bit
rate. Therefore, 40Gbit/s signals are 16 times more sensitive to chromatic dispersion than
10Gbit/s signals. The signal tolerance to chromatic dispersion is restricted about 50ps/nm in
single channel speed 40Gbit/s fiber communication systems, so there requires more carefully
chromatic dispersion management. The residual chromatic dispersion of a dynamical fiber
link can easily extend the tolerance in those high speed fiber communication systems, they
need more precise and dynamical monitoring and compensation methods (Pan, 2003).
Many novel and effective dispersion compensation methods have been proposed (Kaminow
& Li, 2002) (Pan, 2003), and they are included, dispersion compensating fibers, linear-chirped
fiber Bragg gratings etc., for fixed dispersion compensation. The dispersion compensating
fibers have negative dispersion, which can compress the extended signal pulses due to the
8
2 Advances in Optical Amplifiers
positive dispersion of the single-mode transmission fibers. These dispersion compensating
fibers can be made by conventional optical fiber fabrication technics and can also be made by
photonic crystals — a novel new optoelectronic technology (Sukhoivanov et al, 2009), called
microstructured fibers or photonic crystal fibers with many periodic-arrayed air-holes and
one or many defects in the fiber cross section (Bjarklev et al, 2003). Due to the complicated
cross section structure, many excellent optical properties can be obtained by careful selecting
the photonic crystal fiber structure parameters, such as photonic crystal fibers with large
negative dispersion can be achieved. (Chen et al., 2010) Optical fiber Bragg gratings with
linear-chirp have emerged as powerful tools for chromatic dispersion compensation because
of their potential for low loss, small footprint, and low optical nonlinearities (Sukhoivanov
et al, 2009). Fiber Bragg gratings are section of single-mode fiber in which the refractive
index of the core is modulated in a periodic fashion as a function of the spatial coordinate
along the length of the optical single-mode fiber (Kashyap et al, 2009). In chirped fiber
gratings, the Bragg matching condition for different positions along the grating length, thus
the different wavelength is reflected at different position. As a result, the extending signal
pulses can be compressed by careful tailing the chirp profile of the fiber gratings (Kaminow
& Li, 2002). Fiber Bragg gratings, achieved by sampled fabricating techniques, can be used
for chromatic dispersion compensation in multichannel optical communication systems, such
as wavelength division multiplexing (WDM) fiber communication system (Ibsen et al., 1998).
And those with nonlinear chirped profiles can be used to achieve dynamical compensation
in optical fiber communication systems with variable and unpredictable residual chromatic
dispersion. When using a nonlinear chirp profile, the chromatic dispersion can be tuned by
simply stretching the grating or heating the grating with heat-conduction coatings because of
the sensitiveness of the reflection spectrum and group delay with grating structure, stress and
temperature (Sun et al., 2006). Based on a thermally tunable nonlinear chirped fiber grating,
we have achieved a tunable chromatic dispersion compensation system for optical fiber
communication system with single channel speed 40Gbit/s and carrier suppressed return to
zero (CSRZ) modulation format (Chen et al., 2007). The fiber grating is covered with uniform
thin metal electric-conducting film which can add voltage to heat up. when the fiber grating is
added voltage and has current in the electric-conducting film, the fiber grating is heated and
then the temperature is changed, the reflection spectrum and group delay is also changed.
We can control the group delay at certain wavelength by control the voltage added in the
film-covered optical fiber grating. In our system, the measured chromatic dispersion can be
varied from -60ps/nm to -260ps/nm for wavelength 1553.40nm.
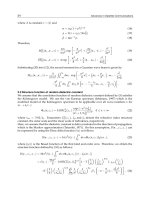
The schematic common chromatic dispersion compensation system is shown in Fig.1. It is
mainly consisted by a chromatic dispersion compensation module, a chromatic dispersion
monitoring module and an optical fiber coupler, as shown in Fig.1. The optical signal
with accumulated residual chromatic dispersion from optical fiber link is firstly sent into
the chromatic dispersion compensation module. After compensating, the optical signal is
sent into the optical fiber link again, and some power of the compensated optical signal
is separated from the optical fiber link by the optical fiber coupler after the chromatic
dispersion compensation module and is sent into the chromatic dispersion monitoring
module, which includes an optical receiver, some electrical signal processing modules and
relevant computer algorithms. This chromatic dispersion monitoring module can generates
an electrical control signal for the chromatic dispersion compensation module according to
one or certain parameters of the input optical signal. The one or certain parameters are relating
to the accumulated residual chromatic dispersion of the fiber communication system links
166
Advances in Optical Amplifiers
Chromatic Dispersion Monitoring Method Based
on Semiconductor Optical Amplifier Spectral Shift Effect in 40 Gb/s Optical Communication Systems
3
Fig. 1. Dispersion compensation system. The blue solid line denotes optical signal withdraw
from optical fiber link after dispersion compensation and the red that denotes electric control
signal come from dispersion monitoring module.
(Kaminow & Li, 2002) (Pan, 2003) (Hong, 2002).
Dynamical chromatic dispersion management has become a critical issue for high-bit-rate
transmission systems, especially for systems with speeds beyond 10Gbit/s, and
reconfigurable optical networks, because the accumulated chromatic dispersion can easily go
beyond the optical communication systems’ tolerance. Chromatic dispersion management,
in high speed optical communication systems, is very difficult and needs effective high
speed response chromatic dispersion monitoring methods, as shown in Fig.1. The range
and precision of the monitoring methods decide the range and precision of the chromatic
dispersion compensation systems (Seyed Mohammad Reza Motaghian Nezam, 2004).
Previous works on chromatic dispersion monitoring have resulted in the development of
numerous approaches, such as detecting the intensity modulating from phase modulation
(Ji et al., 2004), modulating the frequency of the transmitted data signal and monitoring
the clock deviation (Pan et al., 2001), inserting in-band subcarriers in the transmitter and
monitoring their radio frequency tones (Ning et al., 2006) (Luo et al., 2006), adding an
amplitude modulated double sideband subcarrier to the signal and measuring the phase
delay between two subcarrier tones (Wang et al., 2006), extracting the clock component and
measuring its radio frequency (RF) power (Inui et al., 2002), extracting two single sideband
sideband components of the data signal and detecting their phase difference (Hirano et
al., 2002), employing nonlinear optical detection (Wielandy et al., 2004) (Li et al., 2004),
measuring the chromatic dispersion induced distortion using a peak detector (Ihara et al.,
1999), and so on. In practice, both chromatic dispersion and polarization mode dispersion
are all influent the performance of the high-speed optical fiber communication systems,
and effective simultaneous monitoring methods for chromatic chromatic dispersion and
polarization mode dispersion are necessary. We developed a novel and effective method to
monitor chromatic dispersion and polarization mode dispersion simultaneously using two
polarization-modulation pilot tones with different frequencies (Chen et al., 2007). It has
been demonstrated that radio frequency (RF) output power increase with group velocity
delay (GVD) and differential group delay (DGD) and the power radio of the two pilot tones
increases with GVD and decreases with DGD, thus chromatic dispersion and polarization
167
Chromatic Dispersion Monitoring Method Based on
Semiconductor Optical Amplifier Spectral Shift Effect in 40 Gb/s Optical Communication Systems
4 Advances in Optical Amplifiers
mode dispersion can be distinguished and monitored simultaneously. This is an effective
monitoring method in high-speed optical fiber communication systems.
In this chapter, we demonstrate an other novel in-line dynamical monitoring methods for
chromatic dispersion based on the spectral shift effect of a semiconductor optical amplifier
(Chen et al., 2007). This spectral shift effect is result of the self phase modulation effect in
the semiconductor amplifier. Due to large nonlinearites of semiconductor optical amplifiers,
the spectral shift effect is enhanced, and this effect is impacted by the residual chromatic
dispersion of the optical fiber link, which is optical signal transmitted. Using an optical filter
— a fiber grating, we can obtain the variational power of the spectrum of the optical signals,
and then we can achieve the dynamical chromatic dispersion monitoring in line for a high
speed optical fiber communication system.
2. Monitoring principle based on semiconductor optical amplifiers
In the past two decades, optical communication has changed the we communicate. It
is a revolution that has fundamentally transformed the core of telecommunications, its
basic science, its enabling technology, and its industry. The optical networking technology
represents a revolution inside the optical optical communications revolution and it allows the
letter to continue its exponential growth. Optical networking represents the next advance
in optical communication technology. Semiconductor optical amplifier is a kind of key
devices for all-optical networks (Dutta & Wang, 2006). The advances in research and many
technological innovations have led to superior designs of semiconductor optical amplifiers.
Semiconductor optical amplifiers are suitable for integration and can be used as signal
amplification and functional devices, such as optical demultiplexing, wavelength conversion,
and optical logic elements make them attractive for all-optical network and optical time
division multiplexed systems (Kaminow & Li, 2002) (Kaminow et al, 2008).
The theory of pulse propagation in semiconductors is well known (Shimada et al, 1994).
The semiconductor optical amplifiers are treated as a two-level system. When the carrier’s
intra-band relaxation time τ
in
in the conduction band is induced, solving the problem
become complex. Fortunately, the intra-band relaxation time τ
in
is generally about 0.1 ps in
semiconductor devices. It is supposed that the pulse width of input optical signals τ
p
≥ 1.0ps,
solving this problem will become very simple. It is to said that the condition τ
p
τ
in
is always
satisfied. In our research, this condition is easily satisfied. At the same time, given that the
semiconductor optical amplifier cavity is very short, and the dispersion of the waveguide in
the semiconductor optical amplifier can be neglected, and the we can obtained the equations
that described transmission actions of the input pulses in semiconductor optical amplifiers as
follows:
∂P
(z,τ)
∂t
=(g(z,τ) − α
int
) · P(z,τ), (1)
∂φ
(z,τ)
∂z
= −
1
2
α
LEF
· g(z,τ), (2)
∂g
(z,τ)
∂τ
=
g
0
− g(z,τ)
τ
c
−
g(z,τ) · P(z,τ)
E
sat
, (3)
where P
(z,τ) and φ(z,τ) denote instantaneous power and phase respectively, g(z,τ) is
the saturation gain parameter, α
int
is the loss coefficient of the semiconductor optical
amplifier cavity, g
0
denotes the small signal gain, α
LEF
is the line-width enhancement
168
Advances in Optical Amplifiers
Chromatic Dispersion Monitoring Method Based
on Semiconductor Optical Amplifier Spectral Shift Effect in 40 Gb/s Optical Communication Systems
5
factor, τ = t − z/υ
g
, υ
g
is the group velocity of the light, and E
sat
is the saturation of the
semiconductor optical amplifier. Equation (2) describes the self-phase modulation (SPM) of
the semiconductor optical amplifier. Our chromatic dispersion monitoring method is based
on this nonlinear effect.
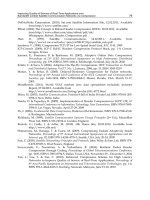
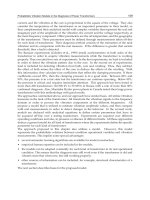
(a) Waveforms of the amplified Gauss pulses with different peak
power.
(b) Spectra of the amplified Gauss pulses with different peak
power.
Fig. 2. Waveforms and corresponding spectra of the amplified Gauss pulses with different
peak power after amplified by the semiconductor optical amplifier.
Without loss of generality, we show the principle of the chromatic dispersion monitoring
methods using Gauss profile pulses due to their simplicity, although the optical pulses with
the carrier suppressed return to zero modulation format cannot be approximated by Gauss
profile pluses. Firstly, we study the influence on the shape and spectrum of input signal
169
Chromatic Dispersion Monitoring Method Based on
Semiconductor Optical Amplifier Spectral Shift Effect in 40 Gb/s Optical Communication Systems
6 Advances in Optical Amplifiers
pulses in a semiconductor optical amplifier in theory. In our study, the small signal gain g
0
is 30dB, and the spontaneous carrier lifetime τ
c
is 140ps. The line-width enhancement factor
α
LEF
is decided by the peaks of input signal pulses, and its typical values for semiconductor
lasers and semiconductor optical amplifiers are in the range between 3 to 8 (Shimada et al,
1994). Let α
LEF
= 5 in our research. The input Gauss profile pulses can be written as:
A
in
(τ)=
P
in
ex p
−
1 + iC
2
τ
τ
0
2m
, (4)
where P
in
and C denote peak power and chirp parameter of the input signal pulses,
respectively, m is the pulse amplitude. In order to further simplify this problem, we suppose
the chirp paraments of the input signal pulses to be C
= 1 and Gauss function of the order
m
= 1. In our theoretical system, the wavelength of the carrier light wave is 1550nm, the pulse
width equals 0.2 bit period, and the single-channel speed of the optical communication system
is 40Gbit/s. The numerical simulating software is Optisystem 6.0 from OptiWave
R
Inc. of
Canada.
The waveform shapes and spectra curves of the transmitted pulses with different peak
powers, after amplified by the semiconductor optical amplifier, are shown in Fig. 2. Figure
2(a) shows the waveform shapes and Figure 2(b) shows corresponding spectra curves of
the amplified transmitted optical signal pulses with Gauss profile. In Figure 2(b), the blue
shadowed part indicates the filter band of the band-pass optical filter, which can select
corresponding frequencies’ power to be detected in our chromatic dispersion monitoring
method, which will be demonstrated in detail in the following parts of this chapter. From this
figure, we can conclude that the amplified Gauss pulses lose their symmetry with increasing of
the input light pulse peak power, the leading edge is more sharper compared with the trailing
edge. This is because the leading edge experiences more larger gain than that of the trailing
edge. The spectrum of the amplified optical signals develops a structure with multi-peaks,
with the dominant spectral peak shifting to the long wavelength side (red shift) as the input
pulse peak power increases. The physical mechanism behind the spectral shift and distortion
is the self phase modulation, which occurs as a result of index nonlinearities induced by gain
saturation effect.
Our dynamical chromatic dispersion monitoring method is based on the spectral effect
resulted from self phase modulation effect of the semiconductor optical amplifier, as
mentioned previously. As an optical signal pulses transmitting in an optical fiber link with
chromatic dispersion, the peak power of the optical signal pulses are influenced by the
chromatic dispersion. Because the self phase modulation is related to the peak power of the
input pulses, the peak power decides the spectral shift effect. As shown in Figure 2(b), we
can use a band-pass optical filter to obtain the corresponding frequencies’ power and use it to
accomplish online dynamical chromatic dispersion monitoring, because the power depends
on chromatical dispersion of optical communication fiber links sensitively.
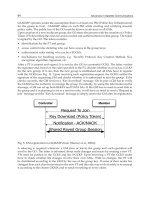
3. Experimental System
Figure 3 shows our dynamical chromatic dispersion monitoring system. The optical carrier
comes from the continuous wave (CW) laser with center wavelength 1553.40nm and is sent
into a 40Gbit/s pseudo random binary sequence (PRBS) system with suppressed return to
zero modulation format is shown in Figure 4. As shown in this figure, the optical carrier
frequency — 1553.40nm, is wholly suppressed, the frequency difference of the two first-order
170
Advances in Optical Amplifiers
Chromatic Dispersion Monitoring Method Based
on Semiconductor Optical Amplifier Spectral Shift Effect in 40 Gb/s Optical Communication Systems
7
harmonic wave peaks is 40GHz, and the frequency difference is also 40GHz between the
high-order (order
>1) harmonic waves and the neighboring lower-order harmonic waves.
Fig. 3. Experimental system of dispersion monitoring based on semiconductor optical
dispersion spectral shift effect.
Output optical signals from the pseudo random binary sequence system are transmitted
into an optical fiber link that consists of some single-mode fibers with positive chromatic
dispersion and some conventional dispersion compensation fibers with negative chromatic
dispersion. In order to simulate the dynamical residual chromatic dispersion of a dynamical
fiber links, we can obtain different chromatic dispersion values for the experiment by
changing the length of single-mode fibers and that of the dispersion compensation fibers.
The optical signals are then transmitted in to a dynamical chromatic dispersion compensation
module, which can compensate the remnant chromatic dispersion using the monitoring signal
from our proposed chromatic dispersion monitoring method. This dispersion compensation
module is based on a thermally tunable optical fiber grating (Sun et al., 2006) (Chen et al.,
2007). Output from compensation system, the optical signal stream is sent to an optical fiber
coupler and is split into two signal streams with different optical power, the optical power
ratio of the two signal streams is 20:80. One signal stream with large optical power is received
by a digital sampling, oscilloscope after an attenuator. The other signal stream with small
optical power is more further split into other two signal streams with the same optical power
after going through a semiconductor optical amplifier and an isolator by a 3dB optical fiber
coupler. one is received by an optical detector at an obtained optical power P
2
; another
is received by other optical detector at an obtained optical power P
1
after an optical fiber
circulator and an optical fiber grating that can reflect parts of the spectrum denoted by part I,
part II and part III, as shown in Figure 4. The semiconductor optical amplifier is a product of
the Center for Integrated Photonics
R
(CIP) Ltd. of the United Kingdom. The product type is
SOA-NL-OEC-1500.
If we only used the optical power P
1
to monitor the chromatic dispersion of the optical fiber
communication links, it is influenced easily by the optical power fluctuation in the optical fiber
communication system links. In order to avoid this influence, in our dynamical chromatic
dispersion monitoring method, we use the radio (P
1
/P
2
) of the obtained optical power P
1
to
the obtained optical power P
2
to monitor the remnant chromatic dispersion of a high speed
171
Chromatic Dispersion Monitoring Method Based on
Semiconductor Optical Amplifier Spectral Shift Effect in 40 Gb/s Optical Communication Systems
8 Advances in Optical Amplifiers
optical fiber communication system, because the optical power radio is independent of the
optical power variety in the optical fiber communication system links.
As mentioned previously, similar to the optical spectrum of Gauss profile pulses shown in
Figure 2(b), the peak of the amplified output optical spectrum will shift toward the more
longer wavelength side as the peak power of input pulses increases, as shown in Figure 5. The
amplified output optical spectrum symmetry is lost. The optical power of the long wavelength
side is higher than that of the short wavelength side.
Fig. 4. Back to back spectrum of optical signals in high speed optical communication system
with 40Gbit/s single-channel speed.
Fig. 5. Spectrum of output optical signals after amplified by the semiconductor optical
amplifier in high speed optical communication system with 40Gbit/s single-channel speed.
172
Advances in Optical Amplifiers
Chromatic Dispersion Monitoring Method Based
on Semiconductor Optical Amplifier Spectral Shift Effect in 40 Gb/s Optical Communication Systems
9
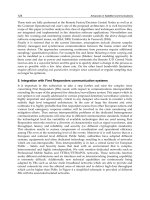
(a) Monitoring curve using optical fiber grating filter with center
wavelength 1553.72nm
(b) Monitoring curve using optical fiber grating filter with center
wavelength 1554.04nm
Fig. 6. Dispersion monitoring curves using optical fiber grating filter with center
wavelengthes 1553.72nm and 1554.04nm, respectively.
To obtain an optimal chromatic dispersion monitoring signal, one needs to filter part of the
output amplified spectrum to detect the optical power of spectral shift components. However,
because the distribution of the spectral shift resulting from self phase modulation effect spans
a wide frequency range, it needs an optimal scheme of the filter that can output the power
of spectral shift components for chromatic dispersion monitoring. As shown in Figure 4, the
power of each separate harmonic wave peak is higher than the shift frequencies’ power due
to the frequency shift effect. Thus, the separate harmonic wave peaks should be excluded
from the filter pass-band. The short wavelength spectrum side is not suited for chromatic
173
Chromatic Dispersion Monitoring Method Based on
Semiconductor Optical Amplifier Spectral Shift Effect in 40 Gb/s Optical Communication Systems
10 Advances in Optical Amplifiers
dispersion monitoring due to its multi-peaks structure, as shown previously. We divide the
spectrum of the long wavelength side into three parts, (part I, part II and part III masked
by three colored shadows, as shown in Figure 4 and 5) with frequency ranges 20-60 GHz,
60-100 GHz and 100-140GHz offset from center frequency (the wavelength is 1553.40 nm) of
the optical spectrum, respectively. The spectral range part III beyond the wavelengths of part
II is ignored due to low optical power.
It will be proved that the more narrow the band filter used, the more chromatic dispersion
monitoring precision can be achieved in our method, but the output power will be too low
to detect and can fail more easily due to the noise of the photoelectric diodes and optical
amplifiers. In our method, the 3dB reflective band of the optical grating is 20 GHz; thus, we
can obtain enough optical power to monitor chromatic dispersion and exclude the harmonic
wave peaks from the pass band of the filter by careful choosing the filter center wavelength.
In order to obtain preferable monitoring conditions, we use two optical fiber gratings filters
with center wavelengths of 1553.72nm and 1554.04nm respectively for our analysis and
discussion. The 3dB reflective bands of the two optical fiber grating filters are all 20GHz,
i.e. their reflective bands are all 0.16nm. The reflective band of the optical fiber grating filter
with center wavelength 1553.72nm is stood in part I and other is located in part II, as shown
in Figure 4 and Figure 5.
Fig. 7. Dependence of the chromatic dispersion monitoring precision on the filter center
wavelength without the influence of the power of the signal peaks.
Figure 6 shows the chromatic dispersion curves in high speed optical fiber communication
system with a single-channel speed of 40Gbit/s and suppressed return to zero (CSRZ)
modulation format using the two optical fiber grating filters, which have mentioned above.
Using the optical fiber grating filter with center wavelength 1553.72nm, the chromatic
dispersion monitoring range is
±120ps/nm and the monitoring precision is about 10ps/nm,
as shown in Figure 6(a). However, using the optical fiber grating filter with center wavelength
1554.04nm, the chromatic dispersion monitoring range is
±60ps/nm and the monitoring
precision is higher than 5ps/nm, as shown in Figure 6(b). It can conclude that we can achieve
more smaller chromatic dispersion monitoring range and more higher monitoring precision
if we used an optical fiber grating filter with center wavelength located in part III of the
174
Advances in Optical Amplifiers
Chromatic Dispersion Monitoring Method Based
on Semiconductor Optical Amplifier Spectral Shift Effect in 40 Gb/s Optical Communication Systems
11
suppressed return to zero modulation format signals’ spectrum curve, as shown in Figure
4 and 5.
(a) Signal eye diagram of before chromatic dispersion
compensation.
(b) Signal eye diagram of afert chromatic dispersion
compensation.
Fig. 8. Signal eye diagrams tested by Tektronix
R
TDS8200 digital sampling oscilloscope of
before and after chromatic dispersion compensation.
Figure 7 shows the dependence of the chromatic dispersion monitoring precision on the
optical fiber grating filter center wavelength without the influence of the power peaks of the
signals, because these peaks are excluded out of the pass band of the optical fiber grating
filter by careful choosing the filter center wavelength. We concluded that the longer the center
wavelength of the optical fiber grating filter used, the more chromatic dispersion monitoring
precision can be achieved. In practice, we must choose an optimal optical fiber grating filter
175
Chromatic Dispersion Monitoring Method Based on
Semiconductor Optical Amplifier Spectral Shift Effect in 40 Gb/s Optical Communication Systems
12 Advances in Optical Amplifiers
to obtain the optimal monitoring range and optimal monitoring precision for the dynamical
chromatic dispersion in high-speed optical fiber communication systems. For a high speed
optical communication system with a single-channel speed of 40 Gbit/s and suppressed
return to zero modulation format, in the chromatic disoersion monitoring system, the best
filter with a center wavelength of 1554.04 nm can be selected.
The eye diagrams of the optical fiber communication system with remnant chromatic
dispersion of 60 ps/nm, before and after chromatic dispersion compensation, are shown in
Figure 8. These eye diagrams were obtained by a Tektronix
R
TDS8200 digital sampling
oscilloscope. Figure 8(a) is an eye diagram before chromatic dispersion compensation, and
Figure 8(b) is a corresponding eye diagram after chromatic dispersion compensation. It can be
concluded that our dynamical dispersion monitoring method, based on semiconductor optical
amplifier spectral shift effect, is preferable for a high speed optical fiber communication
system with a single-channel speed of 40 Gbit/s and suppressed return to zero modulation
format.
4. Conclusion and Discussion
We demonstrated a dynamical chromatic dispersion monitoring method for high speed
optical fiber communication systems. This method is based on the spectral shift resulting from
self phase modulation of semiconductor optical amplifier. The more longer the wavelength
components used for chromatic dispersion monitoring, the more monitoring precision of
this method can be achieved, but the monitoring range becomes small simultaneously.
Thus, in practice we must carefully consider the chromatic dispersion monitoring range and
monitoring precision at the same time. This can be achieved by choosing an optimal optical
fiber grating filter. For a high speed optical fiber communication system with a single channel
speed of 40Gbit/s and suppressed return to zero format modulation, we use the optical fiber
grating, with center wavelength and band width of 1554.04 nm and 20GHz respectively, as the
optical filter. The chromatic dispersion monitoring range is
± 60 ps/nm and the chromatic
dispersion monitoring precision is higher than 5 ps/nm in our method. Therefore, this
technique is promising for use in remnant chromatic dispersion online monitoring in 40Gbit/s
optical communication systems. In addition, it can be used for other high speed optical fiber
communication systems by minimized modification.
5. Acknowledgments
The author thanks the Foundation of Guangxi Key Laboratory of Information and
Communication and the foundation from the National Key Laboratory of Electromagnetic
Environment of P. R. China for their supports. Most of the research work of this Chapter
demonstrated is finished in Department of Electronic Engineering of Tsinghua University of
P. R. China, during the postdoctoral stage of Prof. Ming Chen. The author thanks the Prof. S.
Z. Xie, the tutor of the author’s postdoctoral stage, for his lots of kindly supports, and because
of the lucky opportunity from Prof. Xie, the author can live in the very beautiful Tsinghua
Yuan two years. The author would like to thank Prof. M. H. Chen, Dr. H. W. Chen, Dr. Y.J.
Zhang and all of the members in the Prof. Xie’s research group for their meaningful discussion
and suggestion. Ming Chen’s e-mail addresses are m
or
176
Advances in Optical Amplifiers
Chromatic Dispersion Monitoring Method Based
on Semiconductor Optical Amplifier Spectral Shift Effect in 40 Gb/s Optical Communication Systems
13
6. References
Kaminow, I. P.; Li, T., Willner, A. E. (2008). Optical Fiber Telecommunictions V B: Systems and
Networks, Elsevier Inc., ISDN:978-0-12-374172-1.
Kaminow, I. P.; Li, T. (2002). Optical Fiber Telecommunictions IV B: Systems and Impairments,
Academic Press, ISDN:0-12-395173-9.
Agrawal, G. P. (2008). Fiber-Optic Communication Systems, 3rd Ed., John Wiley & Sons, Inc.,
ISDN:0-471-22114-7.
Pan, Z. Q. (2003). Overcoming fiber dispersion effects in high-speed reconfigure wavelength
division multiplexing optical communication systems and networks. Dissertation for
PhD, University of Southern California, Los Angeles, California, USA.
Bjarklev, A.; Broeng, J.; Bjarklev, A. S. (2003). Photonic Crystal Fibres, Kluwer Academic
Publishers, ISDN:1-4020-7610-X.
Sukhoivanov, I. A.; Guryev, I. V. (2009). Photonic Crystals: Physics and Practical Modeling,
Springer-Verlag, ISDN:978-3-642-02645-4.
Kashyap, R. (2009). Fiber Bragg Gratings, 2nd Ed., Acdemic Press, ISDN:0-12-372579-8.
Ibsen, M.; Durkin, M. K.; Cole, M. J.; Laming, R. I. (1998). Sinc-sampled fiber Bragg gratings
for indential multiple wavelength operation. IEEE Photonics Technology Letters, Vol.10,
No.6, (June 1998) 842-845.
Sun, J.; Dai, Y. T.; Chen, X. F.; Zhang, Y. J.; Xie, S. Z. (2006). Thermally tunable dispersion
compensator in 40Gb/s system using FBG fabricated with linearly chirped phase
mask. Optics Express, Vol.14, No.1, (January 2006) 44-49.
Chen, M.; He, L.; Yang, S.; Zhang, Y.; Chen, H.; Xie, S. (2007). Chromatic sispersion and PMD
monitoring and compensation techniques studies in optical communication systems
with single channel speed 40Gbit/s and CSRZ format. Optics Express, Vol.15, No.12,
(June 2007) 7667-7676.
Chen, M.; Yang, Q.; Li, T.S.; Chen, M.S.; He, N. (2010). New high negative dispersion photonic
crystal fiber. Optik, Vol.121, No.10, (June 2010) 867-871.
Hong, I. W. (2002). Dispersion compensation in fiber optic communication systems. Thesis for
the Degree of Master of Science, San Jose State University, San Jose, California, USA.
Seyed Mohammad Reza Motaghian Nezam. (2004). Chromatic and polarization mode
dispersion monitoring for equalization in optical fiber communication systems.
Dissertation for PhD, University of Southern California, Los Angeles, California,
USA.
Ji, H. C.; Park, k. J.; Lee, J. H; Chung, H. S.; Son, E. S.; Han, K. H; Jun, S. B.; Chung, Y. C. (2004).
Optical performance monitoring techniques based on pilot tones for WDM networks
applications. Journal of Optical Networking, Vol.3, No.7, (July 2004) 510-533.
Pan, Z.; Yu, Q.; Xie, Y.; Havstad, S. A.; Willner, A. E.; Starodubov, D. S.; Feinberg, J. (2001).
Chromatic dispersion monitoring and automated compensation for NRZ and RZ
data using clock regeneration and fading without adding signaling. Conference of 2001
Optical Fiber Communication, Vol.3, Wh5-1.
Ning, G.; Shum, P.; Aditya, S.; Liu, N.; Gong, Y. D. (2006). On-line simultaneous monitoring
of polarization and chromatic dispersion. Applied Optics, Vol.45, No.12, (December
2006) 2781-2785.
Luo, T.; Yu, C.; Pan, Z.; Wang, Y.; Arieli, Y.; Willner, A. E. (2005). Diepersive effects monitoring
for RZ data by adding a frequecy-shifted carrier along the orthogonal polarization
state. IEEE Journal of Lightwave Technology, Vol.23, No.10, (October 2005) 3295-3301.
Wang, Y.; Pan, Z; Sahin, A.; Yan, L; Yu, C.; Willner, A. (2006). In-line chromatic dispersion
177
Chromatic Dispersion Monitoring Method Based on
Semiconductor Optical Amplifier Spectral Shift Effect in 40 Gb/s Optical Communication Systems
14 Advances in Optical Amplifiers
monitoring using optically-added phase-modulated in-band tones for 10Gg/s
system. Tech. Dig. Optical Fiber Communications (OFC 2003), 404-406.
Luo, T.; Yu, C.; Pan, Z.; Wang, Y.; Arieli, Y.; Willner, A. E. (2005). Diepersive effects monitoring
for RZ data by adding a frequecy-shifted carrier along the orthogonal polarization
state. IEEE Journal of Lightwave Technology, Vol.23, No.10, (October 2005) 3295-3301.
Hirano, A.; Kuwahara, Miyamoto, Y. (2002). A novel dispersion compensation scheme based
on phase comparison between to SSB signals generated from a spectrally CS-RZ
signal. Tech. Dig. Optical Fiber Communications (OFC 2002), 196-197.
Wielandy, S.; Fishteyn, M.; Zhu, B. Y. (2004). Optical performance monitoring using nonlinear
detection. IEEE Journal of Lightwave Technology, Vol.22, No.3, (March 2004) 784-793.
Li, S. P.; Kuksenkov, D. V. (2004). A novel dispersion monitoring technique based on four-wave
mixing in optical fiber. IEEE Photonics Technology Letters, Vol.16, No.3, (March 2004)
942-944.
Ihara, T.; Oikawa, Y. (1999). Detection of, and compensation for, waveform change due to
chromatic dispersion. U.S. Patent No.5,999,289, assigned to Fujitsu, Ltd.(Dec 7, 1999).
Chen, M; Zhang, Y. J.; He, L.; Si, Z; Yang, S.; Sun, J.; Zhang, Y.; Chen, H.; Xie, S. (2007).
Simultaneous monitoring methods for chromatic dispersion and polarization mode
dispersion based on polarization modulation. Journal of Optics A: Pure Applied Optics,
Vol.9, No.4, (April 2007) 320-324.
Chen, M.; He, L.; Dai, Y.; Yang, S.; Chen, H.; Xie, S. (2007). Chromatic dispersion monitoring
method based on semiconductor optical amplifier spectral shift in 40Gbit/s optical
communication systems. Optical Engineering, Vol.46, No.11, (November 2007)
115008-1-115008-6.
Dutta, N. K.; Wang, Q. (2006). Semiconductor Optical Amplifiers, World Scientific,
ISDN:981-256-397-0.
Kaminow, I. P.; Li, T. (2002). Optical Fiber Telecommunictions IV A: Components, Academic Press,
ISDN:0-12-395172-0.
Kaminow, I. P.; Li, T., Willner, A. E. (2008). Optical Fiber Telecommunictions V A: Components and
Subsystems, Elsevier Inc., ISDN:978-0-12-374171-4.
Shimada, S.; Ishio, H. (1994). Optical Amplifiers and their Applications, John Wiley & Sons.,
ISDN:978-0-47-194005-0.
178
Advances in Optical Amplifiers
0
Slow and Fast Light in Semiconductor Optical
Amplifiers for Microwave Photonics Applications
Perrine Berger
1
, Jérôme Bourderionnet
2
, Daniel Dolfi
3
,
Fabien Bretenaker
4
and Mehdi Alouini
5
1,2,3
Thales Resear ch and Technology
4
Laboratoire Aimé Cotton, CNRS - Université Paris Sud
5
Institut de Physique de Rennes
France
1. Introduction
The generation of continuously tunable optical delays and tunable phase shifts is a key
element in microwave photonics. Among the targeted applications, one can quote the filtering
of microwave signals, the synchronization of optoelectronics oscillators, and the control of
optically fed phased array antennas. With these applications in view, large efforts are currently
done in order to develop delay lines and phase shifters based on slow and fast light effects. To
date, one of the most mature approaches for integration in real field systems is that based
on Coherent Population Oscillations (CPO) in Semiconductor Optical Amplifiers (SOAs).
This approach offers compactness, continuous tunability of the delay or phase shift through
injected current control, and possible high-level parallelism.
Slow and fast light capability of semiconductor devices has been first studied in the past
decade while bearing in mind the delays, the phase shifts and the bandwidth they can
offer. Consequently, in a first section, we present the recent advances in architectures
based on slow and fast light in SOAs for microwave photonics applications. After a
brief introduction about microwave photonics, we present the physical interpretation of
the different architectures proposed in the literature. We point out the underlying physics,
common to these architectures, and evidence the advantages and drawbacks of each of them.
However, within the scope of integration in a realistic radar system, it is also required to study
the impact of these slow and fast light architectures on the performances of the microwave
photonics link. In particular, the RF transfer function, the generation of spurious signals
by harmonic and intermodulation products, and the intensity noise, have to be studied in
order to compute the Spurious Free Dynamic Range (SFDR), a key characteristic in microwave
photonics. Consequently, in a second section, we present the tools to simulate and understand
the RF transfer function, the generation of spurious signals through harmonic distortion and
intermodulation products, and the intensity noise at the output of a SOA.
In a third section, we use the models presented in the previous part in order to investigate the
dynamic range of a microwave photonics link including an architecture based on slow and
fast light in SOAs. We focus on the architecture using a SOA followed by an optical filter.
The models are experimentally validated and the influence on the microwave photonics link
is discussed.
9
2. Background and context
2.1 Slow and fast light for microwave photonics
This section presents microwave photonics and explains why slow and fast light can be useful
for this applied research field.
2.1.1 Microwave phot onics link including a slow and fast light device
Microwave photonics realizes processing of microwave signals (Ω/2π 0.1 - 35 GHz) in
the optical domain using photonic devices. Indeed optics offer some advantages compared
to electronics for the addressing and processing of microwave signals: the most sticking
asset is the low loss transport along an optical fiber (0.2 dB/km) compared to a coaxial cable
(1000 dB/km !). As illustrated in Fig. 1, the basic architecture of a microwave photonics link
is composed of a laser, which creates the optical carrier (λ
0
1.5 μm). The optical carrier
is modulated by the microwave signal either directly, or through an external Mach Zehnder
modulator. Optical devices (represented on Fig. 1 by "slow and fast light device") process the
modulated carrier. At the end of the link, a fast photodiode retrieves the processed microwave
signal.
The aim of our study is to introduce a slow and fast light device in a microwave photonics
link, as it is represented in Fig. 1. Let us consider a monochromatic microwave signal
(whose angular frequency is Ω) and a linear modulator, the optical field E after the modulator
is then composed of the optical carrier E
0
(z)e
−iω
0
t
and two sidebands E
1
(z)e
−i(ω
0
+Ω)t
+
E
−1
(z)e
i(ω
0
−Ω)t
.
After propagation through the slow and fast light device, the microwave signal retrieved by
the photodiode, at the angular frequency Ω,is:
M
OUT
1
=
∑
ω
p
−ω
q
=Ω
E
p
E
∗
q
,(1)
= E
1
E
∗
0
e
i(k
1
−k
0
)L
+ E
∗
−
1
E
0
e
i(k
0
−k
−1
)L
, when both sidebands are detected,
= E
1
E
∗
0
e
i(k
1
−k
0
)L
or E
∗
−
1
E
0
e
i(k
0
−k
−1
)L
, when only one sideband is detected,
where L is the length of the dispersive medium (described by k
i
= k(ω
i
)).
To characterize a microwave photonics link, we study the microwave transfer function
through the complex parameter S
21
=
M
OUT
1
M
IN
1
, whose magnitude and phase can be expressed
as:
|S
21
| = G
2
,(2)
ar g
(S
21
)=ΔkL,(3)
where G is the optical gain of the link, and ΔkL the phase shift introduced by the dispersive
medium (for example Δk
= k(ω
0
+ Ω) − k(ω
0
) when only the sideband E
1
is detected).
Consequently, by governing the dispersion and in particular the optical group velocity v
g
=
dω
dk
of the slow and fast light medium, it is possible to induce a controlled phase shift or delay
on the retrieved microwave signal, which is an important function in microwave photonics,
as it is illustrated in the following sections.
180
Advances in Optical Amplifiers
Phase ĭ='kL
RF frequency
(b) RF Phase shifter
f
operating
'f
RF
Phase ĭ='kL
RF frequency
f
operating
'f
RF
(a) Tunable true time delay
W
Fig. 2. (a) Illustration of tunable true time delay. (b) Illustration of RF phase shifter.
This definition is illustrated on Fig. 2.
This component exists in the microwave world (contrary to the true time delay lines).
However, more and more RF functions are developed by photonic means. Consequently,
tunable RF phase shifter in the optical domain is required in order to avoid useless
Optical/Electronical and Electronical/Optical conversions. Among the targeted applications,
one can quote the filtering of microwave signals: on each arm a phase shifter over
an instantaneous bandwidth Δ
is required; or optoelectronics oscillators, either for
synchronization or tunability: in this case, only a phase shifter at the operating frequency
is required.
To date, one of the most mature approaches of slow and fast light medium for integration in
real field systems is that based on Coherent Population Oscillations (CPO) in semiconductor
optical amplifiers (SOAs). This approach offers compactness, continuous tunability of the
delay or phase shift through injected current control, and possible high-level parallelism. We
present in the following paragraphs the basic concepts of this technique.
2.2 Coherent Population Oscillations (CPO) in Semiconductor Optical Amplifier ( SOA)
This section introduces the basic concepts and the main equations involved in Coherent
Population Oscillations (CPO) in a Semiconductor Optical Amplifier (SOA), and explains
how this phenomenon induces slow and fast light. We describe the SOA behavior by a
phenomenological model initially described for semiconductor lasers by Agrawal & Dutta
(1993), and which was initially used to describe CPO in SOA (Agrawal, 1988; Mørk et al.,
2005). It gives a good insight in the involved phenomena. However, this model, initially
developed for lasers, must be cautiously used in the case of SOAs: its limitations are discussed
in section 4, where a more rigorous model is developed. From this phenomenological
model, we derive the equations of propagation and analyze the dispersion properties and
in particular the changes in group velocity induced by CPO.
2.2.1 Phenomenological model of SOA
This phenomenological model of SOA, well described by Agrawal & Dutta (1993) is based on
experimental observations of the behavior of semiconductor lasers.
The main assumption of the model consists in considering that the variations of the material
gain and optical index , caused by a small variation of the carrier density Δ ,are
proportional to Δ . The material gain and the optical index can thus be expressed as:
=
¯
+ Δ ,(6)
=
¯
+ Δ ,(7)
182
Advances in Optical Amplifiers
with
¯
and
¯
= (
¯
) the static carrier density and gain,
¯
= (
¯
( )), the static optical index,
and Δ and Δ the variations of the material gain and the optical index caused by a small
change Δ of the carrier density. We assume then:
Δ ∝Δ and Δ ∝Δ . (8)
We introduce the differential gain :
Δ
= Δ ,(9)
and the linewidth enhancement factor α introduced by Henry (1982) to model the index gain
coupling in semiconductor material: α
= −2
0
Δ
ΓΔ
. Then the variation Δ canbewrittenas:
Δ
= −
α
2
0
ΓΔ , (10)
with
0
=
ω
,andΓ the confinement factor. We complete this phenomenological model with
a rate equation, which incorporates all the mechanisms by which the carriers are generated or
lost in the active region:
= −
τ
−
| |
2
¯ ω
0
, (11)
where is the injected current,
| |
2
is the optical intensity inside the SOA, τ is the carrier
lifetime, is the volume of the active region, is the elementary charge, and ω
0
is the angular
frequency of the optical carrier
0
.
2.2.2 Coherent population oscillations
CPOs are induced by an optical carrier which is modulated in intensity at the angular
frequency Ω:
| |
2
=
0
+
1
− Ω
+ . Note that the injected current can also be modulated
(see section 3.3).
If the optical carrier power is large enough, it implies a gain saturation. Indeed, the rate
equation (11) shows that oscillations of the carriers (CPO) are induced :
=
¯
+ Δ
− Ω
+
. At the first order, we can assume a linear variation of the gain and optical index (Eq. 8):
=
¯
+ Δ
− Ω
+ . ., (12)
=
¯
+ Δ
− Ω
+ . . (13)
Finally the Eqs. 9 and 11 lead to the expression of the gain variation Δ (and then Δ thanks
to Eq. 10):
Δ
=
1 +
0
/ − Ωτ
, (14)
where
0
is the DC component of the optical intensity, the saturation intensity, and for
sake of clarity, is considered here as a constant (for example
= −
¯
1
/ when only the
optical intensity is modulated, see section 4).
The optical index is then time and frequency dependent due to the CPO, which implies slow
and fast propagation of the light, as we explain in the following paragraphs.
183
Slow and Fast Light in Semiconductor Optical Amplifiers for Microwave Photonics Applications
2.2.3 Equations of propagation
The optical field E( , ) verifies the following wave equation:
∂
2
∂
2
E( , )=
1
2
∂
2
∂
2
E( , ), (15)
where
is the relative permittivity.
We expand the optical field as
E( , )=
∑
( )
(
˜
β
−ω )
,where
˜
β
is the complex
propagation constant.
0
accounts for the optical carrier, and
±1
the modulation sidebands
at ω
±1
= ω
0
±Ω. The complex propagation constant can be expressed as:
˜
β
=
0
˜
μ
=
0
√
, (16)
with
0
=
ω
and
˜
μ the complex optical index, which can be written as:
˜
μ
= +
−Γ + γ
2
0
, (17)
where is the real refractive optical index, and γ holds for internal losses. From Eqs. 12, 13
and 17, the complex optical index
˜
μ can be expanded as:
˜
μ
=
˜
μ
0
+ Δ
˜
μ
− Ω
+ . ., with:
˜
μ
0
=
¯
+
2
0
(
−
Γ
¯
+ γ
)
,
Δ
˜
μ
= −
α +
2
0
ΓΔ . (18)
Lastly, we derive the equations of propagation from Eqs. 15, 18 and
=
˜
μ
2
:
0
=
1
2
(
Γ
¯
−γ
)
0
,
1
=
1
2
(
Γ
¯
−γ
)
1
+
1 − α
2
ΓΔ
0
,
−1
=
1
2
(
Γ
¯
−γ
)
−1
+
1 − α
2
ΓΔ
∗
0
. (19)
2.2.4 Slow and fast light induced by CPO
We have shown in the previous paragraph that the modulation of the optical intensity leads
to CPO, which induces a frequency dependence of the complex optical index. We illustrate
here how it induces slow and fast light.
We define the real,
, and imaginary, , parts of the index:
˜
μ = + . The Eqs. 14 and
18 lead to the following expressions of the variations of the real and imaginary parts of the
optical index, induced by CPO:
Δ
= {Δ
˜
μ} = −
2
α
(1 +
0
/ ) −Ωτ
(1 +
0
/ )
2
+(Ωτ )
2
, (20)
Δ
= {Δ
˜
μ} = −
2
(1 +
0
/ )+αΩτ
(1 +
0
/ )
2
+(Ωτ )
2
, (21)
where Ω is the angular frequency of the CPO, is the angular frequency of the considered
optical field component, and
=
0
+ Ω with
0
the angular frequency of the optical carrier.
184
Advances in Optical Amplifiers
−100 0 100
2
wave number k (m
−1
)
detuning Ω (GHz)
c)
c)
−20 −10 0 10 20
−4
−2
0
2
4
Δ n
im
(x 10
−6
)
detuning Ω (GHz)
a)
a)
−20 −10 0 10 20
0
2
4
6
8
Δ n
r
(x 10
−6
)
detuning Ω (GHz)
b)
b)
10
−6
Fig. 3. Variations of (a) the imaginary part Δ of the complex optical index (proportional to
the absorption), (b) the real part Δ
of the complex optical index, and (c) the wave number .
In blue, for semiconductor material (where α
= 0), and in dashed red line, for an equivalent
2-level atomic resonance (where α
= 0). Parameters: α = 5 (blue line) or α = 0(reddashed
line),
0
/ = 1, = −4000
−1
, τ = 450 , = 3, λ
0
= 1.5μ .
The variations of the imaginary Δ
and real Δ parts of the optical index are displayed on
Fig.3(a) and (b). Δ
and Δ are related by the Kramers-Kronig relationship. We illustrate
that for semiconductor material, due to the coupling index-gain (modeled by the factor α), the
variation of the imaginary Δ
optical index, proportional to the variation of the absorption,
is asymmetric: it has been first observed by Bogatov et al. (1975). The variation of the optical
index with respect to the frequency is then very different from the case of 2-level atomic
resonance (represented in dashed red line in Fig. 3).
The frequency dependence of the optical index leads to a strong dispersion in the vicinity of
the frequency of the optical carrier: as illustrated on Fig.3(c), the real wave number
(ω)=
(ω)ω
differs then from the "normal" refraction
ω
(represented by the black dotted straight
line). This is associated with a variation of the group velocity of the light, which can be defined
as
=
ω
. Consequently, CPO create here ( < 0) "fast light" for positive detuning Ω > 0
(
ω
< 0), and "slow light" for negative detuning Ω < 0(
ω
> 0). In comparison, a 2-level
atomic resonance create essentially fast light at low detuning:
|Ω| < a few GHz. As the
amplitude of CPO is controlled by either the input optical power (
0
) or the injected current
(though the parameter ), the group velocity can be tuned and controlled, which opens the
possibility to conceive optical delay lines and optical phase shifters for microwave signals, as
we will explain it in the following part.
The arrival time τ (to a detector for example) of a signal propagating through this slow and fast
light medium has to be carefully handled. Indeed it is equal to the group delay simply defined
as τ
=
ω
|
¯
ω
,with
¯
ω the central optical frequency of the signal, only if the modulation before
the photodiode is Single-SideBand (SSB), and if the bandwidth of the signal is smaller than
the CPO bandwidth (
< 1 GHz). We will highlight this last point in the following part. For
further details on the definition of the arrival time for optical pulses, you can refer to (Peatross
et al., 2000).
185
Slow and Fast Light in Semiconductor Optical Amplifiers for Microwave Photonics Applications
3. Advances in architectures based on slow and fast light in SOAs for microwave
photonics applications
In the previous part, we saw the underlying physics of the slow and fast light generated by
Coherent Population Oscillations (CPO) in SOAs. We present here the different architectures
based on this phenomenon, which are proposed for microwave photonics applications. In
the first section, we present an architecture of an optical delay line. In the second section, we
show that by changing the modulation format before the photodiode, the latter architecture
becomes an optical phase shifter for microwave signals. Lastly, we present an alternative
set-up to realize an optical RF phase shifter, by using forced CPO.
3.1 SOA-based optical delay line
3.1.1 Set-up, experimental results and equations
This architecture is the first proposed in literature (Mørk et al., 2005; Pesala et al., 2006). The
set-up is quite simple: the slow and fast light device (represented in Fig. 1) included in the
microwave link is a single SOA. The corresponding experimental results are presented on
Fig. 4. The microwave gain
|
21
| present a high pass filter behavior, usually observed in SOAs
(Boula-Picard et al., 2005), and is associated to an interesting phase shift, which presents a
linear variation at low frequency, with a slope tunable through the injected current or the
optical input power: a key characteristic to set up a tunable delay line (see Fig. 2).
These results are not in adequation with the expected behavior of a semiconductor material
in which the coupling index-gain is significant (α
= 0) (displayed in Fig. 3), but it is similar
to the material where α
= 0: indeed a negative delay (which is then an advance, associated
to a so called "fast light") is detected at low frequency (
< GHz). However it can be easily
explained by the double-sideband modulation format before the detector. Indeed, as both
the modulation sidebands are detected, the RF retrieved signal at the angular frequency Ω is
1
=
1
∗
0
+
−1
∗
0
, and Eq. 19 leads to:
1
=
[
−γ + Γ
¯
]
1
+ ΓΔ
0
, (22)
with Δ deduced from the rate equation (11):
Δ
= −
¯
1
/
1 +
0
/ − Ωτ
, (23)
with
=
¯ ω
Γ τ
. We notice then that the contribution of the coupling gain-index is canceled
out when both the sidebands are detected, which explains that the gain and phase shift are
similar to a material where α
= 0.
3.1.2 Analysis of the different contributions. Physical interpretation
We integrate Eq. 22 over a small slice , whose length is noted , to derive an analytical
expression of the RF transfer function
21
=
1
( )
1
(0)
:
1
( )
1
(0)
= A+
1
2
G , (24)
with
A = 1 −γ + Γ
¯
corresponding to the optical amplification (average RF gain) and G
the contribution due to CPO, which are induced by the modulation of the optical intensity:
186
Advances in Optical Amplifiers
(b) Gain and Phase vs frequency (fixed input power)
Constant current
(a) Slow and fast light device
Modulated optical intensity
0 1 2 3
-15
-10
-5
0
5
10
15
20
25
30
35
Frequency (GHz)
Gain (dB)
0 1 2 3
-30
-25
-20
-15
-10
-5
0
Frequency (GHz)
Phase (deg)
I=75 mA
I=100 mA
I=150 mA
I=350 mA
Fig. 4. SOA-based optical delay line. (a) Slow and fast light device. (b) Experimental results:
gain and phase shift of the RF signal, at a fixed input optical power (1 mW), for different
currents. Results extracted from (Berger, Alouini, Bourderionnet, Bretenaker & Dolfi, 2010).
G = ΓΔ
0
(0)/
1
(0)=
−
2Γ 0
0
/
1 +
0
/ − Ωτ
. (25)
We represent the module and the argument of the amplification
A and the CPO contribution
G on Fig. 5. The optical amplification A is in phase with the incident signal, and constant
with respect to the RF frequency. At low frequency Ωτ
< 1, G is in antiphase with the
incident modulated signal. Indeed, the carrier density is modulated by saturation due to
the modulated optical intensity: a larger number of carriers will decay near the maximum
intensity than near the minimum. Consequently the carrier density is modulated in antiphase
with respect to the incident signal, generating a gain also in antiphase. At high frequency
Ωτ
> 1, the carriers can no longer follow the optical modulation, and the efficiency of the
gain modulation decreases. This explains the low pass filter behavior of
G displayed on
Fig. 5. Moreover, in Fig. 5(a), we note that the amplification
A is always dominant compared
to
G : consequently at low frequency Ωτ < 1, the modulated gain G in antiphase with
respect to the incident signal decreases the total gain. This explains the dip at low frequency
on the module of the RF transfer function, which is associated with an interesting phase shift,
opening the possibility to conceive a tunable delay line.
3.1.3 Evaluation of the performances for a tunable delay line
We assume the plane-wave approximation:
1
( )=
˜
1
˜
β
. Even if it is not truly accurate,
it is helpful to understand the essential physics and to evaluate the order of magnitude of
187
Slow and Fast Light in Semiconductor Optical Amplifiers for Microwave Photonics Applications
0,01 0,1 1 10
-10
-5
0
5
10
15
20
25
:
W
s
Gain (dB)
(b) Optical filtering
0,01 0,1 1 10
-200
-150
-100
-50
0
Phase (°)
CPO
contribution
Amplification
Total RF transfer
function
Total RF transfer
function
CPO
contribution
Amplification
antiphase
Fig. 5. Contributions and resulting total transfer function.
achievable delay and bandwidth. From Eq. 22, we can deduce the complex propagation
constant
˜
β:
˜
β
= −
−γ + Γ
¯
−
Γ
¯
0
/
1 +
0
/ − Ωτ
. (26)
After a small slice , if we assume that the gain compensates losses, the output signal is then:
1
(0)
− Ω( −τ)
,with:
τ
= −
Γ
¯
0
/
(1 +
0
/ )
2
+(Ωτ )
2
τ (27)
−
Γ
¯
0
/
(1 +
0
/ )
2
τ at low frequency Ωτ < 1 +
0
/ . (28)
Consequently, at low frequency, CPO introduce a true time advance τ (negative delay,
independent on the frequency Ω): Eq. 28 gives the limit of the achievable delay and
bandwidth.
It is possible to make a rough evaluation of the maximal achievable bandwidth-delay product,
by assuming the saturation parameters (
, τ , Γ
¯
) constant with the current and the input
optical power :
(
Δ ∗ τ
)
<
1
2π
0
/
1 +
0
/
(
Γ
¯
)
. (29)
The higher the input optical power
0
is, the higher the bandwidth-delay product is. A
SOA with a high gain is suitable. However the maximal advance (negative delay) achievable
for a given current is: τ
( )=−
1
4
Γ
¯
τ for a strong input optical power
0
/ ∼ 1.
The delays are tunable from 0 to τ
( )(< 0),asthegain
¯
governed by the injected
current . The delay is null at the transparency, and can be positive when the SOA is in
the absorption regime (but it is associated with high losses on the RF signal). In order to
refine the performances, and take into account saturation effects, we use the mean saturation
188
Advances in Optical Amplifiers
parameters ( , τ , Γ
¯
) along the SOA, calculated from the model presented in section 4,
for a given current and input optical power. For example, a commercial SOA (InP/InGaAsP
Quantum Well Booster Amplifier from COVEGA) has a maximal tunable advance of
≈ 516ps
(
≈ 120ps) over an instantaneous bandwidth < 590MHz (< 410MHz) for an input optical
power of 20mW (1mW).
The major axes of research are now to find the best material to increase these performances,
and try to find an architecture which enables to translate these characteristics at any operating
frequency.
3.2 CPO enhanced by index-grating coupling
3.2.1 Set-up, experimental results and equations
(b) Gain and Phase vs input optical power
Constant current
(a) Slow and fast light device
Modulated optical intensity
Notch filter
Fig. 6. CPO enhanced by index-grating coupling. (a) Slow and fast light device. (b)
Experimental results: gain and phase shift of the RF signal, at a fixed current (1 mW), with
respect to different input optical power. Graph arranged from (Xue et al., 2008).
As it is explained in the previous paragraph, when both the modulation sidebands are
detected by the photodiode, the contribution of the index-gain coupling is canceled out. In
order to benefit from the enhancement of the gain and index gratings by the index-gain
coupling, Xue et al. (2008) analyze an architecture including an optical notch filter before the
photodiode in order to select one sideband (see Fig. 6(a)). They showed that an enhanced
phase shift up to
+150
◦
is detected only when the red shifted sideband is blocked, compared
to
−20
◦
for other configurations (see Fig. 6(b)).
Consequently the RF retrieved signal at the Ω is either
=
1
∗
0
when the red-shifted
sideband is blocked or
=
−1
∗
0
when the blue shifted sideband is blocked. Eq. 19 leads to:
=
[
−γ + Γ
¯
]
+
1 + α
2
ΓΔ
0
, (30)
=
[
−γ + Γ
¯
]
+
1 − α
2
ΓΔ
0
, (31)
189
Slow and Fast Light in Semiconductor Optical Amplifiers for Microwave Photonics Applications