Báo cáo hóa học: "Assessment of skeletal muscle fatigue of road maintenance workers based on heart rate monitoring and myotonometry" docx
Bạn đang xem bản rút gọn của tài liệu. Xem và tải ngay bản đầy đủ của tài liệu tại đây (414.76 KB, 9 trang )
BioMed Central
Page 1 of 9
(page number not for citation purposes)
Journal of Occupational Medicine
and Toxicology
Open Access
Research
Assessment of skeletal muscle fatigue of road maintenance workers
based on heart rate monitoring and myotonometry
Zenija Roja
1
, Valdis Kalkis*
1
, Arved Vain
2
, Henrijs Kalkis
3
and Maija Eglite
4
Address:
1
Faculty of Chemistry, University of Latvia, Kr. Valdemara 48, Riga LV-1013, Latvia,
2
Institute of Experimental Physics and Technology,
University of Tartu, Tahe 4, Tartu 51010, Estonia,
3
Faculty of Economics and Management, University of Latvia, Aspazijas bulv.5, Riga LV-1050,
Latvia and
4
Institute of Occupational and Environmental Health, Riga Stradins University, Dzirciema 16, Riga LV-1007, Latvia
Email: Zenija Roja - ; Valdis Kalkis* - ; Arved Vain - ;
Henrijs Kalkis - ; Maija Eglite -
* Corresponding author
Abstract
Objective: This research work is dedicated to occupational health problems caused by ergonomic
risks. The research object was road building industry, where workers have to work very
intensively, have long work hours, are working in forced/constrained work postures and overstrain
during the work specific parts of their bodies. The aim of this study was to evaluate the work
heaviness degree and to estimate the muscle fatigue of workers after one week work cycle. The
study group consisted of 10 road construction and maintenance workers and 10 pavers aged
between 20 and 60 years.
Methods: Physical load were analyzed by measuring heart rate (HR), work postures (OWAS) and
perceived exertion (RPE). Assessments of the muscles strain and functional state (tone) were
carried out using myotonometric (MYO) measurements. The reliability of the statistical processing
of heart rate monitoring and myotonometry data was determined using correlating analysis.
Results: This study showed that that road construction and repairing works should be considered
as a hard work according to average metabolic energy consumption 8.1 ± 1.5 kcal/min; paving, in
its turn, was a moderately hard work according to 7.2 ± 1.1 kcal/min. Several muscle tone levels
were identified allowing subdivision of workers into three conditional categories basing on muscle
tone and fatigue: I – absolute muscle relaxation and ability to relax; II – a state of equilibrium, when
muscles are able to adapt to the work load and are partly able to relax; and III – muscle fatigue and
increased tone. It was also found out that the increase of muscle tone and fatigue mainly depend
on workers physical preparedness and length of service, and less – on their age.
Conclusion: We have concluded that a complex ergonomic analysis consisting of heart rate
monitoring, assessment of compulsive working postures and myotonometry is appropriate to
assess the work heaviness degree and can provide prognosis of occupational pathology or work-
related musculoskeletal disorders for the workers under different workload conditions. These
results can also be used when deciding on necessary rest time and its periodicity.
Published: 27 July 2006
Journal of Occupational Medicine and Toxicology 2006, 1:20 doi:10.1186/1745-6673-1-20
Received: 29 January 2006
Accepted: 27 July 2006
This article is available from: />© 2006 Roja et al; licensee BioMed Central Ltd.
This is an Open Access article distributed under the terms of the Creative Commons Attribution License ( />),
which permits unrestricted use, distribution, and reproduction in any medium, provided the original work is properly cited.
Journal of Occupational Medicine and Toxicology 2006, 1:20 />Page 2 of 9
(page number not for citation purposes)
Background
It is well-known that work related diseases of muscle and
skeletal system are prevalent all over Europe. In Latvia,
where the amount of work and its intensity in the con-
struction sector has substantially increased after joining
the European Union in 2004, one of the main tasks of
occupational health care is to prevent work related inju-
ries. Similarly, despite mechanization the number of
occupational diseases, as well as cumulative trauma disor-
ders (CTD) caused by overwork, has rapidly increased in
Latvia. They are caused by ergonomic factors of the work
environment, such as physical overload, compulsive
working postures, local stiffness of definite muscle groups
and an adverse microclimate. CTD is not easy to diagnose
and is difficult to treat; therefore, these disorders need to
be prevented. Prevention is possible if the changes in the
skeletal muscles causing CTD are identified as early as
possible.
The aim of this study was to assess the work heaviness bas-
ing on heart rate monitoring and to assess muscle fatigue
of workers after one week work cycle applying myotono-
metric method and special equipment to perform biome-
chanical diagnostics of functional state of skeletal
muscles. This study deals also with the monitoring of
workers' ability to adapt to intensive physical loads.
Workers from the road construction sector were chosen
for this research because road maintenance and repair
work is characterized by very variable work cycles with dif-
fering difficulty levels when specific works have to be per-
formed.
For the study workers were selected following such crite-
ria: full-time workers, no acute musculoskeletal symp-
toms, work experience of at least one year in the
construction industry, and full consent to participate. The
study plan was accepted by the Ethics Committee of the
Paul Stradins University's Institute of Occupational and
Environmental Health.
Study group and methods
Study design
One of the largest road building companies in Latvia with
more than 600 employees was chosen. The examination
was offered to workers whose work is characterized by var-
iable work cycles and performance of specific works.
Although the research involved more than 100 persons,
more demonstrative results are shown and work heavi-
ness, as well as changes of muscle tone are analyzed for
those workers who work in groups (teams). The all-male
group consisted of road workers (10) and pavers (10). All
the workers were right-handed. Background factors of the
subjects are shown in Table 1.
Methods
The work heaviness degree depending on workers physi-
cal activity (intensity) was estimated by heart rate moni-
toring (HRM). The measurement was based on heart rate
(HR) variation, which correlates with oxygen consump-
tion and allows quantifying the objective energy expendi-
ture for each work phases including short rest periods [1].
HRM was performed using POLAR S810i™ Heart Rate
Monitor device and data processing software Polar Preci-
sion Performance. The device sums up the acquired HR data
and transforms them into metabolic energy consumption
(kcal/min). The relative range of the HR (%HRR) was cal-
culated using a following equation: 100*{(HR
work
-
HR
rest
)/(HR
max
-HR
rest
)}[2]. Maximal heart rate was calcu-
lated as the most common formula HR
max
= 220-age,
although there exist most accurate formulas, for example:
HR
max
= 205.8-(0.685*age) [3]. Work heaviness in terms
of energy expenditure was classified according to classifi-
cation scale shown in Table 2.
The work postures were analysed together with HRM from
still videotape frames every 10 s for each work task
(phases) with the OWAS method [6]. Using this method
and WinOWAS software compulsive working postures
were identified and necessary alterations were determined
according to OWAS action categories: Category 1 = Nor-
mal postures, no action required; Category 2 = The pos-
ture is slightly harmful, actions to alter postures should be
taken in the near future; Category 3 = The posture is dis-
tinctly harmful, actions to alter postures should be taken
Table 1: Background factors of the subjects, mean, standard deviation (SD) and range
Variable Road workers (n = 10) Pavers (n = 10)
Mean ± SD Range Mean ± SD Range
Age (years) 40 ± 4 20–60 30 ± 4 30–60
Height (cm) 180 ± 5 173–187 172 ± 7 165–180
Weight (kg) 81 ± 9 65–97 76 ± 6 60–92
Body mass index (BMI, kg/m
2
) 25 ± 6 17–36 25 ± 3 19–28
Rest heart rate (beats/min) 67 ± 7 56–78 62 ± 6 50–74
Journal of Occupational Medicine and Toxicology 2006, 1:20 />Page 3 of 9
(page number not for citation purposes)
as soon as possible; Category 4 = The posture is extremely
harmful, actions to correct postures should be taken
immediately.
The rating of perceived exertion (RPE) of individuals
depending on their age, physical conditions, subjective
view of increased heart rate and muscle fatigue was also
assessed using Borg rating scale, ranging from 6 to 20
[7,8]. Data were gathered via questionnaires and inter-
views.
Assessment of the functional state of skeletal muscle was
carried out using myometric measurements with the
MYOTON-3 device created in Estonia, University of Tartu
[9]. The complete theoretical concepts of myotonometry
(MYO) are described in references [10-12].
The principles of the MYO lies in using of acceleration
probe to record the reaction of the peripheral skeletal
muscle or its part to the mechanical impact and the fol-
lowing analysis of the resulting signal with the aid of the
personal computer. Myoton exerts a local impact on the
biological tissue by means of a brief impulse which is
shortly followed by a quick release. The force of the
impact is chosen such that it does not create changes in
the biological tissue or precipitate the neurological reac-
tions.
The criteria have been worked out enabling to contribute
in the diagnostics of the functional condition of the skel-
etal muscles and correlate it with certain criteria of the
classical diagnostics. Simultaneous measurements of
intramuscular pressure (IMP), surface electromyography
(SEMG) and MYO were investigated [12]. Time- and load-
matched data revealed significant correlations between
registered IMP, EMG and MYO parameters. The IMP and
EMG amplitudes, as well as the MYO parameters (muscles
frequency and stiffness) were linearly related to relative
muscle load and a repeated measures using ANOVA anal-
ysis followed by determination of the intraclass correla-
tion coefficient (ICC) determine reliability of MYO
measuring. It was concluded that myotonometer is a reli-
able device for measuring skeletal muscle viscoelastic
parameters; therefore, such electro-mechanical characteri-
zation of the skeletal muscle may provide new insights
into muscle function and can help to diagnose the stage of
pathological processes of muscles.
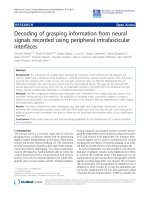
The testing end (mass 20 grams) of the computerized
myotonometry (CMYO) device (Fig. 1) was in contact
with muscle belly area (see Fig. 2), and the effective weight
was employed on the surface of the measuring tissue. As a
result, the tissues were in a compressed state. The CMYO
device was fired in response to a fixed posture at the test-
ing sensor end.
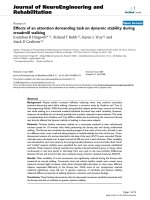
The driver produced a short impulse (a few milliseconds,
t
k
in Fig. 3), which was forwarded to the contact area. For
our study, the duration of the impact on the muscle belly
of studied muscles was 15 milliseconds. The force impulse
terminated with a quick release at a moment t
2
(Fig. 2).
The tissue responded to the mechanical impact with
damped oscillations. The oscillations were recorded by
the acceleration transducer at the testing end of device.
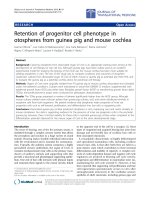
Schematic drawing of myotonometerFigure 1
Schematic drawing of myotonometer.
pivotable two-
armed lever
testing end
acceleration
probe
control
switch
indicator
ball bearing
light emitting
diode (LED) –
photodiode pair
shutter
clamp
muscle
grip
Table 2: Work heaviness classification in terms of energy expenditure
Workload categories Energy expenditure
NIOSH (USA) standard [4], ISO 28996 Russian standards of hygiene [5] Male, kcal/min Female, kcal/min
Light work I Light work I 2.0 – 4.9 1.5 – 3.4
Moderate work II Permissible work II 5.0 – 7.4 3.5 – 5.4
Hard work III Moderate work II.1 7.5 – 9.9 5.5 – 7.4
Very hard work IV Hard work II.2 10.0 – 12.4 7.5 – 9.4
Ultimate work V Excessively hard work III more 12.5 more 9.5
Journal of Occupational Medicine and Toxicology 2006, 1:20 />Page 4 of 9
(page number not for citation purposes)
The acceleration value of the first period of oscillations,
calculated from the oscillation graph, characterizes the
deformation of the tissue. The data of the next oscillation
period provided the basis for calculating the oscillation
frequency:
where ν is the oscillation frequency of the tissue, T – the
oscillation period in seconds.
The logarithmic decrement of damping was calculated
according to the following formulae:
where
Θ
is the oscillation logarithmic decrement of the
tissue; a
3
and a
5
– the oscillation amplitudes.
The frequency of the damped oscillations measured dur-
ing the rest period characterizes the tissue tone. The loga-
rithmic decrement of the damped oscillations
characterizes tissue elasticity. The decrement is inversely
proportional to elasticity. Stiffness C reflects the resistance
of tissue to the force that changes its shape and it was cal-
culated by formula:
where m is the mass of the testing end of myometer; a
max
is the maximal amplitude of oscillation, and
∆
l is the
depth of the displacement of the testing end.
Measurements for determination of muscle tone during
one week work cycle were done with relaxed muscles
before the work cycle had been started. In this way, one
can obtain the most precise results when estimating mus-
cle fatigue or the ability to restore elastic muscle qualities
after the work cycle. Some data were also acquired show-
ing the parameters of some muscle groups in the con-
tracted state and reflecting their state during work.
ν
=
()
1
1
T
[]Hz
Θ=
()
ln
a
a
3
5
2
C
ma
l
=
⋅
()
max
[/]
∆
Nm
3
Waveforms of acceleration (a), velocity (v), and displacement (s), acquired in the process of damped natural oscillation per-formed by the myometer testing endFigure 3
Waveforms of acceleration (a), velocity (v), and displacement
(s), acquired in the process of damped natural oscillation per-
formed by the myometer testing end.
Myotonometrical testing of m. gastrocnemius caput medialeFigure 2
Myotonometrical testing of m. gastrocnemius caput mediale.
Journal of Occupational Medicine and Toxicology 2006, 1:20 />Page 5 of 9
(page number not for citation purposes)
Myotonometry testing of the following muscles was per-
formed in relaxed state: m. extensor digitorum; m. flexor
carpi radialis; m. gastrocnemius (caput mediale); m. tibilais
anterior and m. trapezius (upper part). The procedure of
muscle testing was performed in sitting position, on the
table; the muscle length was middle; for all measurements
the subject takes the same position.
Statistical analysis
The results acquired were entered into the computer and
processed using EXCEL software and statistical data
processing program SPSS.11 according to popular
descriptive statistical methods (Pearson's correlation coef-
ficient r, a.o.). Reliability interval (interrater agreement)
was also calculated determining Cohen's Kappa coeffi-
cient (k) [13]. This coefficient identifies connectivity of
the experimental data, the number of participants and the
proportion or correlation of the participants' acceptance
of the experimental data:
k = (P
O
- P
C
)/(1 - P
C
), (4)
where: P
O
– correspondence proportion of objective
experimental data with respondents' responses (yes or
no), P
C
– correspondence proportion of data with number
of participants (P
C
= Σp
i
2
, where p
i
is acceptance of each
participant expressed in percent or as fractional number).
Results
For HRM of road repair workers a 33 minutes long work
period with following tasks was chosen: Task 1 – sand
layer construction cycle 8 min and rest break 2 min; Task
2 – chipping layer construction cycle 10 min and rest
break 5 min; Task 3 – asphalt layer construction cycle 8
min. Each task included different working phases (plac-
ing, profiling and leveling of the layer) which where inves-
tigated using OWAS analysis. The above mentioned tasks
characterize a regularly repeated sidewalk repairing cycle.
For pavers a 30 minutes long working cycle was chosen
without a brake. Paving was divided into two phases. In
the research following phases were analyzed: placing of
sand layer – 5 min, paving 25 min. Research results of
HRM, OWAS and RPE for selected teams are summed up
in Tables 3 and 4.
Computerized QWAS analysis showed that the most
severe work phase for the road repair workers is carrying
of the layer (sand, chip, asphalt) and is accordingly refer-
able to Action Category (AC) 4. Profiling, in its turn, can
be considered to be AC 2, while the levelling corresponds
to AC 1. Acquired results for pavers show, that the phase
1 – spreading of sand before paving stones are put in place
– can be characterized as AC 2, but the paving phase – as
AC 3. The motivation will be described more particularly
in the discussion part.
The above mentioned ergonomic analysis confirmed by
the subjective statements of workers (using question-
naires and interviews). Inquiry data showed that the road
maintenance workers most frequently complain on feel-
ing discomfort after the work, specifically, fatigue or mus-
cle pain in several parts of the body. After summing up the
responses concerning pain or discomfort areas at the end
of the workday, it was found out that the most workers
complain on pain in their arms, legs, upper and lower part
of the back, shoulder line. Although the work heaviness
degree of road maintenance workers was identified, this
study doesn't show the objective muscles fatigue. There-
fore, a further research work was carried out using MYO
measurements.
Table 4: Percent of workers whose muscle frequency exceeds
the norm (> 16 Hz) after the work week cycle, Pearson's
correlation (r), and Cohen's Kappa (k)
Muscle groups Road workers (n = 10) Pavers (n = 10)
% rk% rk
m. extensor digitorum 60 0.78 0.34 28 0.68 0.59
m. flexor carpi radialis 60 0.78 0.21 30 0.70 0.35
m. gastrocnemius 25 0.82 0.50 80 0.80 0.54
m. tibialis anterior 50 0.85 0.35 90 0.75 0.50
m. trapezius 25 0.88 0.20 85 0.78 0.33
Table 3: Workers' heart rate (HR), Pearson's correlation (r), Cohen's Kappa (k), percentage of the heart rate range (%HRR), energy
expenditure (E), the rate of perceived exertion (RPE, scale 6–20), and work heaviness category (WHC). Road workers (n = 10), pavers
(n = 10).
Occupation Heart rate monitoring Mean %HRR
± SD
Mean E ± SD,
kcal/min
Mean RPE ±
SD (range)
WHC
Mean HR ± SD,
beats/min
Range HR,
beats/min
rk
Road workers 125 ± 14 108–160 0.95 0.68 52 ± 8 8,1 ± 1.5 15 ± 2 (13–17) Hard work
Pavers 116 ± 13 82–150 0.92 0.59 42 ± 6 7.2 ± 1.1 12 ± 2 (11–13) Moderate work
Journal of Occupational Medicine and Toxicology 2006, 1:20 />Page 6 of 9
(page number not for citation purposes)
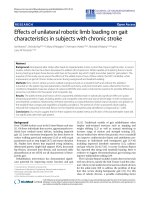
According to regression analysis of MYO data, the slope of
the lines (trendline) reflects the condition of the muscles
after one week work cycle for all workers and can be sub-
divided into several categories (Fig. 4):
Category I – subject is able to relax the muscle;
Category II – muscle is able to adapt to the work load and
to relax partly;
Category III – muscle is not able to relax.
Comparative data showing the load of separate muscle
groups while performing different kinds of work are
reflected in Fig. 5. The results show the average values of
muscle frequency in the beginning and at the end of the
work week, i.e. changes in the muscle tone and load for
workers who are not to be able to adapt to the workload.
Tables 4 and 5 show the comparison of the different mus-
cle groups which frequency and stiffness go beyond the
norm after the work week cycle and percent of the workers
having these changes. The percent of workers with differ-
ences in their muscle tone depending on the length of
occupational service is shown in Table 6:
Discussion
As we see from HRM data, the work heaviness degree for
road repair workers and pavers is different, accordingly –
hard work and moderate work. Interesting data were
acquired observing decrease in the heart rate under condi-
tions of different workload. By the length of a period
when HR regained its normal state (as in rest periods) it is
possible to assess approximately whether the worker has
grown tired or has not. It was stated that HR of workers
stabilizes (90–100 bets/min) when performing sand layer
leveling with a rather low work intensity (2.5–3.1 kcal/
min) and the HRM diagram shows "plateaus" area. Heart
rate regains its normal state rather quickly – this process
requires 5–8 min. Consequently – during this work phase
the workers don't get tired. Whereas performing the work
with a high intensity, hart rate increases constantly until it
reaches 160 beats/min, sometimes – 170 or more beats/
min, at the end of working cycle indicating that the worker
is getting tired step by step. Also the period required for
Table 5: Percent of workers whose muscle stiffness exceeds the
norm (> 300 N/m) after the work week cycle, Pearson's
correlation (r), and Cohen's Kappa (k)
Muscle groups Road workers (n = 10) Pavers (n = 10)
% rk% rk
m. extensor digitorum 85 0.68 0.30 30 0.68 0.25
m. flexor carpi radialis 85 0.69 0.19 35 0.70 0.30
m. gastrocnemius 12 0.76 0.54 60 0.80 0.51
m. tibialis anterior 60 0.67 0.43 100 0.89 0.49
m. trapezius 25 0.55 0.25 90 0.78 0.28
Results of the regression analysis of m. extensor digitorum frequency and stiffness during consecutive 6 work days in road work-ersFigure 4
Results of the regression analysis of m. extensor digitorum frequency and stiffness during consecutive 6 work days in road work-
ers.
R
2
= 0,0171
R
2
= 0,0253
10
14
18
22
1234567
Days
Cat.2
Frequency, Hz
left hand
right hand
R
2
= 0,5528
R
2
= 0,6171
10
14
18
22
26
1234567
Days
Cat.3
Frequency, Hz
left hand
right hand
R
2
= 0,7665
10
14
18
22
1234567
Days
Frequency, Hz
Cat.1
R
2
= 0,7933
left hand
right hand
200
250
300
350
400
450
500
Stiffness, N/m
R
2
= 0,3725
R
2
= 0,6852
Cat.1
Days
1234567
left hand
right hand
Stiffness, N/m
Days
1234567
Cat.2
left hand
right hand
R
2
= 0,4356
R
2
= 0,2554
200
250
300
350
400
450
500
Stiffness, N/m
Days
1234567
Cat.3
left hand
right hand
R
2
= 0,8456
R
2
= 0,3689
200
250
300
350
400
450
500
Journal of Occupational Medicine and Toxicology 2006, 1:20 />Page 7 of 9
(page number not for citation purposes)
the heart rate to relax is longer – normal state is regained
only in 30 minutes time.
In accordance with OWAS analysis also different Action
Categories were identified. The heaviest work phase, as we
have stated, is carrying of the layer (AC = 4). During this
phase workers lift and move heavy loads – spades filled
with sand, chippings or asphalt up to 10–12 kg (recom-
mended weight limit calculated using NIOSH equations
was 8 kg). Distance the heavy load has to be moved is
from 2 to 20 meters or even more (depending on the pos-
sibility for the truck to drive closer to the place the layer
should be constructed). Therefore, the posture is consid-
ered to be extremely harmful; actions to correct postures
should be taken immediately. Also the posture for pavers
(AC = 3) is considered to be distinctly harmful. Also in
this case the actual frequently lifted mass (10 ± 2 kg)
exceeds the weight limit up to 3 – 4 kg recommended by
NIOSH. After having assessed individual work phases, it
was found out that the most serious risks to the skeletal
and muscular system of the workers are possible when
heavy loads are lifted with stretched arms too high from
Table 6: Percent of workers with differences in their muscle tone (categories I III) after one week work cycle depending on the length
of occupational service in the given road building company
Occupation Length of service in the occupation, years
1 – 5 5 – 10 > 10
Category rkCategory rkCategory rk
Road workers (n = 70) I – 10% 0.68 0.48 I – 12% 0.68 0.45 I – 8% 0.68 12.0
II – 13% 0.68 0.41 II – 17% 0.68 0.35 II – 12% 0.68 62.8
III – 77% 0.68 0.53 III – 70% 0.68 0.25 III – 80% 0.68 89.3
Pavers (n = 25) I – 14% 0.68 0.34 I – 10% 0.680.25I – 11% 0.6810.0
II – 40% 0.68 0.33 II – 30% 0.68 0.52 II – 40% 0.68 18.1
III – 46% 0.68 0.49 III – 60% 0.68 0.55 III – 49% 0.68 78.4
Illustration of frequency changing in separate muscle groups while performing the different kind of work at the beginning and at the end of the work week – for workers who are not to be able to adapt with the workload and whose muscle frequency exceeds the norm (11 up to 16 Hz, exist for each muscle individually) after the work week cycleFigure 5
Illustration of frequency changing in separate muscle groups while performing the different kind of work at the beginning and at
the end of the work week – for workers who are not to be able to adapt with the workload and whose muscle frequency
exceeds the norm (11 up to 16 Hz, exist for each muscle individually) after the work week cycle.
Muscle group
0
5
10
15
20
25
30
Extensor
digitorum
Flexor carpi
radialis
Gastro-
cnemius
Tibialis
anterior Trapezius
Frequency, Hz
Road
workers
Pavers
Beg.
End.
Beg.
End.
Beg.
End.
Beg.
End.
Beg.
End.
Norm
Journal of Occupational Medicine and Toxicology 2006, 1:20 />Page 8 of 9
(page number not for citation purposes)
the ground. For this reason, when thinking of work organ-
ization attention has to be paid to the factors making the
performance of the work more difficult (e.g. high scaf-
folds, great distances to move heavy loads and the like). In
this study training and muscle mass of the workers aren't
considered, as well as the load and fatigue of individual
muscles; these parameters are analyzed separately – by
MYO investigations.
Analysis of the MYO data shows that for the road repair
team the greatest load was put on arm muscles m. extensor
digitorum and m. flexor carpi radialis. Road repair works
usually involve fast movements of arms using spades,
load on the shoulder line and relatively insignificant stiff-
ness of calf-muscles. For example, very often two workers
perform the construction of road edge (roadside)
together; the construction of road edge requires lifting of
a concrete edge which weights up to 100 kg. In this case,
the normal frequency of muscles was exceeded for 60 per
cent of workers, and the stiffness for – 85 per cent.
Work of the pavers is predominantly monotonous and
most often is performed on knees or in a posture requiring
bending, thus especially contracting muscles of both legs
and shoulders. It was justified by MYO data – the greatest
load for pavers was put on their leg muscles, especially m.
tibialis anterior and m. trapezius of shoulders (see Fig. 5).
Both the frequency and stiffness were beyond the normal
condition for 90 per cent of workers. The increase of the
leg muscle tone can be explained by an increased static
load on the legs. However, for arm muscles with an
increased stiffness, the frequency goes beyond the norm
(determinable for each muscle individually) only for 28
per cent of workers (m. flexor carpi radialis). Tension which
depends on stiffness parameters of m. extensor digitorum
and m. flexor carpi radialis for the pavers is smaller than for
the road repair team workers. This results from the fact
that the weight the pavers work with is smaller. Usually
they lift a paving stone with the average weight of 5 to 6
kg (in some cases it could be 10 kg) with both hands, put
it on the sand layer and using a hand mattock-hammer,
whose weight is less than 0.5 kg, fix the stone in its proper
place. The most common movements are done by one
arm (usually the right arm) while smoothing sand and
hitting the paving stone are done with the mattock-ham-
mer.
MYO data also show that muscles, which are located in
different sides of the body, are adapted to work load dif-
ferently. It was stated both for road workers and for
pavers. Differences in the load of both arm and leg mus-
cles are significantly different. There are some workers
working with both arms equally, for some others the left
arm is involved more than the right. However it doesn't
mean that these workers are left-handed; the only reason
for this is the specificity of the performed activity, namely,
the weight of a material, which has to be carried on the
spade held by the left arm.
The proportion of workers with differences in their muscle
tone depending on the length of service in the specific
occupation was various. As we see, the number of road
workers with an increased muscle tone (Category III)
increases when the length of service is more than 10 years
und reaches in this case 80 per cent. The greatest number
of pavers (60 per cent) falling within Category III is after
5 to 10 years of service.
MYO data showed that office employee's leg muscles are
loaded, too. It was an unexpected finding even for the
office employees themselves. However, many of them
used while working foot stands thus tensing m. tibialis
anterior (with toes uplifted) or worked in other postures
with tensed leg muscles. These employees have greater dif-
ferences for their legs. As it was observed office employees
sometimes don't put the whole foot on the floor, but sup-
port one or both legs only on their toes or keep their feet
on the horizontal bars of their chairs thus straining also m.
gastrocnemius. Tone of these muscles, when they are con-
tracted for a longer period, increases, thus making disor-
ders of blood circulation and herewith also muscular
skeletal system (MSS) diseases possible.
Determination of muscle stiffness and frequency is of
great importance, for fatigue can be subdivided into high-
frequency fatigue (HFF) and low-frequency fatigue (LFF),
what differs from mechanic (also electric) features of mus-
cles. HFF fatigue is characterized by an excessive loss of
force at high frequencies of stimulation and rapid recov-
ery when the frequency is reduced. Frequencies in excess
of 50 Hz are rarely observed by voluntary activation of
human muscle, and for this reason there has been some
doubt as to whether high-frequency fatigue is a significant
feature of normal activity. Recent experiments have
shown that with 30 Hz stimulation there is a more rapid
loss of force if the muscle is held isometric in a shortened
position and the fatigue is rapidly reversed if the muscle is
re-extended, even under ischemic conditions [14]. These
findings are consistent with the accumulation of K
+
in the
t-tubules and interfibre spaces of the muscle. LFF is char-
acterized by a relative loss of force at low frequencies of
stimulation and a slow recovery over the course of hours
or even days and there is evidence provided by intracellu-
lar measurements that low-frequency fatigue is a result of
reduction in Ca
2+
release.
It must be noted that by summing up the results on mus-
cle tone and fatigue acquired during the research work,
our main interest was concentrated on the factors that
allowed some muscle groups to relax and restore capacity
Journal of Occupational Medicine and Toxicology 2006, 1:20 />Page 9 of 9
(page number not for citation purposes)
to work. Data acquired during research (see subdivision of
workers into 3 categories according to MYO data) are
indicative of several features of HFF and LFF.
Features of HFF:
- Force of muscles is restored quickly after the irritation
frequency has decreased, especially what concerns work-
ers falling within category I. This concerns partly also
those whose muscle tone remains unchanged during their
work (in this case – during one week work cycle) – cate-
gory II.
Features of LFF:
- Greater decrease of contraction force as in the case of
HFF;
- Force restores slowly, during several hours, but in some
cases total restoration occurs only in several days.
It has been observed that for several persons working in
the road repair team, physiological LFF of muscles (this
type of fatigue is called also – lasting fatigue) is accompa-
nied by pain. If the work load requires too much muscle
loading and stretching, when eccentric contractions are
created, active muscle fibres resist the stretching and the
cause of pain is the ultra-structural damage of the muscle.
For some workers muscle tone remained the same the
whole week through, which means that they were able to
adapt to the existing work load. It has to be noted that for
the most of the workers MYO parameters after rest on Sat-
urday and Sunday had decreased again. However, for
some workers parameters remained relatively high,
because in their days off, they did some other kind of hard
physical work.
Consequently the road construction sphere requires spe-
cial rest exercises to be developed and this is the task of
ergonomists and occupational doctors.
Conclusion
According to the heart rate monitoring data the road con-
struction and maintenance workers – road repair workers
and pavers – can be subdivided into hard and moderately
hard work categories and despite rapid technical improve-
ments, their work still requires hard manual labor, com-
pulsive working postures and constantly repeated arm
movements. We conclude that road construction and
maintenance workers can be subdivided into three catego-
ries basing on the dynamics of muscle tone during one
work week, and complex analysis – consisting of heart rate
monitoring, compulsive working postures assessment and
myotonometry is appropriate to assess the degree of work
heaviness – may provide prognosis of occupational
pathology or work-related musculoskeletal disorders for
the workers under different workload conditions and can
be also used when choosing necessary rest time and its
periodicity.
Acknowledgements
The authors wish to thank the volunteers and the Road Administration of
Riga who made this work possible.
References
1. Jackson AS, Blair SN, Mahar MT, Wier LT, Ross RM, Stuteville JE:
Prediction of functional aerobic capacity without exercise
testing. Medicine and Science in Sports and exercise 1990,
22(6):863-870.
2. Karvonen M, Kentala E, Mustala O: The effects of training on
heart rate: A longitudinal study. Annales Medicinae Experimentalis
et Biologiae Fenniac 1957, 35:307-315.
3. Inbar O, Oten A, Scheinowitz M, Rotstein A, Dlin R, Casaburi R: Nor-
mal cardiopulmonary responses during incremental exer-
cise in 20-70-yr-old men. Med Sci Sport Exerc 1994,
26(5):538-546.
4. Mantoe HI, Kemper WM, Saris M, Wasshburn RA: Measuring Phys-
ical Activity and Energy Expenditure. Human Kinetics Publish-
ers, Champaign, Illinois, USA; 1996.
5. Devisilov VA: Ohrana truda. Forum-Infra, Moscow 2003. (in Russian)
6. Louhevaara V, Suurnäkki T: OWAS: Training Publication II. Fin-
ish Institute for Occupational Health, Helsinki; 1992.
7. Borg G: Perceived exertion as an indicator of somatic stress.
Scandinavian Journal of Rehabilitation Medicine 1970, 2:92-98.
8. Borg G: Borg's Perceived Exertion and Pain Scales. Human
Kinetics Publishers, Champaign, Illinois, USA; 1998.
9. Vain A: Estimation of the Functional State of Skeletal Muscle.
In Control of Ambulation using Functional Neuromuscular Stimulation
Edited by: Veltink PH, Boom HBK. Enschede, University of Twente
Press; 1995:51-55.
10. Vain A, Kums T: Criteria for Preventing Overtraining of the
Musculoskeletal System of Gymnasts. Biology of Sport 2002,
19(4):329-345.
11. Korhonen RK, Vain A, Vanninen E, Viir R, Jurvelin JS: Interrelation-
ship of the Intersitial Pressure, Electrical and Mechanical
Caracteristics of the Sceletal Muscle. Medical & Biological Engi-
neering & Computing 1999, 37:200-201.
12. Korhonen RK, Vain A, Vanninen E, Viir R, Jurvelin JS: Can mechan-
ical myotonometry or electromyography be used for the
prediction of intramuscular pressure? Physiological Measurement
2005, 26:951-963.
13. Landis JR, Koch GG: The Measurement of Observer Agree-
ment for Categorical Data. Biometrics 1977, 33:159-174.
14. Jones DA: High-and low-frequency fatigue revisited. Acta Phys-
iol Scand 1996, 156(3):265-270.
15. Ainsworth BE, Haskell WL, Leon AS, Jacobs DR Jr, Montoye HJ, Sallis
l: Compendium of physical activities: classification of energy
costs of human physical activities. Medicine and Science in Sports
and Exercise 1993, 25(1):71-80.