báo cáo hóa học: " The effects of a graduated aerobic exercise programme on cardiovascular disease risk factors in the NHS workplace: a randomised controlled trial" pdf
Bạn đang xem bản rút gọn của tài liệu. Xem và tải ngay bản đầy đủ của tài liệu tại đây (266.75 KB, 10 trang )
BioMed Central
Page 1 of 10
(page number not for citation purposes)
Journal of Occupational Medicine
and Toxicology
Open Access
Research
The effects of a graduated aerobic exercise programme on
cardiovascular disease risk factors in the NHS workplace: a
randomised controlled trial
Jennifer A Hewitt*
1,2
, Gregory P Whyte
4
, Michelle Moreton
2
, Ken A van
Someren
1,5
and Tanya S Levine
3
Address:
1
Kingston University, Kingston Upon Thames, UK,
2
St George's, University Of London, Tooting, UK,
3
North West London Hospitals NHS
Trust, Harrow, UK,
4
Liverpool John Moores University, Liverpool, UK and
5
English Institute Of Sport, Twickenham, UK
Email: Jennifer A Hewitt* - ; Gregory P Whyte - ;
Michelle Moreton - ; Ken A van Someren - ; Tanya S Levine -
* Corresponding author
Abstract
Background: Sufficient levels of physical activity provide cardio-protective benefit. However
within developed society sedentary work and inflexible working hours promotes physical inactivity.
Consequently to ensure a healthy workforce there is a requirement for exercise strategies
adaptable to occupational time constraint. This study examined the effect of a 12 week aerobic
exercise training intervention programme implemented during working hours on the
cardiovascular profile of a sedentary hospital workforce.
Methods: Twenty healthy, sedentary full-time staff members of the North West London Hospital
Trust cytology unit were randomly assigned to an exercise (n = 12; mean ± SD age 41 ± 8 years,
body mass 69 ± 12 kg) or control (n = 8; mean ± SD age 42 ± 8 years, body mass 69 ± 12 kg) group.
The exercise group was prescribed a progressive aerobic exercise-training programme to be
performed 4 times a week for 8 weeks (initial intensity 65% peak oxygen consumption (VO
2 peak
))
and to be conducted without further advice for another 4 weeks. The control was instructed to
maintain their current physical activity level. Oxygen economy at 2 minutes (2minVO
2
), 4 minutes
(4minVO
2
), VO
2 peak
, systolic blood pressure (SBP), diastolic blood pressure (DBP), BMI, C-reactive
protein (CRP), fasting glucose (GLU) and total cholesterol (TC) were determined in both groups
pre-intervention and at 4 week intervals. Both groups completed a weekly Leisure Time
Questionnaire to quantify additional exercise load.
Results: The exercise group demonstrated an increase from baseline for VO
2 peak
at week 4 (5.8
± 6.3 %) and 8 (5.0 ± 8.7 %) (P < 0.05). 2minVO
2
was reduced from baseline at week 4 (-10.2 ±
10.3 %), 8 (-16.8 ± 10.6 %) and 12 (-15.1 ± 8.7 %), and 4minVO
2
at week 8 (-10.7 ± 7.9 %) and 12
(-6.8 ± 9.2) (P < 0.05). There was also a reduction from baseline in CRP at week 4 (-0.4 ± 0.6 mg·L
-
1
) and 8 (-0.9 ± 0.8 mg·L
-1
) (P < 0.05). The control group showed no such improvements.
Conclusion: This is the first objectively monitored RCT to show that moderate exercise can be
successfully incorporated into working hours, to significantly improve physical capacity and
cardiovascular health.
Published: 28 February 2008
Journal of Occupational Medicine and Toxicology 2008, 3:7 doi:10.1186/1745-6673-3-7
Received: 17 July 2007
Accepted: 28 February 2008
This article is available from: />© 2008 Hewitt et al; licensee BioMed Central Ltd.
This is an Open Access article distributed under the terms of the Creative Commons Attribution License ( />),
which permits unrestricted use, distribution, and reproduction in any medium, provided the original work is properly cited.
Journal of Occupational Medicine and Toxicology 2008, 3:7 />Page 2 of 10
(page number not for citation purposes)
Background
It is widely accepted that cardiovascular disease (CVD) is
the leading cause of death in developed countries [1].
Over the past decade it has become recognised that phys-
ical activity is an independent factor in the determination
of over all CVD risk through the prevention of atheroscle-
rosis and reduction of thrombotic risk [2,3]. Evidence
supports an inverse association between physical fitness
and various CVD risk factors, including glucose tolerance
[4], cholesterol [5], blood pressure [6], resting pulse rate
[7] and obesity [8], and markers of systemic inflammation
including C-reactive protein (CRP) [9], and TNFα [10]. It
is suggested that such effects occur through a reduction in
lipoprotein oxidation [11], improved endothelial func-
tion via the increased production of nitric oxide and pros-
tacyclin [12], decreased atherogenic activity of blood
mononuclear cells effecting the production of cytokines
[13], and a reduced accumulation of collagen in the arte-
rial wall [14]. Therefore guidelines recommend that indi-
viduals accrue 30 minutes of moderate physical activity
on at least 5 days of the week [15,16].
Despite the positive impact of physical fitness on CVD,
developed societies have become more sedentary in both
occupation and leisure time. A recent observational study
of 2595 civil servants in Northern Ireland reported that
almost two thirds failed to engage in regular, moderate
physical activity, with females twice as likely to abstain
from exercise than men [17]. In England it has been
reported that a total of 24.2% of men and 19.8% of
women meet the activity recommendations; a total that
dropped to 17.6% and 13.0% when domestic activity was
excluded [18]. Since most adults will spend more than
half their waking hours within the workplace, worksite
health promotion programs that influence employee
behaviour by promoting physical activity could prove
fundamental in addressing the growing problem of seden-
tary habit and cardiovascular risk.
A number of randomised-controlled trials assessing the
benefit of workplace exercise interventions on health-
related outcome measures (body composition, blood
pressure, lipid profile, inflammatory markers) have been
reported [19-21]. However, the conclusions from these
trials have been based upon the subjective self-report of
physical activity, without individualised prescription or
monitoring of the exercise programme, and objective
assessment. Therefore the relationship between improved
physical capacity and health from workplace exercise
remains inconclusive [21]. In view of this there is a neces-
sity for further studies of strong methodological quality to
examine corporate exercise strategies adaptable to occupa-
tional time constraints.
The aim of this pilot study was to investigate the efficacy
of a structured, monitored 12-week aerobic exercise train-
ing intervention programme on modifying the cardiovas-
cular risk profile of a sedentary National Health Service
(NHS) workforce, and to evaluate whether it could be
implemented during working hours.
Methods
Setting
The trial was conducted at the Olympic Medical Institute
(OMI), Northwick Park and North West London Hospi-
tals (NWLH) NHS Trust (Northwick Park site). The North
West London Research Ethics Committee, NWLH NHS
Trust approved the trial (REC 05/Q0405/122). All partic-
ipants provided written informed consent before entering
the study.
Study participants
Participants were full-time male and female personnel
from the NWLH Trust cytology laboratory. Who as spe-
cialist medical and non-medical cytology staff, spend
multiple hours per day seated for the microscopic assess-
ment of cervical cytology slides. All subjects were defined
"sedentary" from self-reported physical activity levels of
less than 2 hours organised physical activity per week. Eli-
gible participants were not admitted if they had known
cardiac disease, uncontrolled hypertension, thyroid dis-
ease, diabetes, mental illness, infection, immune or endo-
crine abnormality or contraindications to exercise on the
basis of an exercise stress test. All participants were
required to complete a medical screening questionnaire
(PAR-Q) before entering the study.
20 participants were recruited and randomly assigned to
an exercise (n = 12) or control (n = 8) group using a ran-
dom numbers table. Group assignment was revealed fol-
lowing baseline testing.
Experimental design
Physiological tests included blood pressure, body composi-
tion, peak oxygen uptake and blood screening, and were
performed at pre-intervention and at 4 weekly intervals for
a total of 12 weeks. After baseline assessment and at each 4
week reassessment, control subjects were instructed to
maintain their current physical activity level, while the exer-
cise group were provided with an individualised progres-
sive exercise prescription of brisk walking or light jogging to
be performed 4 times a week for the following 4 weeks (Fig-
ure 1.). At 8 weeks no further progression of the exercise
training programme was provided, and participants were
instructed to maintain the exercise as of week 8 for the final
4 weeks. This was to evaluate if there was any further phys-
iological benefit, or if exercise adherence was affected in the
absence of any additional training stimulus. Participants
conducted all exercise sessions during their lunch, morning
Journal of Occupational Medicine and Toxicology 2008, 3:7 />Page 3 of 10
(page number not for citation purposes)
or afternoon breaks, to avoid disturbance to the normal
laboratory working routine. Heart rate monitors (F4, Polar
electro-oy, Kempele, Finland) were provided to monitor
accurately the intensity of the exercise prescribed, and the
average heart rate and exercise duration of each session was
recorded in an exercise diary. The exercise intensity was ini-
tially set to correspond with 65 % of peak oxygen consump-
tion (VO
2 peak
). Participants were instructed on an
appropriate warm-up and cool-down procedure, and pro-
vided with a supervised exercise session during the initial
week of each 4 week period. Progress was checked through
personal contact on a weekly basis. At each exercise testing
session all participants were provided with an evaluation of
their results.
Both groups were provided with the Godin Leisure Time
Questionnaire [22] to record in arbitrary units any addi-
tional physical activity or exercise that was above the pre-
scribed programme. On entering the study participants
were asked to complete a typical retrospective week of the
same questionnaire. This was to ensure that all individu-
als from both groups participated in similar amounts of
physical activity or exercise at baseline. The control group
was offered the intervention at the end of the trial.
Outcomes
The primary outcomes were changes in peak oxygen con-
sumption (VO
2 peak
), submaximal oxygen consumption at
2 minutes (2minVO
2
) and 4 minutes (4minVO
2
), and bio-
logical markers of inflammation (C-reactive protein, IL-6
and TNFα) between baseline and post intervention. Sec-
ondary outcomes were changes in time to exhaustion, rest-
ing heart rate, systolic and diastolic blood pressure.
Secondary biological markers were fasting glucose and total
cholesterol. Secondary physical outcomes were changes in
body weight and body mass index (BMI). All outcome
measures were taken after a 24 hour period of no exercise.
Biological outcomes
Fasting blood samples were collected in the morning,
before any of the physiological tests. Whole blood samples
were analysed for total cholesterol and glucose using an
Abbott 8200 analyser (Abbott, Chicago, IL, USA). Choles-
terol and glucose levels were measured using the choles-
terol oxidase and hexokinase method respectively. Serum
samples were used for CRP, TNFα, and IL-6. These were
separated by low-speed centrifugation, and stored for later
analysis at -70°C. The assays were performed using a semi-
automated solid-phase, enzyme-labelled, chemilumines-
cent sequential immunometric assay (Euro/DPC, Gwyn-
edd, UK), and measured using an IMMULITE 1000
analyser (Immulite, Gwynedd, UK). The lowest detection
levels for IL-6, TNFα and CRP were 2 pg/mL, 1.7 pg/mL and
0.1 mg/L respectively. For the purpose of data analysis all
values below the detection limit were coded as 1.9 pg/mL,
1.6 pg/mL and 0.05 mg/L respectively.
Blood pressure
Subjects remained in the supine position for 10 minutes.
Blood pressure was measured manually, and recorded to
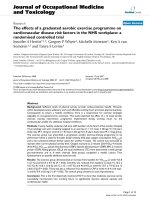
Schematic experimental time-line of the aerobic exercise training intervention programmeFigure 1
Schematic experimental time-line of the aerobic exercise training intervention programme.
1. Pre-test (baseline
evaluation)
Exercise prescription
week 1-4: I: 65 % VO
2
peak; F: 4 x week; D
progression: 22.5 min +
2.5 minwk
-1
Exercise prescription
week 4-8: I progression:
65 % VO
2
peak + 2.5
bpmwk
-1
; F: 4 x week; D:
30 min
2. 4 week
assessment
3. 8 week
assessment
4. 12 week
assessment
Exercise prescription
week 8-12: Individual
maintenance of
programme at week 8
I = intensit
y;
F = fre
q
uenc
y;
D = duration
Journal of Occupational Medicine and Toxicology 2008, 3:7 />Page 4 of 10
(page number not for citation purposes)
the nearest 2 mm Hg. Each measurement was repeated
three times then averaged.
Physical characteristics
Body composition was assessed indirectly through
changes in body weight and body mass index. Body
weight was assessed using an electronic scale (Seca, Vogel
Halke, Germany). Standing height was determined with-
out shoes. Body mass index was calculated as body mass
(Kg) divided by height squared (m
2
).
Cardiopulmonary outcomes
Cardiopulmonary outcomes were evaluated using a pro-
gressive walking test (modified Bruce protocol) to voli-
tional fatigue on a motorised treadmill. Speed (2.5, 3, 3.5
or 4 m·p
-1·
h
-1
) was predetermined by the participant's
previous exercise history, and remained constant for the
duration of the test, and for each subsequent test. The gra-
dient was set at 2 % and increased by 1 % each minute.
Heart rate data were recorded at 1-minute intervals. On
the initial test this was used with VO
2
data to determine
the heart rate training intensity (65 % VO
2 peak
) of the
exercise-training programme. This procedure was
repeated at 4 and 8 weeks to ensure correct continuation
of the heart rate training prescription. Participants were
provided with standardized encouragement throughout
the test.
Criteria for peak oxygen consumption included any two
of the following: a peak or plateau for more than 1 minute
in oxygen consumption; a respiratory exchange ratio ≥
1.15; volitional exhaustion; and rating of perceived exer-
tion greater than 19 (Borg, 1980). Exercise was terminated
if participants developed severe dyspnea, dizziness, or
chest pain, or had an abnormal heart rate response.
Expired gases were analysed every 5 seconds using an
automated online gas analyser (Oxycon, Jaeger, Hoech-
berg, Germany). The system was calibrated for volume
and gas concentrations before the start of each test. Peak
oxygen consumption and oxygen consumption at 2 and
4-minute intervals were determined by taking the mean of
twelve consecutive 5-second values at the end of each
respective stage. Participants were asked to follow the
same diet for the 24 hour period preceding each testing
session.
Statistical analysis
Baseline characteristics between groups were compared
using independent-samples t tests. Cardiopulmonary out-
comes were normalized to baseline, and expressed as per-
centage change. Due to skewed distribution CRP data was
log transformed. Repeated measures ANOVA were used to
determine differences in outcomes between groups. Post
hoc analysis was made within groups between each time-
point. Where significant interaction effects were found,
post hoc analysis was made at each time point between
groups. SPSS version 14.0 (SPSS Inc, Chicago, IL, USA)
was used for all statistical analyses. A P value < 0.05 was
considered to be statistically significant. The results are
reported as mean ± SD values.
Table 1: Baseline characteristics of exercise and control groups
Characteristic Exercise Group (n = 12) Control Group (n = 8) ≠ P value
Age (yrs) 41 ± 842 ± 80.460
Weight (kg) 68.5 ± 12.1 66.4 ± 13.2 0.659
BMI 25.9 ± 4.4 26 ± 4.1 0.777
Diastolic BP (mm Hg) 73 ± 10 69 ± 9 0.569
Systolic BP (mm Hg) 118 ± 12 106 ± 10 0.082
Resting heart rate (bpm) 66 ± 9 67 ± 11 0.821
Peak heart rate (bpm) 179 ± 14 182 ± 11 0.893
Time to exhaustion (min) 11.1 ± 3.5 10.7 ± 2.1 0.796
VO
2 peak
(L·min
-1
) 2.31 ± 0.65 2.00 ± 0.58 0.244
VO
2 peak
(mL·kg·min
-1
) 33.7 ± 8.8 35.5 ± 8.6 0.593
2 min oxygen consumption (L·min
-1
) 1.6 ± 0.49 1.3 ± 0.35 0.099
2 min oxygen consumption (mL·kg·min
-1
) 23.1 ± 5.2 20.4 ± 4.6 0.202
4 min oxygen consumption (L·min
-1
) 1.6 ± 0.36 1.4 ± 0.40 0.524
4 min oxygen consumption (mL·kg·min
-1
) 23.9 ± 4.5 23.0 ± 4.5 0.200
Past exercise (Godin arbitary units) 6.5 ± 4 7.5 ± 5.5 0.893
Total Cholesterol (mmol/L) 5.13 ± 1.0 4.97 ± 0.9 0.728
Glucose (mmol/L) 5.04 ± 0.50 5.11 ± 0.52 0.763
C-reactive protein (mg/L) 3.05 ± 4.37 3.16 ± 4.73 0.689
Interleukin-6 (pg/mL) 3.21 ± 0.91 3.26 ± 1.08 0.479
TNF-α (pg/L) 12.07 ± 3.27 9.84 ± 2.59 0.082
*Data are presented as mean (SD).
Journal of Occupational Medicine and Toxicology 2008, 3:7 />Page 5 of 10
(page number not for citation purposes)
Results
Baseline characteristics
Table 1 presents the baseline characteristics of the exercise
(n = 12) and the control (n = 8) groups. There were no sig-
nificant differences between groups for baseline character-
istics.
Adherence to the exercise training intervention
The exercise group completed 81 ± 14 % (13 ± 2), 84 ± 12
% (13 ± 2) and 70 ± 13 % (11 ± 2) of the 16 prescribed
exercise sessions between week 1 and week 4, week 4 and
week 8, and week 8 and week 12 respectively. Non-proto-
col related exercise was not significantly different between
groups at any time point during the study (week 4 P =
0.893; week 8 P = 0.952; week 12 P = 0.941).
Changes in cardiopulmonary function
Table 2 and 3 present the cardiopulmonary outcomes.
There was no significant time effect (F = 1.752; P = 0.167)
in VO
2 peak
(L·min
-1
), but there was a significant interaction
effect (F = 8.351; P = 0.000) and a treatment effect (F =
25.147; P = 0.000) between exercise and control groups.
Post hoc analysis revealed that there were significant differ-
ences between exercise and control groups at all time points
tested (P = 0.001; P = 0.001; P = 0.000). Furthermore, in the
exercise group VO
2 peak
(L·min
-1
) significantly increased
between week 0 and week 4 (P = 0.012), while in the con-
trol group it significantly decreased between week 0 and
week 4 (P = 0.026), week 0 and week 8 (P = 0.004) and
week 0 and 12 (P = 0.001) respectively. However, while
there were no significant differences in peak heart rate
(HRP) from baseline to any of the time points tested in the
exercise group, HRP in the control group was significantly
lower at all time points (P = 0.015; P = 0.032; P = 0.001).
There was no significant time effect in time to exhaustion
(TE) (F = 1.283; P = 0.334), but there were significant inter-
action and treatment effects between the exercise and the
control conditions (F = 4.239; P = 0.006; F = 12.289; P =
0.002). Post hoc analysis between groups revealed signifi-
cant differences at weeks 4 (P = 0.003), 8 (P = 0.002) and
12 (P = 0.036) respectively. Furthermore in the exercise
group TE significantly increased from week 0 – week 4 (P =
0.005), week 0 – week 8 (P = 0.002) and week 0 – week 12
(P = 0.025), but no significant changes occurred in the con-
trol group at any time point.
There was a significant time (F = 12.099; P = 0.000), and
treatment (F = 5.456; P = 0.031) effect in % change for
Table 2: Effects of the exercise-training programme on physiological outcomes from baseline – exercise group (n = 12); control group
(n = 8)
% Δ Week 1 – 4 % Δ Week 1 – 8 % Δ Week 1 – 12
Variable Exercise
(mean ± SD)
Control
(mean ± SD)
Difference
between
groups
Exercise
(mean ± SD)
Control
(mean ± SD)
Difference
between
groups
Exercise
(mean ± SD)
Control
(mean ± SD)
Difference
between
groups
Peak oxygen
consumption
(mL·min)
5.8 ± 6.3
P = 0.012
(122 ± 142)
-3.7 ± 4.4
P = 0.026
(-69 ± 80)
P≠ = 0.001 5.0 ± 8.7
P = 0.032
(137 ± 190)
-6.0 ± 5.8
P = 0.004
(-107 ± 93)
P≠ = 0.001 2.1 ± 8.5
P = 0.105
(103 ± 208)
-8.2 ± 5.4
P = 0.001
(-153 ± 105)
P≠ = 0.000
Peak oxygen
consumption
(mL·kg·min
-1
)
6.0 ± 7.2
P = 0.029
(1.6 ± 2.2)
-4.8 ± 3.3
P = 0.005
(-1.4 ± 0.9)
P≠ = 0.000 5.3 ± 10.0
P = 0.063
(1.8 ± 3.2)
-5.8 ± 5.2
P = 0.002
(-1.7 ± 1.5)
P≠ = 0.003 1.6 ± 9.9
P = 0.200
(1.3 ± 3.8)
-8.9 ± 5.0
P = 0.350
(-2.8 ± 1.9)
P≠ = 0.001
Time to exhaustion
(min)
12.5 ± 12.5
P = 0.005
(1.1 ± 1.7)
-6.9 ± 12.2
P = 0.157
(-0.6 ± 1.2)
P≠ = 0.003 16.7 ± 14.7
P = 0.002
(1.5 ± 1.6)
-7.9 ± 14.0
P = 0.158
(-0.9 ± 1.7)
P≠ = 0.002 16.5 ± 22.0
P = 0.025
(1.4 ± 3.0)
-3.6 ± 14.6
P = 0.506
(-0.48 ± 1.42)
P≠ = 0.036
Peak heart rate (bpm) 0.1 ± 2.5
P = 0.872
(0 ± 4)
-1.7 ± 1.5
P = 0.015
(3 ± 3)
P≠ = 0.072 -1.07 ± 3.79
P = 0.291
(-2 ± 7)
-2.43 ± 2.56
P = 0.032
(-5 ± 5)
P≠ = 0.405 0.01 ± 3.34
P = 0.931
(0 ± 6)
-2.74 ± 1.46
P = 0.001
(-5 ± 3)
P≠ = 0.045
2 min oxygen
consumption
(mL·min)
-10.2 ± 10.3
P = 0.006
(-140 ± 144)
-1.2 ± 8.1
P = 0.696
(-20 ± 96)
P≠ = 0.000 -16.8 ± 10.6
P = 0.000
(-250 ± 148)
-6.3 ± 11.6
P = 0.170
(-73 ± 136)
P≠ = 0.003 -15.1 ± 8.7
P = 0.000
(-231 ± 126)
-5.9 ± 11.9
P = 0.159 (
-66 ± 145)
P≠ = 0.001
2 min oxygen
consumption
(mL·kg·min
-1
)
-9.8 ± 9.2
P = 0.004
(-2.1 ± 1.9)
-2.3 ± 8.3
P = 0.453
(-0.5 ± 1.6)
P≠ = 0.000 -16.9 ± 9.2
P = 0.000
(-3.7 ± 1.7)
-6.2 ± 12.2
P = 0.191
(-1.3 ± 2.4)
P≠ = 0.003 -16.0 ± 5.6
P = 0.000
(-3.5 ± 1.6)
-6.6 ± 12.5
P = 0.178
(-1.4 ± 2.5)
P≠ = 0.001
4 min oxygen
consumption (L·min)
-5.4 ± 10.9
P = 0.068
(-85 ± 149)
1.9 ± 4.7
P = 0.289
(26 ± 68)
P≠ = 0.033 -10.7 ± 7.9
P = 0.002
(-162 ± 141)
-1.3 ± 3.9
P = 0.836
(-14 ± 51)
P≠ = 0.009 -6.8 ± 9.2
P = 0.021
(-116 ± 153)
-4.6 ± 9.2
P = 0.346
(57 ± 121)
P≠ = 0.412
4 min oxygen
consumption
(mL·kg·min
-1
)
-5.3 ± 9.3
P = 0.036
(-1.4 ± 1.9)
0.64 ± 5.4
P = 0.746
(0.2 ± 1.1)
P≠ = 0.071 -11.2 ± 6.7
P = 0.000
(-2.6 ± 1.6)
-1.22 ± 4.5
P = 0.471
(-0.2 ± 1.0)
P≠ = 0.003 -7.8 ± 8.7
P = 0.056
(-1.9 ± 1.9)
-5.4 ± 10.1
P = 0.173
(-1.3 ± 2.2)
P≠ = 0.414
Resting heart rate
(bpm)
-2.5 ± 7.3
P = 0.261
(-2 ± 4)
-2.1 ± 9.2
P = 0.534
(-2 ± 6)
P≠ = 0.923 -3.0 ± 6.4
P = 0.149
(-2 ± 4)
-6.2 ± 7.7
P = 0.057
(-5 ± 5)
P≠ = 0.407 -2.2 ± 7.5
P = 0.335
(-2 ± 5)
-1.7 ± 11.1
P = 0.671
(-2 ± 7)
P≠ = 0.918
Systolic BP (mm Hg) -1.0 ± 4.9
P = 0.508
(-1.0 ± 5.7)
-1.0 ± 2.4
P = 0.266
(-1.0 ± 2.4)
P≠ = 0.984 -2.0 ± 6.3
P = 0.293
(-2.3 ± 7.9)
-0.1 ± 3.9
P = 0.938
(0.0 ± 3.8)
P≠ = 0.459 -2.0 ± 6.6
P = 0.309
(-2.4 ± 8.0)
-0.3 ± 5.7
P = 0.888
(0.0 ± 6.1)
P≠ = 0.553
Diastolic BP (mm Hg) -0.5 ± 5.9
P = 0.793
(-0.3 ± 4.4)
0.4 ± 4.5
P = 0.767
(0.1 ± 3.5)
P≠ = 0.704 -2.0 ± 6.4
P = 0.300
(-0.3 ± 4.4)
-0.7 ± 7.7
P = 0.809
(0.1 ± 3.5)
P≠ = 0.682 -2.2 ± 6.6
P = 0.268
(-1.8 ± 4.7)
-2.8 ± 5.8
P = 0.206
(-1.8 ± 4.1)
P≠ = 0.829
P value for difference in change within groups between 2 time points
P≠ value for difference in change between groups at each time point
Journal of Occupational Medicine and Toxicology 2008, 3:7 />Page 6 of 10
(page number not for citation purposes)
absolute 2minVO
2
, but no significant interaction effect (F
= 2.385; P = 0.079). Post hoc analysis between groups
revealed that significant differences occurred at weeks 4 (P
= 0.000), 8 (P = 0.003) and 12 (P = 0.001) respectively.
While post hoc analysis within groups showed significant
reductions in the exercise group between week 0 and week
4 (P = 0.006), week 4 and week 8 (P = 0.019), week 0 and
week 8 (P = 0.000), and week 0 and week 12 (P = 0.000)
in the exercise group, but no significant changes within
the control group at any time point.
There were significant time (F = 4.004; P = 0.012) and treat-
ment effects (F = 4.803; P = 0.042), but no significant inter-
action effect (F = 2.705; P = 0.054) in % change for absolute
4minVO
2
. Post hoc analysis between groups revealed that
significant differences occurred at weeks 4 (P = 0.033) and
8 (P = 0.009), but not at week 12. Significant reductions
occurred in the exercise group between week 4 and week 8
(P = 0.038), week 0 and week 8 (P = 0.002), week 8 and
week 12 (P = 0.049) and week 0 and week 12 (P = 0.021),
but not between week 0 and week 4. No significant changes
occurred at any time point in the control group.
Changes in body composition and blood pressure
No significant time, treatment or interaction effects were
observed for BMI (time F = 0.894; P = 0.364; treatment F
= 0.468; P = 0.468; interaction F = 0.034; P = 0.857),
weight (time F = 0.967; P = 0.389; treatment F = 0.501; P
= 0.607; interaction F = 0.211; P = 0.652), systolic blood
pressure (time F = 0.314; P = 0.746; treatment F = 1.657;
P = 0.214; interaction F = 0.469; P = 0.641) or diastolic
blood pressure (time F = 1.483; P = 0.229; treatment F =
0.293; P = 0.595; interaction F = 0.151; P = 0.929) over the
12 week intervention period.
Changes in blood parameters
Table 4 and 5 present blood parameter outcomes. No sig-
nificant time, treatment or interaction effects were
observed for total cholesterol (time F = 0.145; P = 0.932;
treatment F = 0.049; P = 0.827; interaction F = 0.769; P =
0.516), glucose (time F = 0.209; P = 0.890; F = 0.049; P =
0.827; F = 0.615; P = 0.608), IL-6 (time F = 0.877; P =
0.429; F = 2.482; P = 0.133; F = 1.326; P = 0.278) or TNF-
α (time F = 0.057; P = 0.982; treatment F = 0.002; P =
0.961; interaction F = 1.180; P = 0.326) over the 12 week
intervention period. However while there was no signifi-
cant time or treatment effect for CRP in exercise and con-
trol groups (time F = 1.703; P = 0.201; treatment F =
0.189; P = 0.669), there was a significant interaction effect
(F = 3.309; P = 0.027). Post-hoc analysis revealed that
there were no significant differences between exercise and
control groups at any of the time points tested. However
there were significant reductions in CRP within the exer-
cise group between week 1 and week 4 (P = 0.013), week
4 and week 8 (P = 0.000), and between week 1 and week
8 (P = 0.010), while there was no significant change at any
Table 3: Effects of the exercise-training programme on physiological outcomes from interim time point – exercise group (n = 12);
control group (n = 8)
% Δ Week 4 – 8 % Δ Week 8 – 12
Variable Exercise (mean ± SD) Control (mean ± SD) Exercise (mean ± SD) Control (mean ± SD)
Peak oxygen consumption
(mL·min)
0.6 ± 5.0
P = 0.627 (15 ± 101)
-2.1 ± 8.5
P = 0.377 (-38 ± 154)
-1.3 ± 6.4
P = 0.377 (-33 ± 159)
-1.6 ± 7.9
P = 0.389 (-46 ± 166)
Peak oxygen consumption
(mL·kg·min
-1
)
0.6 ± 5.8
P = 0.693 (0.1 ± 2.0)
1.0 ± 7.3
P = 0.015 (-0.3 ± 2.0)
-2.0 ± 9.6
P = 0.424 (-0.4 ± 2.8)
-2.9 ± 9.6
P = 0.685 (-1.1 ± 2.9)
Time to exhaustion (min) 4.0 ± 9.2
P = 0.190 (0.4 ± 1.0)
-0.5 ± 13.9
P = 0.826 (-0.2 ± 1.2)
-0.7 ± 12.8
P = 0.953 (-1.3 ± 1.8)
6.6 ± 22.9
P = 0.559 (0.3 ± 1.7)
Peak heart rate (bpm) -1.28 ± 2.5
P = 0.096 (-2 ± 4)
-0.7 ± 2.5
P = 0.439 (-1 ± 5)
1.1 ± 1.7
P = 0.051 (2 ± 3)
-0.2 ± 1.9
P = 0.686 (-1 ± 4)
2 min oxygen consumption
(mL·min)
-7.1 ± 8.3
P = 0.019 (-110 ± 146)
-5.0 ± 11.1
P = 0.217 (-53 ± 129)
2.4 ± 6.3
P = 0.275 (19 ± 73)
0.6 ± 7.9
P = 0.948 (7 ± 87)
2 min oxygen consumption
(mL·kg·min
-1
)
-7.8 ± 8.6
P = 0.113 (-1.6 ± 1.8)
-4.0 ± 10.1
P = 0.286 (-0.8 ± 1.8)
1.9 ± 6.8
P = 0.363 (0.2 ± 1.2)
-0.2 ± 7.9
P = 0.902 (-0.1 ± 1.4)
4 min oxygen consumption
(L·min)
-4.6 ± 7.0
P = 0.038 (-77 ± 136)
-2.9 ± 6.5
P = 0.398 (-39 ± 84)
3.6 ± 5.8
P = 0.049 (47 ± 78)
-3.1 ± 11.3
P = 0.441 (-43 ± 146)
4 min oxygen consumption
(mL·kg·min
-1
)
-5.2 ± 6.9
P = 0.023 (-1.2 ± 1.7)
-1.7 ± 5.7
P = 0.381 (-0.4 ± 1.2)
3.4 ± 5.6
P = 0.009 (0.6 ± 1.0)
-4.0 ± 11.7
P = 0.339 (-1.0 ± 2.5)
Resting heart rate (bpm) -0.1 ± 9.7
P = 0.846 (0 ± 6)
-3.7 ± 8.6
P = 0.254 (-3 ± 6)
1.1 ± 7.6
P = 0.700 (0 ± 5)
4.8 ± 9.0
P = 0.164 (3 ± 5)
Systolic BP (mm Hg) -1.0 ± 5.3
P = 0.537 (-1.3 ± 7.0)
-0.9 ± 2.7
P = 0.368 (1.0 ± 2.9)
0.1 ± 4.5
P = 0.989 (-0.1 ± 5.1)
-0.2 ± 4.8
P = 0.915 (0.0 ± 5.1)
Diastolic BP (mm Hg) -1.3 ± 6.3
P = 0.462 (-1.3 ± 5.3)
-1.2 ± 4.0
P = 0.455 (-0.7 ± 4.1)
-0.1 ± 5.6
P = 0.905 (-0.2 ± 4.2)
-1.6 ± 9.5
P = 0.539 (-1.2 ± 4.6)
P value for difference in change within groups between 2 time points
Journal of Occupational Medicine and Toxicology 2008, 3:7 />Page 7 of 10
(page number not for citation purposes)
time point in the control group. There was a trend for a
decrease in TNF-α from baseline within the exercise group
compared to the control group.
Discussion
The data from the study confirmed that a moderate inten-
sity aerobic exercise-training programme performed 4
times a week could be successfully implemented within
the workplace during working hours. Furthermore, it was
demonstrated that it was effective at reducing risk factors
associated with cardiovascular disease, and at improving
physiological capacity within previously sedentary indi-
viduals. Specifically, significant improvements were
found in peak oxygen consumption (VO
2 peak
), economy
of absolute oxygen utilization at both 2 minutes
(2minVO
2
) and 4 minutes (4minVO
2
), and C-reactive
protein (CRP) concentration. These results confirm previ-
ous reports showing that improved cardiovascular fitness,
or physical activity level reduces cardiovascular risk, with
a particular association with lower CRP levels [9,23,24].
This is the first report combining objective physiological
outcome measures with objective monitoring of the train-
ing programme to demonstrate the type of exercise that
can be effectively carried out during working hours, while
still providing health related benefits.
At the end of the 8-week intervention period absolute VO
2
peak
increased significantly by 5 % in the exercise group,
while it decreased significantly by 6 % in the control
group. There was no significant change in peak heart rate
in the exercise group, but there was a significant reduction
in peak heart rate in the control group, suggesting that a
Table 4: Effects of the exercise-training programme on blood parameters from baseline – exercise group (n = 12); control group (n = 8)
Δ Week 1 – 4 Δ Week 1 – 8 Δ Week 1 – 12
Variable Exercise
(mean ±
SD)
Control
(mean ±
SD)
Difference
between
groups
Exercise
(mean ±
SD)
Control
(mean ±
SD)
Difference
between
groups
Exercise
(mean ±
SD)
Control
(mean ±
SD)
Difference
between
groups
Total
Cholesterol
(mmol/L)
0.0 ± 0.6
P = 0.827
0.0 ± 0.5
P = 0.880
P≠ = 0.688 -0.2 ± 0.4
P = 0.136
0.1 ± 0.3
P = 0.590
P≠ = 0.771 0.0 ± 0.4
P = 0.967
0.0 ± 0.5
P = 0.944
P≠ = 0.692
Total Glucose
(mmol/L)
0.1 ± 1.0
P = 0.416
-0.1 ± 0.4
P = 0.943
P≠ = 0.934 0.0 ± 0.8
P = 0.912
0.1 ± 0.6
P = 0.450
P≠ = 0.511 -0.1 ± 0.9
P = 0.936
-0.2 ± 0.6
P = 0.844
P≠ = 0.760
IL-6 (pg/L) -0.3 ± 1.0
P = 0.269
0.7 ± 0.8
P = 0.038
P≠ = 0.939 -0.7 ± 2.0
P = 0.231
0.3 ± 1.2
P = 0.553
P≠ = 0.974 0.2 ± 1.2
P = 0.660
-0.1 ± 0.7
P = 0.840
P≠ = 0.324
TNF-α (pg/L) -0.9 ± 1.3
P = 0.032
0.8 ± 2.4
P = 0.363
P≠ = 0.448 -0.9 ± 1.7
P = 0.102
0.3 ± 1.6
P = 0.663
P≠ = 0.297 -0.9 ± 1.6
P = 0.086
0.3 ± 1.3
P = 0.567
P≠ = 0.268
CRP (mg/L)* -0.4 ± 0.6
P = 0.013
-0.3 ± 0.9
P = 0.526
P≠ = 0.585 -0.9 ± 0.8
P = 0.010
-0.4 ± 1.3
P = 0.127
P≠ = 0.224 -1.2 ± 1.5
P = 0.823
0.1 ± 0.7
P = 0.836
P
≠ = 0.199
P value for difference in change within groups between 2 time points
P≠ value for difference in change between groups at each time point
CRP (mg/L)* P value based on logged data transformation
Table 5: Effects of the exercise-training programme on blood parameters from interim time point – exercise group (n = 12); control
group (n = 8)
Δ Week 4 – 8 Δ Week 8 – 12
Variable Exercise (mean ± SD) Control (mean ± SD) Exercise (mean ± SD) Control (mean ± SD)
Total Cholesterol
(mmol/L)
-0.2 ± 0.6
P = 0.365
0.1 ± 0.3
P = 0.464
-0.2 ± 0.5
P = 0.170
-0.1 ± 0.3
P = 0.667
Total Glucose (mmol/L) -0.1 ± 0.2
P = 0.195
0.1 ± 0.4
P = 0.480
0.0 ± 0.2
P = 0.955
-0.1 ± 0.4
P = 0.388
IL-6 (pg/L) -0.4 ± 1.2
P = 0.306
-0.4 ± 1.3
P = 0.361
0.9 ± 1.5
P = 0.077
-0.3 ± 0.1
P = 0.338
TNF-α (pg/L) 0.1 ± 1.5
P = 0.894
-0.6 ± 1.5
P = 0.319
0.0 ± 1.7
P = 0.945
0.0 ± 1.2
P = 0.977
CRP (mg/L)* -1.0 ± 0.4
P = 0.000
0.0 ± 0.5
P = 0.266
-0.5 ± 0.7
P = 0.101
0.6 ± 1.74
P = 0.284
P value for difference in change within groups between 2 time points
CRP (mg/L)* P value based on logged data transformation
Journal of Occupational Medicine and Toxicology 2008, 3:7 />Page 8 of 10
(page number not for citation purposes)
decline in effort contributed to the observed fall in VO
2
peak
. Absolute 2minVO
2
and 4minVO
2
decreased signifi-
cantly by 17 % and 11 % respectively in the exercise
group, while there was no significant change in the con-
trol group. Furthermore, as the exercise group averaged
the completion of 81 % and 84 % of the prescribed exer-
cise sessions between week 1 and week 4, and week 4 and
week 8 respectively, it can be concluded that the progres-
sive aerobic exercise training programme was not only
effective at improving the physical fitness of a sedentary
group of adults, but was also successful at increasing phys-
ical activity levels.
However although cardiovascular fitness and physical
activity are positively related, research indicates that it is
the former that is more closely linked to cardiovascular
disease risk factors and disease, than actual physical activ-
ity level [25,26]. As a consequence it has been shown that
it is only those individuals who increase their VO
2 max
,
rather than their actual physical activity level that reduce
their relative risk of cardiovascular disease risk factors
[27]. This has been attributed to a reduction in large artery
stiffness, which may be mediated by concomitant changes
in high-density lipoprotein (HDL) cholesterol and body
weight [28].
This holds relevance for the present study: after 8 weeks
when the exercise group were not provided with any fur-
ther progression or instruction to the exercise training
programme VO
2 peak
decreased by 2 %. In view of the 70
% completion of the 16 sessions, and the significant
improvement in absolute 4minVO
2
(-7 %), it appears
probable that the intensity of the exercise performed
within this time period was too low to challenge VO
2 peak
.
This is supported by evidence that indicates that VO
2 max
has a modest association with physical activity, but a
much stronger association with the mean intensity of the
exercise [29]. In view of this, and the cardio protective
benefit of an increase in VO
2 max
future research should
evaluate the implication of a higher intensity workplace
exercise training programme on the modification of cardi-
ovascular risk profile, while assessing whether it remains
successful at ensuring exercise adherence.
It appears that supervision and progression of the exercise
programme may influence adherence [30,31]. In the
present study, at 8 weeks when no further progression or
supervision to the exercise training programme was pro-
vided a reduction in the adherence of the training sessions
occurred; 81 % and 84 % were completed in week 1 to
week 4 and week 4 to week 8, while only 70 % were com-
pleted in week 8 to week 12. This could further highlight
the need for employers to ensure the provision of addi-
tional support and progression to the original training
programme for optimal participation of employees, and
success of the programme.
The exercise group demonstrated a significant decrease in
CRP of -0.4 ± 0.6 mg/L between week 1 and week 4, and -
1.0 ± 0.4 mg/L between week 4 and week 8. However
while this is in accordance with previous research [24,32],
it should be noted that due to a mean baseline value indi-
cating high risk for CVD (> 3.0 mg/L), that the reduction
would still result in a mean value indicating average risk
of CVD (2.2 mg/L) [33]. The mechanism behind such
action remains unclear. It has been postulated that a
reduction in CRP is attained via the positive benefit of
exercise on BMI via modulation of the percentage of vis-
ceral fat and insulin receptor sensitivity [24]. However,
within the present study there was no such positive effect
on body composition, or fasting glucose. Another poten-
tial explanation is that among unfit individuals there is a
greater generation of reactive oxygen species via normal
metabolic processes, and unaccustomed muscle stretch-
ing. This leads to subliminal injury of the myocytes, that
causes both cell and tissue oxidative damage, leading to
an inflammatory response [34]. Evidence confirms that
chronic exercise induces a mechanical resistance of the
myocytes to stretching, and elevates endogenous antioxi-
dant enzyme activity, which prevents excessive local
inflammatory response [35]. As there were significant
gains in aerobic capacity within the exercise group it is
plausible that this explanation provides a mechanism of
action for the observed results.
No significant change was observed in IL-6 at any time
point during the study. However there was a significant
reduction in TNF-α between week 1 and week 4 in the
exercise group. As TNF-α directly impairs glucose uptake
and metabolism via a direct effect on insulin signal trans-
duction, a reduction holds positive benefit for prevention
of CVD [10]. Thus despite the lack of a significant change
in fasting glucose, there is still suggestive evidence that the
training programme may accrue positive benefit for this
specific risk factor.
Although the present study was successful at improving
maximal and submaximal aerobic exercise capacity, it had
no significant effect on fasting glucose or cholesterol,
blood pressure or BMI. It is likely that the small sample
size is responsible for such null findings. However it is
also unsurprising for a number of reasons.
Firstly, although physical activity and exercise improves
insulin sensitivity through a direct effect on the muscle
(enhancement of insulin receptor autophsophorylation
[36], increase in GLUT-4 content [37] and glucose trans-
port-phosphorylation [38], and a reduction in visceral
obesity [39], neither the exercise nor the control group
Journal of Occupational Medicine and Toxicology 2008, 3:7 />Page 9 of 10
(page number not for citation purposes)
exhibited impaired glucose tolerance (exercise = 5.04 ±
0.50; control = 5.11 ± 0.52 mmol/L) at baseline that
would have required intervention modification. The same
can be said for blood pressure, with all participants classi-
fied as normotensive (exercise = 118 ± 12/73 ± 10; control
= 106 ± 10/69 ± 9) at baseline. Nevertheless, in view of the
beneficial effect that exercise has on glucose tolerance,
and evidence that those with low levels of physical fitness
are shown to be at a relative risk of 1.52 for developing
hypertension, when compared to highly fit individuals
[6], the use of exercise in aiding glycemic control, and the
maintenance of healthy blood pressure should still be
encouraged.
Secondly, regarding BMI, it should be considered that the
aim of the training programme was not to directly target
weight loss for a reduction of cardiovascular risk, but
instead to improve physiological capacity, and biomark-
ers of cardiovascular profile. In accordance with this, and
in the absence of dietary modification, it would have been
unlikely that the 4 × 30 minute sessions per week would
have provided the necessary negative energy balance stim-
ulus of 500 – 1000 kcal·d
-1
to achieve gradual weight loss
(ACSM, 2006). Given that a BMI ≥ 30 kg·m
-2
classifies
obesity, concomitantly increasing the risk of hyperten-
sion, poor total cholesterol/HDL cholesterol ratio, coro-
nary disease and mortality rate [40], there is a need for
future work place health promotion programmes to eval-
uate whether an aerobic exercise training programme spe-
cifically targeting weight loss and management as its
primary outcome can be successfully implemented within
the workforce.
A limitation of the present study was the failure to exam-
ine lipoprotein subfractions; small low-density lipopro-
teins (LDLs), high-density lipoproteins (HDLs), high-
density lipoprotein subfractions (HDL
3
and HDL
2
), very
low-density lipoproteins (VLDLs), and respective particle
size, that better reflect CVD risk than absolute measures of
cholesterol concentrations [41]. In a recent study, Halver-
stadt et al (2007) concluded that an aerobic exercise train-
ing program consisting of 20 minutes, 3 days a week,
progressively building up to a duration of 40 minutes and
an intensity of 70 % VO
2 max
for a period of 24 weeks, plus
a weekend walk was successful at improving lipid subfrac-
tion profile and cardiovascular risk independent of diet
and change in body fat. This is supported by several other
studies, which also indicate an improved plasma lipopro-
tein profile with exercise training, exclusive of weight loss
[5,42].
Conclusion
Our pilot study provides objective and randomised con-
trolled trial data demonstrating that regular supervised
exercise increases physical activity for healthy individuals,
and improves exercise capacity, with a concomitant cardi-
oprotective benefit. As this can be achieved without dis-
rupting the working day, this exercise programme
provides a means of improving health at work. As the
study was conducted within an NHS department, it may
be of particular relevance to the NHS, as the single largest
employer in Europe.
Competing interests
The author(s) declare that they have no competing inter-
ests.
Authors' contributions
JAH conceived the study design, carried out the testing,
performed statistical testing and drafted the manuscript.
MM carried out the immunoassays. GPW participated in
the coordination of the study and drafting of the manu-
script. KvS helped to draft the manuscript. TSL conceived
of the study, and participated in its design and coordina-
tion, and helped to draft the manuscript. All authors read
and approved the final manuscript.
References
1. Roberts CK, Barnard RJ: Effects of exercise and diet on chronic
disease. J Appl Physiol 2005, 98(1):3-30.
2. Wilund KR: Is the anti-inflammatory effect of regular exercise
responsible for reduced cardiovascular disease. Clin Sci 2007,
112(11):543-55.
3. Wannamethee SG, Lowe GD, Whincup PH, Rumley A, Walker M,
Lennon L: Physical activity and hemostatic and inflammatory
variables in elderly men. Circulation 2002, 105(15):1785-1790.
4. Eriksson KF, Lindgarde F: No excess 12-year mortality in men
with impaired glucose tolerance who participated in the
Malmo Preventive Trial with diet and exercise. Diabetologia
1998, 41(9):1010-1016.
5. Kraus WE, Houmard JA, Duscha BD, Knetzger KJ, Wharton MB,
McCartney JS, Bales CW, Henes S, Samsa GP, Otvos JD, Kulkarni KR,
Slentz CA: Effects of the amount and intensity of exercise on
plasma lipoproteins. N Engl J Med 2002, 347(19):1483-1492.
6. Blair SN, Goodyear NN, Gibbons LW, Cooper KH: Physical fitness
and incidence of hypertension in healthy normotensive men
and women. JAMA 1984, 252(4):487-490.
7. Melo RC, Santos MD, Silva E, Quiterio RJ, Moreno MA, Reis MS, Ver-
zola IA, Oliveira L, Martins LD, Gallo-Junior L, Catai AM: Effects of
age and physical activity on the autonomic control of heart
rate in healthy men. Braz J Med Biol Res 2005, 38(9):1331-1338.
8. Tate DF, Jeffery RW, Sherwood NE, Wing RR: Long-term weight
losses associated with prescription of higher physical activity
goals. Are higher levels of physical activity protective against
weight regain? Am J Clin Nutr 2007, 85(4):954-959.
9. Borodulin K, Laatikainen T, Salomaa V, Jousilahti P: Associations of
leisure time physical activity, self-rated physical fitness, and
estimated aerobic fitness with serum C-reactive protein
among 3,803 adults. Atherosclerosis 2006, 185(2):381-387.
10. Pedersen BK: The anti-inflammatory effect of exercise: its role
in diabetes and cardiovascular disease control. Essays Biochem
2006,
42:105-117.
11. Vasankari TJ, Kujala UM, Vasankari TM, Ahotupa M: Reduced oxi-
dized LDL levels after a 10-month exercise program. Med Sci
Sports Exerc 1998, 30(10):1496-1501.
12. Walther C, Gielen S, Hambrecht R: The effect of exercise train-
ing on endothelial function in cardiovascular disease in
humans. Exerc Sport Sci Rev 2004, 32(4):129-134.
13. Smith JK, Dykes R, Douglas JE, Krishnaswamy G, Berk S: Long-term
exercise and atherogenic activity of blood mononuclear cells
in persons at risk of developing ischemic heart disease. JAMA
1999, 281(18):1722-1727.
Publish with BioMed Central and every
scientist can read your work free of charge
"BioMed Central will be the most significant development for
disseminating the results of biomedical research in our lifetime."
Sir Paul Nurse, Cancer Research UK
Your research papers will be:
available free of charge to the entire biomedical community
peer reviewed and published immediately upon acceptance
cited in PubMed and archived on PubMed Central
yours — you keep the copyright
Submit your manuscript here:
/>BioMedcentral
Journal of Occupational Medicine and Toxicology 2008, 3:7 />Page 10 of 10
(page number not for citation purposes)
14. Kramsch DM, Aspen AJ, Rozler LJ: Atherosclerosis: Prevention
by agents not affecting abnormal levels of blood lipids. Science
1981, 213(4515):1511-1512.
15. American College of Sports Medicine (ACSM): Guidelines for Exercise
Prescription 7th edition. Philadelphia; USA: Lippincott Williams and
Wilkins; 2006.
16. The Chief Medical Officer. At least five a week: evidence on
the impact of physical activity and its relationship to health
2004 [ />PublicationsPolicyAndGuidance/DH_4080994].
17. Addley K, McQuillan P, Ruddle M: Creating healthy workplaces
in Northern Ireland: evaluation of a lifestyle and physical
activity assessment programme. Occup Med 2001,
51(7):439-449.
18. Stamatakis E, Hillsdon M, Primatesta P: Domestic physical activity
in relationship to multiple CVD risk factors. Am J Prev Med
2007, 32(4):320-327.
19. Murphy MH, Murtagh EM, Boreham CA, Hare LG, Nevill AM: The
effect of a worksite based walking programme on cardiovas-
cular risk in previously sedentary civil servants. BMC Public
Health 2006, 6:136.
20. White K, Jacques PH: Combined diet and exercise intervention
in the workplace: effect on cardiovascular disease risk fac-
tors. AAOHN J 2007, 55(3):109-114.
21. Proper KI, Koning M, van der Beek AJ, Hildebrandt VH, Bosscher RJ,
van Mechelen W: The effectiveness of worksite physical activ-
ity programs on physical activity, physical fitness, and health.
Clin J Sport Med 2003, 13(2):106-117.
22. Godin G, Shephard RJ: A simple method to assess exercise
behavior in the community. Can J Appl Sport Sci 1985,
10(3):141-146.
23. Kuo HK, Yen CJ, Chen JH, Yu YH, Bean JF: Association of cardi-
orespiratory fitness and levels of C-reactive protein: data
from the National Health and Nutrition Examination Survey
1999–2002. Int J Cardiol 2007, 114(1):28-33.
24. Elosua R, Bartali B, Ordovas JM, Corsi AM, Lauretani F, Ferrucci L:
Association between physical activity, physical performance,
and inflammatory biomarkers in an elderly population: the
InCHIANTI study. J Gerontol A Biol Sci Med Sci 2005,
60(6):760-767.
25. Suzuki I, Yamada H, Sugiura T, Kawakami N, Shimizu H: Cardiovas-
cular fitness, physical activity and selected coronary heart
disease risk factors in adults. J Sports Med Phys Fitness 1998,
38(2):149-157.
26. Lakka TA, Venalainen JM, Rauramaa R, Salonen R, Tuomilehto J, Salo-
nen JT: Relation of leisure-time physical activity and cardi-
orespiratory fitness to the risk of acute myocardial
infarction. N Engl J Med 1994,
330(22):1549-1554.
27. McMurray RG, Ainsworth BE, Harrell JS, Griggs TR, Williams OD: Is
physical activity or aerobic power more influential on reduc-
ing cardiovascular disease risk factors? Med Sci Sports Exerc
1998, 30(10):1521-1529.
28. Ferreira I, Twisk JW, Stehouwer CD, van Mechelen W, Kemper HC:
Longitudinal changes in VO2max: associations with carotid
IMT and arterial stiffness. Med Sci Sports Exerc 2003,
35(10):1670-1678.
29. O'Donovan G, Owen A, Bird SR, Kearney EM, Nevill AM, Jones DW,
Woolf-May K: Changes in cardiorespiratory fitness and coro-
nary heart disease risk factors following 24 wk of moderate-
or high-intensity exercise of equal energy cost. J Appl Physiol
2005, 98(5):1619-1625.
30. Bendermacher BL, Willigendael EM, Teijink JA, Prins MH: Super-
vised exercise therapy versus non-supervised exercise ther-
apy for intermittent claudication. Cochrane Database Syst Rev
2006, 2(2):CD005263.
31. Olney SJ, Nymark J, Brouwer B, Culham E, Day A, Heard J, Hender-
son M, Parvatanei K: A randomized controlled trial of super-
vised versus unsupervised exercise programs for ambulatory
stroke survivors. Stroke 2006, 37(2):476-481.
32. Albert MA, Glynn RJ, Ridker PM: Effect of physical activity on
serum C-reactive protein. Am J Cardiol 2004, 93(2):221-5.
33. Pearson TA, Mensah GA, Alexander RW, Anderson JL, Cannon RO,
Criqui M: Markers of inflammation and cardiovascular dis-
ease: application to clinical and public health practice: A
statement for healthcare professionals from the Centers for
Disease Control and Prevention and the American Heart
Association. Circulation 2003, 108(1):499-511.
34. Pansarasa O, Castagna L, Colombi B, Vecchiet J, Felzani G, Marzatico
F: Age and sex differences in human skeletal muscle: role of
reactive oxygen species. Free Radic Res 2000, 33(3):287-293.
35. Elosua R, Molina L, Fito M, Arquer A, Sanchez-Quesada JL, Covas MI,
Ordonez-Llanos J, Marrugat J: Response of oxidative stress
biomarkers to a 16-week aerobic physical activity program,
and to acute physical activity, in healthy young men and
women. Atherosclerosis 2003, 167(2):327-334.
36. Youngren JF, Keen S, Kulp JL, Tanner CJ, Houmard JA, Goldfine ID:
Enhanced muscle insulin receptor autophosphorylation with
short-term aerobic exercise training.
Am J Physiol Endocrinol
Metab 2001, 280(3):E528-33.
37. Hughes VA, Fiatarone MA, Fielding RA, Kahn BB, Ferrara CM, Shep-
herd P, Fisher EC, Wolfe RR, Elahi D, Evans WJ: Exercise increases
muscle GLUT-4 levels and insulin action in subjects with
impaired glucose tolerance. Am J Physiol 1993, 264(6 Pt
1):E855-62.
38. Perseghin G, Price TB, Petersen KF, Roden M, Cline GW, Gerow K,
Rothman DL, Shulman GI: Increased glucose transport-phos-
phorylation and muscle glycogen synthesis after exercise
training in insulin-resistant subjects. N Engl J Med 1996,
335(18):1357-1362.
39. Short KR, Vittone JL, Bigelow ML, Proctor DN, Rizza RA, Coenen-
Schimke JM, Nair KS: Impact of aerobic exercise training on
age-related changes in insulin sensitivity and muscle oxida-
tive capacity. Diabetes 2003, 52(8):1888-1896.
40. Hu G, Tuomilehto J, Silventoinen K, Barengo N, Jousilahti P: Joint
effects of physical activity, body mass index, waist circumfer-
ence and waist-to-hip ratio with the risk of cardiovascular
disease among middle-aged Finnish men and women. Eur
Heart J 2004, 25(24):2212-2219.
41. Rosenson RS, Otvos JD, Freedman DS: Relations of lipoprotein
subclass levels and low-density lipoprotein size to progres-
sion of coronary artery disease in the Pravastatin Limitation
of Atherosclerosis in the Coronary Arteries (PLAC-I) trial.
Am J Cardiol 2002, 90(2):89-94.
42. Thompson PD, Yurgalevitch SM, Flynn MM, Zmuda JM, Spannaus-
Martin D, Saritelli A, Bausserman L, Herbert PN: Effect of pro-
longed exercise training without weight loss on high-density
lipoprotein metabolism in overweight men. Metabolism 1997,
46(2):217-223.