báo cáo hóa học: " Effort-reward imbalance and overcommitment in employees in a Norwegian municipality: a cross sectional study" pdf
Bạn đang xem bản rút gọn của tài liệu. Xem và tải ngay bản đầy đủ của tài liệu tại đây (336.9 KB, 11 trang )
Journal of Occupational Medicine
and Toxicology
BioMed Central
Open Access
Research
Effort-reward imbalance and overcommitment in employees in a
Norwegian municipality: a cross sectional study
Bjørn Lau
Address: National Institute of Occupational Health, Oslo, Norway
Email: Bjørn Lau -
Published: 30 April 2008
Journal of Occupational Medicine and Toxicology 2008, 3:9
doi:10.1186/1745-6673-3-9
Received: 11 December 2007
Accepted: 30 April 2008
This article is available from: />© 2008 Lau; licensee BioMed Central Ltd.
This is an Open Access article distributed under the terms of the Creative Commons Attribution License ( />which permits unrestricted use, distribution, and reproduction in any medium, provided the original work is properly cited.
Abstract
Background: The aim of this study was to validate a Norwegian version of the Effort-Reward
Imbalance Questionnaire (ERI-Q).
Methods: One thousand eight-hundred and three employees in a medium-sized Norwegian
municipality replied to the ERI-Q, and health-related variables such as self-reported general health,
psychological distress, musculoskeletal complaints, and work-related burnout were examined.
Results: Sound psychometric properties were found for this Norwegian version of the ERI-Q.
When the two dimensions of ERI and overcommitment were analyzed in four types of employees,
the results showed that employees characterized by a combination of high values on ERI and
overcommitment had more unfavorable health scores than others. Employees with low effortreward and overcommitment scores had more favorable health scores. Employees with scores on
the overcommitment and the effort-reward scales that are supposed to have opposite effects on
health (that is, the combination of low overcommitment with a high effort-reward score and vice
versa), had health scores somewhere in between the two other groups.
Conclusion: Satisfactory psychometric properties were found for most of the latent factors in the
ERI-Q. The findings also indicate that it may be fruitful to explore health conditions among
employees with different combinations of effort-reward and overcommitment.
Background
According to the effort-reward imbalance (ERI) model by
Siegrist et al. [1], effort at work is part of a social contract
that is reciprocated by adequate reward. Rewards are distributed by three transmitter systems: esteem, career
opportunities, and job security. Failed reciprocity between
efforts and rewards may enhance the activation of the
autonomic nervous system and influence the risk of coronary heart disease [2-4]. According to the model, adverse
health effects can also be triggered by an individual's
exhaustive coping style, known as overcommitment.
More specifically, this model consists of three hypotheses
[5]: (1) The ERI hypothesis: The mismatch between high
effort and low reward (no reciprocity) produces adverse
health effects, (2) The overcommitment hypothesis: A high
level of personal commitment (overcommitment)
increases the risk of reduced health (even when the ERI is
absent), and (3) The interaction hypothesis: Relatively
higher risks of reduced health are expected in people who
are characterized by conditions (1) and (2).
High effort and low reward conditions have repeatedly
been shown to be positively associated with the incidence
of coronary events [6-10]. Overcommitment has also
Page 1 of 11
(page number not for citation purposes)
Journal of Occupational Medicine and Toxicology 2008, 3:9
been shown to be associated with increased risks of cardiovascular disease (CVD) (for a review, see van Vegchel et
al. [11]). Corresponding support has not been found for
the interaction hypothesis regarding CVD risk factors or
CVD symptoms [11].
The ERI model and its hypotheses have also been investigated in terms of self-reported health and well-being (for
a review, see Tsutsumi and Kawakami [12] and van
Vegchel et al. [11]). The ERI has been found to be related
to self-reported health [13-16], poor well-being [17], and
depression [18,19]. Overcommitment has been found to
be associated with musculoskeletal pain [20], depression
[21], psychosomatic complaints [13], and self-reported
health in men [14]. Support for the interaction hypothesis
is inconsistent. For instance, a higher risk for emotional
burnout due to ERI in overcommitted employees was
found in one study [17], but not in another [21].
In a comparison of results from five European studies
(Belgium, France, Germany, Sweden, and the UK), variations of the components in the ERI model were reviewed
according to types of occupation, education, age, and gender [1]. In three countries, the effort scale measurements
were higher in men than in women, whereas a reverse tendency was found in the UK study. Lower effort was associated with increased age in two studies with a high
proportion of elderly subjects. Mean effort was significantly higher among better-educated groups in four samples, and a similar nonsignificant tendency was observed
in a smaller German sample. Reward did not differ
according to gender in a consistent way, but there was a
tendency of higher sores among older employees and
especially in men. A positive association of reward with
degree of education was observed in two samples. A clearcut gradient was observed with higher reward scores
among higher employment grades. Men and women aged
45–54 generally had the highest overcommitment scores,
and employees with higher education tended to exhibit
higher overcommitment scores.
This study has three aims. Because the effort-reward
model has not been systematically examined in Norway,
the standardized self-administrated questionnaire for
measuring ERI (ERI-Q) [1] was translated into Norwegian
and answered by employees in a Norwegian municipality.
The first aim of this study was to examine the factor structure of this instrument with confirmatory factor analyses.
Secondly, the differences in mean values of the components in the ERI instrument, according to gender, age,
education, and occupation, were examined. Thirdly, to
explore criterion validity, the ERI hypothesis, the overcommitment hypothesis and the interaction hypothesis
were tested in relation to self-reported health, psycholog-
/>
ical distress, musculoskeletal complaints, and workrelated burnout.
Siegrist does not specify whether the interaction hypothesis refers to additive main effects or to a synergistic effect.
A synergetic understanding of an interaction effect is that
the level of a moderator variable influences the relationship between the independent variables and the dependent variable. In line with such a view, we would expect the
associations between effort-reward imbalance and the
health variables included in this study to be strongest
among employees with high scores on overcommitment.
Most studies have tested for the interaction hypothesis on
a variable level using regression analysis. However,
because we were also interested in employees with scores
on the overcommitment and effort-reward scales that are
supposed to have opposing effects on health (that is, the
combination of low overcommitment with high effortreward score and vice versa), we also divided the respondents into four groups according to combinations of high
and low scores on the overcommitment scale and the
effort-reward scale, respectively. This resulted in four
groups of employees: Relaxed employees, Struggling employees, Exaggerated employees, and Despaired employees.
Relaxed employees are nonovercommitted employees that
receive sufficient reward when effort is taken into consideration. Struggling employees are employees that are not
overcommitted, but experience an imbalance in effort
compared with reward. Exaggerated employees are overcommitted employees working in an environment where
effort is reciprocated with reward. Despaired employees are
overcommitted employees subjected to a working environment where their effort in work is not matched by the
reward they receive. We would expect to find despaired
employees to have more unfavorable scores on the healthrelated variables compared with others. Further, we
expected to find favorable health scores among relaxed
employees. We were also interested in the groups whose
scores on the overcommitment and the effort-reward
scales are supposed to have opposing effects on health
(that is, struggling employees and exaggerated employees).
Methods
All employees in a middle-sized municipality in Norway
were invited to participate in a study of their psychosocial
workplace environment. The research design was based
on a web-based questionnaire. Researchers at the
National Institute of Occupational Health received a list
of all the employees in this municipality. In order to generate identification numbers and "Subject Access Codes" for
the web-based questionnaire, the list contained names,
gender, age, social security number, department worked
in, and the International Standard Classification of Occu-
Page 2 of 11
(page number not for citation purposes)
Journal of Occupational Medicine and Toxicology 2008, 3:9
/>
pations (ISCO-88). All employees were sent a personal
written invitation to participate in the research project
through the internal mail at their workplace. The invitation consisted of general information regarding the purpose of the study, and their personal access code to the
web-based questionnaire. The data were collected within
a three-week period in the spring of 2007.
Participants
Of the 2712 employees working in the municipality, 1803
participated, giving a response rate of 66.5%. As can be
seen in Table 1, the response rate among younger employees was lower than in other age groups, the response rate
among employees working in the department of administration was higher than in other departments, and
response rate differed across different occupational
groups.
Measurements
Occupation groups
Based on the ISCO-88 codes, four categories of employees
were distinguished: 1) low-skilled blue-collar workers
(ISCO codes 8 and 9), mainly helpers and cleaners in
offices and other establishments; 2) high-skilled blue-collar workers (ISCO codes 6 and 7), including road workers,
construction workers, and landscape gardeners; 3) lowskilled white-collar workers (ISCO codes 4 and 5), including nursing and care assistants, child-care workers, home
helpers, and secretaries; and 4) high-skilled white-collar
workers (ISCO codes 1, 2, and 3), including primary education teaching-associated professionals, nurses, social
workers, and production and operations department
managers in education, health, and social security. Partic-
ipation levels, according to these categories, are shown in
Table 1.
Effort-reward imbalance model
The standardized self-administrated questionnaire for
measuring the ERI (ERI-Q) [1] was translated from English into Norwegian by a back-translation process. Five
items measured effort, while reward was measured with
three components: esteem (five questions), job promotion (four questions), and job security (two questions).
All items are shown in Figure 1, and Table 2. Items on the
effort scale were answered in two steps. First, subjects
agreed or disagreed on whether the item content
described a typical experience of their work situation.
Those who agreed that it was typical were asked to evaluate the extent to which these conditions produce strain,
using a four-point rating scale. The final options were: 1 =
"does not apply"; 2 = "does apply, but not strained"; 3 =
"does apply and somewhat strained"; 4 = "does apply and
strained"; and 5 = "does apply and very strained". The 11
items measuring reward were framed similarly, although
the coding was reversed, so that the lower the summary
scores for reward, the higher the subjective ratings of distress due to low reward.
The ratio of effort (numerator) and reward (denominator)
quantifies the amount of ERI, as the ERI increases with
increasing values of the ratio. The effort-reward ratio was
calculated as follows: effort/reward × correction factor
(factor correcting for the difference in the numbers of
items of the two scales). More details of the psychometric
properties of these scales are provided in the Results section.
Table 1: Description of the sample
Invited
Total
Gender
Age
Department
Occupation groups
Men
Women
-29
30–39
40–49
50–59
60Health and Social
Culture and Leisure
Administration
School and Kindergarten
Technical
Low-skilled blue-collar workers
High-skilled blue-collar workers
Low-skilled white-collar workers
High-skilled white-collar workers
Participated frequency
Participated percent
2712
560
2150
152
570
781
826
381
1184
106
78
1031
301
135
77
1093
1405
1803
368
1433
87
350
540
573
251
773
68
69
688
193
68
43
678
1012
66.5
65.7
66.7
57.2
61.4
69.1
69.4
65.9
65.3
64.2
88.5
66.7
64.1
50.4
55.8
62.0
72.0
χ2
0.2
18.1**
24.7***
48.7***
Note: * p < 0.05, ** p < 0.01, *** p < 0.001
Page 3 of 11
(page number not for citation purposes)
Journal of Occupational Medicine and Toxicology 2008, 3:9
/>
Factorial
structure
e101
1
ERI_7
1
1
ERI_8
1
E I_2
R
E
ffort
E I_3
R
E I_4
R
E I_5
R
1
1
1
1
1
e1
e2
e102
1
e3
e4
Reward
1
ERI_11
ERI_14
Job
promotion
ERI_16
e5
ERI_17
e103
E10
0
1
ERI_15
1
e8
1
ERI_10
E I_1
R
E8
1
ERI_9
Esteem
E7
1
1
e11
1
OC1
e15
1
Overcomm ent
itm
e14
1
e18
1
1
OC4
OC6
e17
e17
1
OC3
OC5
e16
1
OC2
1
1
e19
e20
e21
1
e22
1
1
Job
security
ERI_12
1
ERI_13
Cronbach’s α
AGFI
Standardized
RMR
Loading (λ)a
1st order CFA
0.72
0.99
0.04
e12
1
e13
2nd order CFA
1st order CFA
0.79
0.99
0.03
0.99
0.03
0.72; 0.60; 0.46; 0.47; 0.65
Esteem: 0.69; 0.47; 0.62; 0.56; 0.83
Job promotion: 0.66; 0.53; 0.75; 0.41
Job insecurity: 0.53; 0.39
Reward: 0.79; 0.85; 0.82
0.48; 0.69; 0.60; 0.53; 0.83; 0.63
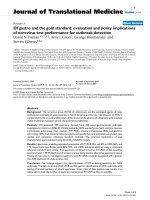
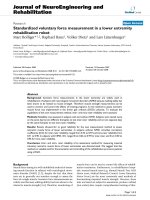
Figure 1structure and goodness of fit measures of the three components of the ERI model
Factorial
Factorial structure and goodness of fit measures of the three components of the ERI model.
Overcommitment at work (OC) was measured with the
short form of the Intrinsic Effort Scale [1]. Five items focus
on the "inability to withdraw from work" and one item
focuses on "disproportionate irritability." On a four-point
rating scale (1 = strongly disagree, 2 = disagree, 3 = agree,
4 = strongly agree) the participants answered the related
questions, which are reported in Figure 1. More details of
this scale's psychometric properties are provided in the
Results section.
Table 2: All items of the different scales in the Effort-Reward Questionnaire (ERI-Q).
"Effort" scale
"Reward" scale
"Overcommitment" scale
Time pressure (ERI_1)
Interruptions (ERI_2)
Responsibility (ERI_3)
Pressure to work overtime (ERI_4)
Increasing demands (ERI_5)
Component esteem
Respect from superiors (ERI_7)
Respect from colleagues (ERI_8)
Adequate support (ERI_9)
Unfair treatment (ERI_10)
Respect and prestige at work (ERI_15)
Component job promotion
Job promotion prospects (ERI_11)
Adequate position (ERI_14)
Adequate work prospects (ERI_16)
Adequate salary/income (ERI_17)
Component job security
Undesirable change (ERI_12)
Job security (ERI_13)
Overwhelmed by pressure (OC1)
Think about work (OC2)
Relax and "switch off" work (OC3)
Sacrifice too much for job (OC4)
Work still on mind (OC5)
Trouble sleeping at night (OC6)
Page 4 of 11
(page number not for citation purposes)
Journal of Occupational Medicine and Toxicology 2008, 3:9
Self-reported poor health
In order to measure overall individual health, the question "How is your health in general?" was asked, with the
following response categories: 1 = excellent, 2 = very good,
3 = good, 4 = rather good, and 5 = poor. This categorical
variable has been shown to be a very good predictor variable of other outcomes, such as subsequent use of medical
care or of mortality (see, e.g., Idler and Benyamini [22]).
In logistic regression analyses, a dichotomized version of
this question was used. The response categories four and
five were combined to indicate poor self-rated health, giving a total of 10.9% with self-reported poor health.
Musculoskeletal complaints
Musculoskeletal complaints were measured with the
"musculoskeletal pain" scale from the Subjective Health
Complaint Inventory [23]. This scale measures the extent
to which respondents had been affected by pain in the
neck, upper back, lower back, arms, feet, shoulders, or
migraine during the last month. Response categories were:
0 = not at all, 1 = a little, 2 = some, and 3 = serious. A principal component analysis with a varimax rotation confirmed a one-factor solution of the scale. Cronbach's
alpha was found to be 0.81. In logistic regression analyses,
a dichotomized version of scale was used. Values above
one (24.1% of the respondents) were taken to indicate
musculoskeletal complaints.
Psychological distress
Psychological distress (anxiety and depression symptoms)
during the previous 14 days was assessed with the SCL-5,
a shortened version of the Hopkins Symptom Checklist25 [24]. The SCL-5 consists of five questions (feeling fearful, feeling hopeless about the future, nervousness or
shakiness inside, feeling blue, worrying too much about
things), each with four answer options: 1 = not at all, 2 =
a little, 3 = quite a bit, and 4 = extremely. The index was
scored as the mean of the item scores. The SCL-5 index
has, in different studies, been shown to correlate strongly
(r > .90) with the SCL-25 index [24,25], which is a valid
measure of psychological distress [26,27]. In our data, a
principal component analysis with a varimax rotation
confirmed a one-factor solution of the scale. Cronbach's
alpha was 0.84. In logistic regression analyses, a dichotomized version of this scale was used. The cut-off point
was set at the value of two [24,25], giving a total of 6.8%
of cases.
Work-related burnout
Burnout was measured with the work-related burnout
scale from the Copenhagen Burnout Inventory [28]. This
scale consists of seven items on exhaustion, attributed to
work in general. The questions are: Is your work emotionally exhausting?, Do you feel burnt out because of your
work?, Does your work frustrate you?, Do you feel worn
/>
out at the end of the working day?, Are you exhausted in
the morning at the thought of another day at work?, Do
you feel that every working hour is tiring for you?, and Do
you have enough energy for family and friends during leisure time? Response categories for the first three questions
were: to a very high degree, to a high degree, somewhat, to
a low degree, and to a very low degree. Response categories for the last four questions were: always, often, sometimes, seldom, and never/almost never. The score for the
last question was reversed. Scoring was conducted according to the procedure outlined in Kristensen et al. [28]: To
a very high degree or always = 100, to a high degree or
often = 75, somewhat or sometimes = 50, to a low degree
or seldom = 25, and to a very low degree or never/almost
never = 0. The total score on the scale is the average of the
scores on the items. A principal component analysis with
a varimax rotation confirmed a one-factor solution of the
scale. Cronbach's alpha was 0.85. In logistic regression
analyses, a dichotomized version of this scale was used.
The cut-off point was set at the value of 50, giving a total
of 13.6% of cases.
Statistics
Psychometric properties of the ERI-Q (internal consistency, factorial structure) were tested by calculating Cronbach's alpha and with confirmatory factor analysis,
respectively. Confirmatory factor analyses were estimated
by the unweighted least squares method, which does not
presume multivariate normal distribution.
To test for differences in the mean values of the components in the ERI instrument, according to gender, age,
education, and occupation, a series of General Linear
Models univariate analyses of variance were computed.
Gender, age, education, and occupation were entered
simultaneously as independent variables in separate analyses for the different components of the ERI model. Pairwise comparisons were tested simultaneously with posthoc Sidak tests.
Multivariate logistic regression analyses were performed
to test the ERI hypothesis (that a mismatch between high
effort and low reward is associated with adverse health),
and the overcommitment hypothesis (that a high level of personal commitment is associated with reduced health).
Effort-reward scores higher than one and the upper tertile
scores of overcommitment were defined as high-risk
scores. In these analyses, gender, age, education, and
occupation were controlled for.
Because logistic regression analysis reduces data information quite substantially, linear regression analyses were
also conducted in order to test the ERI hypothesis, the
overcommitment hypothesis and the interaction hypothesis. In order to test the ERI hypothesis and the overcom-
Page 5 of 11
(page number not for citation purposes)
Journal of Occupational Medicine and Toxicology 2008, 3:9
/>
mitment
hypothesis,
effort-reward
ratio
and
overcommitment were entered simultaneously in a series
of regression analyses. The interaction hypothesis was
tested by entering multiplicative terms (effort-reward
ratio*overcommitment) to the models evaluated in the
first step. All independent variables were centered in these
analyses, and they were controlled for gender, age, education, and occupation.
respective limits on all three scales (AGFI > 0.90 and
SRMR < 0.05). Finally, all items measuring the respective
constructs of effort, reward, and overcommitment, with
the exception of the item "My job security is poor", loaded
on the scales to a sufficiently high degree (i.e., > 0.40),
thus supporting the notion of unidimensionality of these
scales. Overall, this information indicates a good model
fit according to established standards.
To test the hypothesis that relatively higher risks of
reduced health are expected in people who are characterized by experiencing failed reciprocity between efforts and
rewards and overcommitment, participants were assigned
to four groups according to their scores on the overcommitment scale and their effort-reward ratio score. These
groups were named relaxed employees (low on overcommitment and low on ERI), struggling employees (low on
overcommitment and high on effort-reward), exaggerated
employees (high on overcommitment and low on effortreward), and despaired employees (high on both overcommitment and effort-reward). Scores above the 90th percentile on the overcommitment scale were characterized as
high, and scores higher than one on the effort-reward
ratio scale were typified as high. The GLM univariate procedure in SPSS was used to test for mean differences in the
health-related variables between these four groups. In
these analyses, gender, age, education, and occupation
were controlled for. Pairwise comparisons were tested
simultaneously with post-hoc Sidak tests, which adjusts
the significance level for multiple comparisons.
As shown in Table 3, the prevalence of persons having
higher scores on the efforts scale compared with the
reward scale (when adjusted for differences in the number
of items on the scales), that is, the ERI ratio, did not significantly differ according to gender, age, education, or
occupation groups. However, some differences were
found on the different components of the ERI model. The
youngest employees were more likely to have low effort
values compared with employees in their fifties. Highskilled white-collar workers reported higher scores on the
effort dimension than all other occupation groups. Highskilled white-collar workers had higher levels of overcommitment than low-skilled blue-collar workers and lowskilled white-collar workers.
Amos 7 was used to compute the confirmatory factor analyses, while all other analyses were conducted with SPSS
version 15.
Ethics and approvals
The data for research purposes was anonymous as all
names and personal ID numbers were omitted. The study
was conducted in accordance with the World Medical
Association Declaration of Helsinki and with permission
from the Data Inspectorate of Norway.
Results
Figure 1 describes the psychometric properties of the
instrument used to measure the effort-reward and overcommitment factors. All Cronbach's alpha values were
satisfactory (alpha > 0.70) with α 0.72 on the "effort"
scale, α 0.78 on the "reward" scale, and α 0.76 on the
"overcommitment" scale. According to this, item
responses obtained for each scale highly correlate with
each other, indicating high internal consistency.
With respect to the confirmatory factor analyses, the
Adjusted Goodness of Fit Index (AGFI) and the Standardized Root Mean Square Residual (SRMR) were within
As can be seen in Table 4, the effort-reward ratio was associated with all the health-related variables in logistic
regression analyses. The strongest associations were found
with work-related burnout (OR: 7.1; 95% CI: 4.4–11.3)
and psychological distress (OR: 4.3; 95% CI: 2.5–7.5).
Weaker associations were found with musculoskeletal
complaints (OR: 2.9; 95% CI: 1.8–4.7) and self-rated
poor health (OR: 1.8; 95% CI: 1.0–3.1).
Overcommitment was also associated with all the healthrelated variables. Again, the strongest associations were
found with work-related burnout (OR: 5.4; 95% CI: 3.7–
7.8) and psychological distress (OR: 4.7; 95% CI: 3.0–
7.3), and weaker associations with musculoskeletal complaints (OR: 1.8; 95% CI: 1.3–2.7) and self-rated poor
health (OR: 2.3; 95% CI: 1.5–3.6).
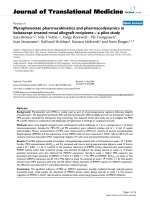
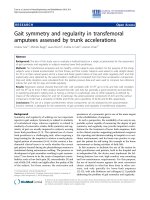
As shown in Table 5, the ERI hypothesis and the overcommitment hypotheses were also supported in the linear
regression analyses. An interaction effect between effortreward and overcommitment was only marginally supported with one percent additional variance explained of
self-reported poor health and work-related burnout,
respectively. That the interaction terms were significant in
these analyses means that the slopes of the regression
lines of the health variables on effort-reward ratio depend
on the level of overcommitment. Simple slopes of selfreported poor health and work related burnout, respectively on effort-reward ratio at different levels of overcommitment (1 SD below the mean, and 1 SD above the
mean) are shown in Figure 2 and Figure 3. The regression
Page 6 of 11
(page number not for citation purposes)
Journal of Occupational Medicine and Toxicology 2008, 3:9
/>
Table 3: Descriptive statistics of the components in the Effort-reward model. Estimated mean and standard error (SE) of Effort,
Reward, Overcommitment, and ERI ratio according to gender, age, education, and occupation group.
Effort
Total
Gender
Age
Education
Occupation
groups
Men
Women
-29
30–39
40–49
50–59
60Comprehensive
school
Secondary/
vocational school
College degree
Higher university
degree
Low-skilled bluecollar
High-skilled bluecollar
Low-skilled whitecollar
High-skilled whitecollar
Estimated
mean
11.7
11.1
10.8
10.2a
10.8
11.3
11.6a
10.9
10.7
Reward
SE
4.2
0.3
0.3
0.5
0.3
0.3
0.3
0.3
0.4
Estimated
mean
47.8
47.5
48.3
47.9
48.0
47.7
47.3
48.5
48.7
10.5
0.3
11.0
11.7
Overcommitment
SE
6.5
0.5
0.4
0.8
0.5
0.4
0.4
0.5
0.6
Estimated
mean
12.1
11.6
11.8
11.9
11.8
11.5
11.9
11.4
11.5
47.4
0.4
0.3
0.4
47.6
47.8
10.7a
0.6
9.9b
ERI
SE
3.4
0.2
0.2
0.4
0.3
0.2
0.2
0.3
0.3
Estimated
mean
0.6
0.5
0.5
0.5
0.5
0.5
0.6
0.5
0.5
SE
0.3
0.0
0.0
0.0
0.0
0.0
0.0
0.0
0.0
Percent with high
score (> 1)
5.4 (n = 96)
6.6 (n = 24)
5.2 (n = 72)
3.6 (n = 3)
4.1 (n = 14)
5.3 (n = 28)
6.8 (n = 38)
5.3 (n = 13)
3.8 (n = 5)
11.6
0.2
0.5
0.0
5.8 (n = 39)
0.5
0.7
11.9
11.9
0.3
0.4
0.5
0.6
0.0
0.0
5.6 (n = 45)
4.6 (n = 7)
48.0
0.9
11.1a
0.5
0.5
0.0
4.8 (n = 3)
0.7
47.9
1.0
11.6
0.5
0.5
0.0
0 (n = 0)
10.9c
0.3
47.3
0.4
11.6b
0.2
0.5
0.0
5.6 (n = 37)
12.3abc
0.2
48.4
0.4
12.5ab
0.2
0.6
0.0
χ2
5.6 (n = 56)
1.2
3.7
1.0
2.6
Note: Values with same letter are significantly different at the 0.05 level.
lines in these figures indicate that the dependence of these
health scores on effort-reward ratio changed as a function
of the level of overcommitment. However, the interactions were not in the predicted direction. As indicated in
both Figure 2 and Figure 3, an increase in effort-reward
ratio was associated with a smaller increase in both predicted self-reported poor health and work related burnout
among employees with high scores on overcommitment
compared to employees with low scores on overcommitment. However, as also indicated in these figures, the
highest disadvantageous health scores were found among
overcommited employees with high scores on effortreward ratio.
As shown in Table 6, relaxed employees reported better
mental health, less work-related burnout, and fewer musculoskeletal complaints than all the other groups. They
also reported better general health than strugglers and
exaggerators. Struggling employees reported poorer general health, more musculoskeletal complaints, poorer
mental health problems, and more work-related burnout,
compared with relaxed employees. However, they had
better mental health and less work-related burnout than
Table 4: Effort-reward ratio, overcommitment and self reported health. Effort-reward ratio and overcommitment entered
simultaneously in adjusted logistic regression analyses (adjusted for gender, age, education, and occupation) to predict self-rated poor
health, musculoskeletal complaints, psychological distress, and work-related burnout
Self-rated poor health
Musculoskeletal complaints
Psychological distress
Work-related burnout
OR
Effort-reward ratio
≤1
>1
Overcommitment
Low*
High*
95% CI
OR
95% CI
OR
95% CI
OR
95% CI
1
1.8
1.0–3.1
1
2.9
1.8–4.7
1
4.3
2.5–7.5
1
7.1
4.4–11.3
1
2.3
1.5–3.6
1
1.8
1.3–2.7
1
4.7
3.0–7.3
1
5.4
3.7–7.8
* Cut-off point set at the 90th percentile.
Page 7 of 11
(page number not for citation purposes)
Journal of Occupational Medicine and Toxicology 2008, 3:9
/>
Table 5: Linear regression models predicting self-reported health measures by effort-reward ratio, overcommitment and the
interaction between effort-reward ratio and overcommitment (adjusted for gender, age, education, and occupation)
β
Step
1
2
Effort-reward ratio
Overcommitment
Effort-reward ratio*
Overcommitment
.14*
.17*
-.09*
Self-rated poor health
Adj R2
Adj R2
Change
.09*
.10*
.05*
.01*
Musculoskeletal complaints
Adj R2
β
Adj R2
Change
.25*
.13*
-.04
.15*
.15*
.10*
.00
β
.19*
.32*
.06
Psychological distress
Adj R2
Adj R2
Change
.
.21*
.21*
.21*
.00
β
Work-related burnout
Adj R2
Adj R2
Change
.45*
.37*
-.10*
.43*
.44*
.43*
.01*
Note: * p < 0.01
the despaired. Exaggerated employees reported poorer
general health, and more musculoskeletal complaints,
mental health problems, and work-related burnout, than
relaxed employees. On the other hand, they had fewer
musculoskeletal complaints, better mental health, and
less work-related burnout than the despaired. Despaired
employees reported more mental problems and workrelated burnout than all the other groups. They also had
more musculoskeletal complaints than the relaxed and
exaggerated, but not the strugglers. However, in spite of
these complaints they did not perceive their health as
worse than the other groups.
Discussion
This is the first study to investigate the psychometric properties of a Norwegian version of the ERI-Q. Satisfactory
psychometric properties were found for most of the latent
factors in this instrument when used on employees in a
medium-sized Norwegian municipality. However, the
item "My job security is poor" loaded weakly on the
dimension "job security". This might reflect that job security is high among the respondents in this study due to
permanent employment and little tradition for dismissal
for economic reasons in the public sector in Norway. Consequently, a latent factor measuring poor job security
Self-reported poor health
5
4
3
2,74
2,86
2,7
2,3
Low OC
(-1 SD)
High OC
(+1 SD)
2
1
Low ERI (-1 SD)
High ERI (+1 SD)
(one SD2
on effort-rewardthe interaction forlevels of the mean) health
Simple slopes ofthe mean different SD aboveovercommitment
Figure below ratio at and one self-reported poor
Simple slopes of the interaction for self-reported poor health
on effort-reward ratio at different levels of overcommitment
(one SD below the mean and one SD above the mean).
among respondents employed in a municipality will not
necessarily be connected to either a perception or expectation of experiencing undesirable change in the work situation ("I have experienced or I expect to experience an
undesirable change in my work situation") or a perception of poor job security. However, such a latent factor
would be more likely to consist of these two items in a private sector working population.
In this study, 5.4% of the participants had higher mean
scores on the effort factor than the reward factor, indicating an ERI. Most typically, employees with lower socioeconomic positions report higher ERI at work [29].
However, this was not supported in our study. Both the
ERI ratio and the continuous ERI score were alike, according to gender, age, education, and occupational groups.
On the other hand, in line with other studies, we found
high-skilled white-collar workers to have the highest score
on the effort scale [1]. This might indicate that employees
in this group are in positions where they are expected to
achieve on a high level. However, high efforts in this
group might also be confounded by an active life orientation [30] that predisposes them to both aspire for higher
positions and to make more effort at work. The finding
that this group also had the highest score on the overcommitment factor gives some support to such a notion.
In contrast to other studies [1], we found a tendency
toward higher reported levels of effort with increased age;
the difference between employees in their fifties and
employees in their twenties was significant. This indicates
that perceived strain associated with work increases with
age, and may reflect that employees in their fifties are
expected to perform the same amount of work as their
younger colleagues.
Both the ERI hypothesis and the overcommitment
hypothesis were supported in the multivariate logistic
regression analyses and in the linear regression analyses in
this study. However, these findings need to be replicated
in prospective studies to indicate causal relationships.
With self-reported poor health and work related burnout
as the outcome variables, effort-reward ratio showed a sig-
Page 8 of 11
(page number not for citation purposes)
Journal of Occupational Medicine and Toxicology 2008, 3:9
/>
hypothesis that relaxed employees would have more favorable health scores was also supported.
47,7
45
Burnout
38,1
35
35,3
Low OC
(-1 SD)
High OC
(+1 SD)
25
20,1
15
Low ERI (-1 SD)
High ERI (+1 SD)
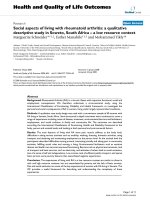
(one SD3
effort-reward ratio at different levels above the mean)
Simple slopes of themean and one SD of overcommitment on
Figure below the interaction for work related burnout
Simple slopes of the interaction for work related burnout on
effort-reward ratio at different levels of overcommitment
(one SD below the mean and one SD above the mean).
nificant but weak interaction with overcommitment in
separate linear regression analyses. However, these interactive effects accounted for only an additional 1% of the
variance in both health scores. Furthermore, in both cases
moderator analyses showed that effort-reward ratio interacted with overcommitment in the opposite direction
than expected. That is, the associations between effortreward ratio and these health variables were weaker
among employees with high scores on overcommitment
compared to employees with low scores on overcommitment. Consequently, the interaction hypothesis was not
supported in the linear regression analyses.
However, when assigning employees to different groups
according to their scores on the effort-reward and overcommitment scales, we found, as expected, despaired
employees to have more unfavorable health scores than
others. This finding supports the interaction hypothesis,
which states that the combination of overcommitment
and high effort-reward score is especially detrimental. The
Employees with scores on the overcommitment and the
effort-reward scales that are supposed to have opposite
effects on health (that is, the combination of low overcommitment with a high effort-reward score and vice
versa), had health scores somewhere in between the two
other groups. In line with the results from the logistic
regression analyses and the linear regression analyses,
these results showed that both high effort-reward and
overcommitment are independently associated with
adverse health scores.
Categorizing respondents into these groups complemented existing knowledge about the effects of these factors by giving a graphic, comprehensive, and
differentiated understanding about possible health effects
based on the individuals' experience of their working
environment and excessive motivation to work. In addition, such a group division can be of practical importance
when choosing occupational intervention to reduce
health complaints based on occupational stress. Strugglers will possibly profit from most of the interventions
that make the working environment less strenuous or
more rewarding in terms of recognition, job security, or
career opportunity. Exaggerators, on the other hand,
would probably benefit more from individual counseling
aimed at reducing their overcommitment. The despaired
would probably benefit most from a combination of both
intervention forms.
However, there are some disadvantages to splitting up
these groups. Using combinations of high versus low
scores on the effort-reward and overcommitment scales,
respectively, may simplify interpersonal variability by
reducing the individuals' positions on continuous scales
to merely two possibilities each, thereby disregarding
small but important differences. Converting interval
scales to ordinal scales also reduces the predictive power.
Table 6: Health related variables according to combinations of overcommitment and effort-reward ratio. Estimated mean and
standard error (SE) of health-related variables according to combinations of Overcommitment (OC) and Effort-reward imbalance
ratio (ERI ratio), controlled for gender, age, education, and occupation groups.
Relaxed employees
Exaggerated employees
Despaired employees
Low OC Low ERI
Self-rated poor health
Musculoskeletal complaints
Mental problems
Work-related burnout
Struggling employees
Low OC High ERI
High OC Low ERI
High OC High ERI
N = 1524
Mean
2.39ab
0.67abc
1.30abc
29.13abc
SE
0.06
0.04
0.03
0.93
N = 55
Mean
2.77a
1.12a
1.75ad
49.32ad
SE
0.14
0.09
0.06
2.23
N = 136
Mean
2.76b
0.95bd
1.72be
46.88be
SE
0.09
0.06
0.04
1.55
N = 40
Mean
2.53
1.32cd
2.09cde
60.35cde
SE
0.16
0.10
0.07
2.56
Note: Values with same letter are significantly different at the 0.01 level.
Page 9 of 11
(page number not for citation purposes)
Journal of Occupational Medicine and Toxicology 2008, 3:9
However, this is first and foremost a problem when using
the groups, based on the effort-reward and overcommitment scores together with other variables, to predict an
outcome. In such instances, the explained variance of the
effort-reward and overcommitment combinations will be
less than if the dimensions were used as interval scales.
/>
Authors' contributions
BL was involved in conception and design, acquisition,
analysis and interpretation of data and writing of the
manuscript.
References
1.
Limitations and strengths of the study
This study relied on a large survey with a reasonable
response rate. Although the sample size was large, the
present data were female-dominated and from the public
sector. Therefore, the findings should be interpreted with
caution until they are validated in studies using other
samples. The study was based on a cross-sectional design;
therefore, we do not claim that the observed associations
are evidence of a causal relationship. Although high ERI
may lead to an increased likelihood of the co-occurrence
of unfavorable health, such unsatisfactory self-reported
job conditions might also reflect bad health. Poor mental
health or burnout symptoms might contribute to a perception of work conditions as tedious and straining. The
associations between ERI, its components, and co-occurring self-reported health appeared even when confounders such as age, gender, occupational position, and
education were controlled for. However, because individual factors, such as negative affectivity or personality, were
not included in this study, confounding influence from
these factors cannot be excluded.
Conclusion
2.
3.
4.
5.
6.
7.
8.
9.
10.
11.
This is the first study to investigate the psychometric properties of a Norwegian version of the ERI-Q. Satisfactory
psychometric properties were found for most of the latent
factors. When assigning employees to different groups
according to their scores on the effort-reward and overcommitment scales, overcommitted employees with high
effort-reward scores had especially detrimental health
scores, while employees with low scores on both overcommitment and effort-reward had the most favorable
health scores. Employees with scores on the overcommitment and the effort-reward scales that are supposed to
have opposite effects on health (that is, the combination
of low overcommitment with a high effort-reward score
and vice versa), had health scores somewhere in between
the two other groups. Categorizing respondents into these
groups can be of practical importance when choosing
occupational intervention to reduce health complaints
based on occupational stress.
15.
Competing interests
19.
The author declares that they have no competing interests.
12.
13.
14.
16.
17.
18.
20.
Siegrist J, Starke D, Chandola T, Godin I, Marmot M, Niedhammer I,
Peter R: The measurement of effort-reward imbalance at
work: European comparisons.
Soc Sci Med 2004,
58(8):1483-1499.
Siegrist J: Adverse health effects of high-effort/low-reward
conditions. J Occup Health psychol 1996, 1:27-41.
Siegrist J: Reducing social inequalities in health: work-related
strategies. Scand J Public Health Suppl 2002, 59:49-53.
Siegrist J, Peter R: Threat to occupational status control and
cardiovascular risk. Isr J Med Sci 1996, 32(3–4):179-184.
Siegrist J: Effort-reward imbalance at work and health. In
Research in Occupational Stress and Well Being Edited by: Perrewe P,
Ganster D. New York, JAI Elsevier; 2002:261-291.
Bosma H, Peter R, Siegrist J, Marmot M: Two alternative job
stress models and the risk of coronary heart disease. Am J
Public Health 1998, 88(1):68-74.
Niedhammer I, Goldberg M, Leclerc A, David S, Bugel I, Landre MF:
Psychosocial work environment and cardiovascular risk factors in an occupational cohort in France. J Epidemiol Community
Health 1998, 52(2):93-100.
Peter R, Alfredsson L, Knutsson A, Siegrist J, Westerholm P: Does a
stressful psychosocial work environment mediate the effects
of shift work on cardiovascular risk factors? Scand J Work Environ Health 1999, 25(4):376-381.
Peter R, Siegrist J: Psychosocial work environment and the risk
of coronary heart disease. Int Arch Occup Environ Health 2000,
73(Suppl):S41-45.
Siegrist J, Peter R, Junge A, Cremer P, Seidel D: Low status control,
high effort at work and ischemic heart disease: Prospective
evidence from blue-collar men.
Soc Sci Med 1990,
31(10):1127-1134.
van Vegchel N, de Jonge J, Bosma H, Schaufeli W: Reviewing the
effort-reward imbalance model: Drawing up the balance of
45 empirical studies. Soc Sci Med 2004, 60(5):1117-1131.
Tsutsumi A, Kawakami N: A review of empirical studies on the
model of effort-reward imbalance at work: reducing occupational stress by implementing a new theory. Soc Sci Med 2004,
59(11):2335-2359.
Godin I, Kittel F: Differential economic stability and psychosocial stress at work: Associations with psychosomatic complaints and absenteeism. Soc Sci Med 2004, 58(8):1543-1553.
Niedhammer I, Tek ML, Starke D, Siegrist J: Effort-reward imbalance model and self reported health: Cross-sectional and
prospective findings from the GAZEL cohort. Soc Sci Med
2004, 58(8):1531-1541.
Pikhart H, Bobak M, Siegrist J, Pajak A, Rywik S, Kyshegyi J, Gostautas
A, Skodova Z, Marmot M: Psychosocial work characteristics and
self rated health in four post-communist countries. J Epidemiol
Community Health 2001, 55(9):624-630.
Stansfeld SA, Bosma H, Hemingway H, Marmot MG: Psychosocial
work characteristics and social support as predictors of SF36 health functioning: The Whitehall II study. Psychosom Med
1998, 60(3):247-255.
de Jonge J, Bosma H, Peter R, Siegrist J: Job strain, effort-reward
imbalance and employee well-being: A large-scale cross-sectional study. Soc Sci Med 2000, 50(9):1317-1327.
Pikhart H, Bobak M, Pajak A, Malyutina S, Kubinova R, Topor R, Sebakova H, Nikitin Y, Marmot M: Psychosocial factors at work and
depression in three countries of Central and Eastern Europe.
Soc Sci Med 2004, 58(8):1475-1482.
Tsutsumi A, Kayaba K, Theorell T, Siegrist J: Association between
job stress and depression among Japanese employees threatened by job loss in a comparison between two complementary job-stress models. Scand J Work Environ Health 2001,
27(2):146-153.
Joksimovic L, Starke D, van der Knesebeck O, Siegrist J: Perceived
work stress, overcommitment, and self-reported muscu-
Page 10 of 11
(page number not for citation purposes)
Journal of Occupational Medicine and Toxicology 2008, 3:9
21.
22.
23.
24.
25.
26.
27.
28.
29.
30.
/>
loskeletal pain: A cross-sectional investigation. Int J Behav Med
2002, 9(2):122-138.
van Vegchel N, de Jonge J, Meijer T, Hamers JP: Different effort
constructs and effort reward imbalance: Effects on
employee well-being in ancillary health care workers. J Adv
Nurs 2001, 34(1):128-136.
Idler EL, Benyamini Y: Self-rated health and mortality: A review
of twenty-seven community studies. J Health Soc Behav 1997,
38(1):21-37.
Eriksen HR, Ihlebæk C, Ursin H: A scoring system for subjective
health complaints (SHC). Scand J Public Health 1999, 27:63-72.
Strand BH, Dalgard OS, Tambs K, Rognerud M: Measuring the
mental health status of the Norwegian population: A comparison of the instruments SCL-25, SCL-10, SCL-5 and MHI5 (SF-36). Nord J Psychiatry 2003, 57:113-118.
Tambs K, Moum T: How well can a few questionnaire items
indicate anxiety and depression? Acta Psychiatr Scand 1993,
87:364-367.
Glass RM, Allan AT, Uhlenhuth EH, Kimball CP, Borinstein DI: Psychiatric screening in a medical clinic. Arch Gen Psychiatry 1978,
35:1189-1195.
Rickels K, Garcia C-R, Lipman RS, Derogatis LR, Fisher EL: The Hopkins Symptom Checklist. Assessing emotional distress in
obstetric-gynecological practice. Primary Care 1976, 3:751-764.
Kristensen TS, Borritz M, Villadsen E, Christensen KB: The Copenhagen Burnout Inventory: A new tool for the assessment of
burnout. Work Stress 2005, 19:192-207.
Siegrist J, Marmot M: Health inequalities and the psychosocial
environment–two scientific challenges. Soc Sci Med 2004,
58:1463-1473.
Kouvonen A, Kivimäki M, Virtanen M, Heponiemi T, Elovainio M,
Pentti J, Linna A, Vahtera J: Effort-reward imbalance at work and
the co-occurrence of lifestyle risk factors: cross-sectional
survey in a sample of 36,127 public sector employees. BMC
Public Health 2006, 6:24. doi:10.1186/1471-2458-6-24
Publish with Bio Med Central and every
scientist can read your work free of charge
"BioMed Central will be the most significant development for
disseminating the results of biomedical researc h in our lifetime."
Sir Paul Nurse, Cancer Research UK
Your research papers will be:
available free of charge to the entire biomedical community
peer reviewed and published immediately upon acceptance
cited in PubMed and archived on PubMed Central
yours — you keep the copyright
BioMedcentral
Submit your manuscript here:
/>
Page 11 of 11
(page number not for citation purposes)