báo cáo hóa học: " Biomarkers of oxidative stress and its association with the urinary reducing capacity in bus maintenance workers" pptx
Bạn đang xem bản rút gọn của tài liệu. Xem và tải ngay bản đầy đủ của tài liệu tại đây (516.4 KB, 13 trang )
RESEARCH Open Access
Biomarkers of oxidative stress and its association
with the urinary reducing capacity in bus
maintenance workers
Jean-Jacques Sauvain
1*†
, Ari Setyan
1,4†
, Pascal Wild
1
, Philippe Tacchini
2
, Grégoire Lagger
2
, Ferdinand Storti
1
,
Simon Deslarzes
1
, Michel Guillemin
1
, Michel J Rossi
3
and Michael Riediker
1
Abstract
Background: Exposure to pa rticles (PM) induces adverse health effects (cancer, cardiovascular and pulmonary
diseases). A key-role in these adverse effects seems to be played by oxidative stress, which is an excess of reactive
oxygen species relative to the amount of reducing species (including antioxidants), the first line of defense against
reactive oxygen species. The aim of this study was to document the oxidative stress caused by exposure to
respirable particles in vivo, and to test whether exposed workers presented changes in their urinary levels for
reducing species.
Methods: Bus depot workers (n = 32) exposed to particles and pollutants (respirable PM
4
, organic and elemental
carbon, particulate metal content, polycycli c aromatic hydrocarbons, NO
x
,O
3
) were surveyed over two consecutive
days. We collected urine samples before and after each shift, and quantified an oxidative stress biomarker (8-
hydroxy-2’-deoxyguanosine), the reducing capacity and a biomarker of PAH exposure (1-hydr oxypyrene). We used a
linear mixed model to test for associations between the oxidative stress status of the workers and their particle
exposure as well as with their urinary level of reducing species.
Results: Workers were exposed to low levels of respirable PM
4
(range 25-71 μg/m
3
). However, urinary levels of 8-
hydroxy-2’-deoxyguanosine increased significantly within each shift and between both days for non-smo kers. The
between-day increase was significantly correlated (p < 0.001) with the concentrations of organic carbon, NO
x
, and
the particulate copper content. The within-shift increase in 8OHdG was highly correlated to an increase of the
urinary reducing capacity (Spearman r = 0.59, p < 0.0001).
Conclusions: These findings confirm that exposure to components associated to respirable particulate matter
causes a systemic oxidative stress, as me asured with the urinary 8OHdG. The strong association observed between
urinary 8OHdG with the reducing capacity is suggestive of protective or other mechanisms, including circadian
effects. Additional investigations should be performed to understand these observations.
Background
Epidemiological studies have demonstrated that
incr eased levels of airborne particles are associated with
adverse health effects, such as cancer, cardiovascular
and pulmonary diseases [1]. Among the different
mechanisms proposed to explain these adverse effects,
the production of reactive oxygen species (ROS) and the
generation of oxidative stress have received mo st of the
attention. ROS include both oxygenate d radicals and
certain closed shell species that are oxidizing agents.
Under normal coupling conditions in the mitochon-
drion, ROS are generated at low frequency and are
easily neutralized by antioxidant defenses. However, in
thepresenceofoxidants,suchasfollowingexposureto
particles, the natural antioxidant defenses may be over-
whelmed [2]. Oxidative stress refers to an imbala nce
between pro-oxidant and antioxidant in favor of the for-
mer, leading to potential damage. The biological effect
* Correspondence:
† Contributed equally
1
Institute for Work and Health, University of Lausanne + Geneva, 21 rue du
Bugnon, CH-1011 Lausanne, Switzerland
Full list of author information is available at the end of the article
Sauvain et al. Journal of Occupational Medicine and Toxicology 2011, 6:18
/>© 2011 Sauvain et al; licensee BioMed Central Ltd. This is an Open Access article distributed under the terms of the Creative Commons
Attribution License ( which permits unr estricted use, distribution, and reproduction in
any medium, provided the original work is properly cited.
of ROS depe nds on its local concentration. When the
local levels are high, they tend to react with biological
structures (DNA, cell membranes and others) leading to
cell damage as well a s the generati on of other reactive
radicals. At lower concentrations, however, some ROS
can become a secondary messenger, modulating the
expression of signaling molecules or proteins (redox sig -
naling function) [3]. In the lungs, rapid build-up of oxi-
dative stress in the thin liquid layer of the alveolar
region has been suggested as a consequence of particle
deposition. It leads to epithelial cell damage and to the
release of pro-inflammatory mediators [4].
Diesel particles are complex objects consist ing of a
soli d carbonaceous core on which many organic, persis-
tent free radicals, inorganic, and metallic compounds
are a dsorbed. Among these, polycyclic aromatic hydro-
carbons (PAHs ) [5] and transit ion metals [6] have been
found to cause oxidative stress. A three-tier hierarchical
cellular response model has been proposed [7] to
explain the role of oxidative stress in mediating its bio-
logical effects. This model suggests that low levels of
oxidative stress induce protective effects (tier-1) by the
activation of antioxidant enzymes. If these responses fail
to provide a dequate protection, then a further increase
in ROS pro duction will result in pro-inflammatory (tier-
2) and cytotoxic (tier-3) effects. Taken together, this
model expands the above described mechanism to
understand how particles generate adverse health effects.
Over the past 15 years, urinary 8-hydroxy-2’-deoxy-
guanosine ( 8OHdG) has been widely used as a biomar-
ker of oxidative DNA damage in air pollutant studies.
Exposure to diesel [8] and fine particles [9-13], PAHs
[14] or metals [9,15-17] were found to significantly
increase urinary levels of 8OHdG. Two recent meta-ana-
lysis proposes urinary 8OHdG to be a suitable biomar-
ker for evaluating the effect of exposure to PM on
humans [18,19]. Such a biomarker would have a predic-
tive value regarding the development of lung cancer
[19]. A steady state pool of oxidized nucleobase s is con-
sidered to be maintained at a cellular level and the urin-
ary excretion of 8OHdG can be considered as a measure
of the whole-body oxidative stress [20-22]. The presence
of 8OHdG in urine seems to originate mostly from the
oxidation of the deoxynucleotide pool [19,23] and does
not represent solely repairing/excretion of the oxidized-
DNA guanine. Once p roduced, 8OHdG is very stable
and is not further metabolized in the systemic circula-
tion [23]. After exposure to oxidants, the repair and
final 8OHdG excretion in urine is rapid, i.e. within at
least 24 hours [19,24,25].
The aims of this study were to test in vivo whether
exposure to particles was associated to oxidative stress
and, as indicator for an adaptive response, if an increase
of the systemic anti-oxidant defenses could also be
detected in urine. For that purpose, we conducted an
occupational field study at three bus depots where we
expected workers to be exposed to high levels of respir-
able particles. We assessed worker’sexposuretorespir-
able particles with aerodynamic diameter smaller than 4
μm(PM
4
), organic carbon (OC), elemental carbon (EC),
three metals (Fe, Cu, Mn) and some particle-bound
PAHs. We als o collecte d spot urine samples to quantify
in it 8OHdG, the global amount of reducing species,
and a biomarker of PA H exposure (1-hydroxypyrene [1-
OHP]). The first tier of the defense mechanism against
oxidative stress [7] was verified by testing the correla-
tion between levels o f 8OHdG, reflecting oxidative
stress, and the reducing capacity (corresponding to a
def ense against oxidative stress) in the urine of the par-
ticle-exposed workers.
Methods
Subjects and study design
Participating workers (n = 32) were recruited in three
bus depots in southwestern Switzerland. The main task
of these workers was the repair and maintenance of
buses. They were exposed to diesel particles as well as
other particles and organic compounds (solvents, diesel
fuels, lubricating oil, cigarette smoke). Stationary and
personal air sampling were conducted in each bus depot
for tw o consecutive days of shift, be tween Monday
morning and Tuesday evening. Workers did n ot work
the two days preceeding the study. This study design
was chosen in order to obtain a large exposure contrast.
For that reason, we followed the workers during day
and night shifts as well as during summer and winter
time. We used a panel study design a) to determine the
temporal changes of urinary biomarkers for the partici-
pating workers during two consecutive days and b) to
use each worker as its own control by considering the
Monday morning as the reference value for all biological
end-points. This design excluded confounding factors
that are stable within an individual over time but vary
between participant s. The study was approved by the
Ethics Committee of the University of Lausanne. Writ-
teninformedconsentwasobtainedpriortostartofthe
study, in addition to questionnaires destined to collect
information on possible confounding factors (cigarette
smoke, eating habits, diseases, medication).
Exposure characterization
The respirable fraction reaching the alveolar region of
the lungs was determined by measurin g PM
4
, the refer-
ence metric for alveolar dust at the workplace [26] (note
that this is different from ambient situations, where
PM
2.5
is considered to be the reference). These concen-
trations were determined either with stationary or per-
sonal sampling devices. The stationary sampling was
Sauvain et al. Journal of Occupational Medicine and Toxicology 2011, 6:18
/>Page 2 of 13
located indoor as close as possible to the worker’s place.
It consisted of two high-volume pumps (Digitel, model
DH 77, 580 L/min with PM
4
impactor), equipped with
passivated 15 cm Whatman QM-A quartz filters as pre -
viously described [27]. The personal pumps, connected
to a cyclone head were run at a flow of 2 L/min during
the entire shift. Plasma pre-treated quartz filters (What-
man QM-A, 37 mm, 2.2 μm pore size) were conditioned
at least 24 hours at constant humidity (60 ± 10%) and
ambient temperature before weighing. After the sam-
pling, filters were conditioned again and weighed. The
limit of detection was 10 μg/m
3
. For comparison, two
personal pumps with the same collection head and fil-
ters were collocated with the stationary high-volume
pumps. All these gravimetric measurement methods
were accredited following the ISO/IEC 17025 norm.
The determina tion of the OC and EC content of parti-
cles was carried out on the same filters used for the PM
4
determination (personal and stationary pumps). The mea-
surement [28] was performed with a Stroehlein Instru-
ment, model 702, and consisted of a coulometric
determination of the CO
2
evolved from a two-stage ther-
mal decomposition of the carbonaceous compounds pre-
sent in the particles. The OC content refers to the amount
of carbon evolved up until 800°C under a stream of nitro-
gen, whereas the EC content is measured by heating the
residue at 800°C under oxygen. The detection limit was 3
μg/m
3
for OC and 2 μg/m
3
for EC. The analytical method
was accredited following the ISO/IEC 17025 norm.
As iron (Fe), copper (Cu) and manganese (Mn) may
be involved in ROS production such as the Fenton reac-
tion, we have determined its levels on the PM
4
samples
collected by the high-volume sampler. Five punches (48
mm diameter) were cut and used for the metal analysis.
The rest of the filter was used for subsequent PAH ana-
lysis. After digestion in hydrogen fluoride followed by a
treatment in aqua regia (HNO
3
:HCl 1:2 v/v) and dilu-
tion in water, the metal content of the resulting solution
was analyzed using an atomic absorption spectrometer
(Perkin Elmer, model HGA 700). Results obtained for
each sample were corrected by subtraction of a blank
filter. The detection limits were 7, 3.5, and 2 ng/m
3
for
Fe, Cu , and Mn, respectively. The analytical method was
accredited following the ISO/IEC 17025 norm.
As workers in this study are exposed to combustion
related compounds, PAH adsorbed on particles were
expected to be present at these working conditions. As
mentioned before, the rest of the high-volume filter was
used for PAH analysis. Six semi-volatile PAH (Benzo[a]
Anthracene, Benzo[b+j]Fluoranthene, Benzo[k]Fluor-
anthene, Benzo[a]Pyrene (B[a]P), Indeno[1,2,3-cd]Pyrene,
Dibenz[a,h]Anthracene) were determined by gas chroma-
tography-mass spectrometry (GC-MS), as described in
reference [29]. The limit of detection for each PAH,
based on three times the noise, was 0.002 ng/m
3
.Asthe
recovery of the selected PAH was higher than 90%, t he
concentrations were not corrected for loss during analy-
sis. The final results were expressed as B[a]P equivalent
(B[a]P
eq
), by using the pote ncy equivalent factor of each
individual compound as previously described [30].
GaseousoxidantslikeNO
2
or NO are present in die-
sel exhaust emissions, whereas O
3
is another common
oxidant gas found in the atmosphere. Direct reading
instru ments were used to monitor the concentrations of
NO
x
(Monitor Labs Inc, model ML 9841A) and ozone
(Moni tor Labs Inc, model ML 9810). These instruments
were located next to the stationary high-v olume sam-
plers. For the calibration of the NO
x
analyzer, we
diluted 40 ppm NO (Carbagas, Gümligen; mixture 40
ppm NO 30, balance N
2
60, 10 L, 150 bar) with air
(Carbagas; controlled air, 30 L, 200 bar) to obtain the
following NO concentrations: 0 (zero air: controlled air
cleaned through two tubes filled with activated charcoal
and a third one filled with silicagel), 250, 500, 750, 1000
ppb. For the calibration of the ozone analyzer, we used
an ozone generator (Horiba Ltd). The calibration was
achieved with the following ozone concentrations: 0
(zero air), 25, 50, 75, 100 ppb. The limit of detection
was 0.5 ppb for the NO
x
as well as for ozone.
Urine sample collection
Spot urine samples of workers were collected before and
after shifts on Monday and Tuesday in pre-cleaned plas-
tic bot tles. Urine samples were stored at 4°C in t he bus
depots and, at the end of the sampling day, were trans-
ferred to storage at -25°C in the dark until analysis. In
such conditions, the 8OHdG and 1-OHP stability are 15
years [23] and at least 6 months [31], respectively.
Measurement of 1-OHP in urine
The analysis of 1-OHP, a metabolite of pyrene, is proposed
as a reliable biomarker of the internal dose for PAH expo-
sure [32]. However, it is not representative of genotoxic
PAH exposure, as pyrene is not a carcinogenic compound
[33]. The urinary 1-OHP was analyzed following an ISO/
EN17025 accredited method. Briefly, the sample was first
digested with glucoronidase at 37°C for at least 2 hours.
The hydrolysate was loaded on a C
18
SPE cartridge, pre-
conditioned with methanol and water. After lavage with 4
mL water and 2 mL hexane, the analyte was eluted with
3.5 mL dichloromethane. The extract was concentrated to
about 200 μL and injected into a HPLC system equipped
with fluorescence detection. The detection limit was 0.01
μg/L. Internal quality control was introduced during each
series and obtained using a doped stock urine, whose
mean concentration was 1.49 ± 0.14 μg/L (n = 27). The
mean value of the internal controls was 1.52 ± 0.05 μg/L
(n = 5).
Sauvain et al. Journal of Occupational Medicine and Toxicology 2011, 6:18
/>Page 3 of 13
Measurement of 8OHdG in urine
The analysis of 8OHdG was performed using liquid
chromatography-tandem mass spectrometry (LC-MS/
MS), preceded by a clean-up procedure with solid phase
extraction (SPE). The analytical method was taken from
a previously published clean-up procedure [34] and
adapted to the conditions of analysis by LC-MS/MS
[35]. Prior to the analyses, the urine samples were
thawed, and 1.5 mL urine was mixed with an equal
volume of bidistilled water. If the urine pH was higher
than 7.0, samples were acidified with 20 μL of HCl 2 M.
BondElut C
18
/OH SPE car tridges (500 mg, 3 mL, Bio-
Pack Switzerland) and were conditioned using 4 mL
methanol and 4 mL bidistilled water, then loaded with 2
ml of diluted urine sam ple, and washed with 4 mL
bidistilled water and 4 mL methanol 5% in bidistilled
water. 8OHdG was eluted with 7 mL methanol 15% in
bidistilled water, and concentrated up to approximately
1 mL in a SpeedVac concentrator (model SVC 100 H,
Savant Instruments Inc.). The final volume was deter-
mined by gravimetry, assuming that the entire methanol
was removed during the conc entration in the SpeedVac
and that the d ensity of the remaining solvent is 1 g/mL.
20 μL of the samples were injected into a LC-MS/MS
system (Varian Inc, model 1200L) equipped with a
Polaris C
18
-A analyt ical column (Varian Inc; length = 50
mm, inner diameter = 2 mm, porosity 5 μm). The para-
meter settings of the LC-MS/MS are given in the Addi-
tional file 1 Table S1. 8 OHdG was identified o n the
chromatograms by the retention time (2.4 min), and
quantified by using an eight-point calibration curve in
the concentration range 0.9-175.2 pg/μL. The detection
limit (based on three times the noise) and the recovery
rate for urine samples were 1.04 ± 0.39 μg/L (3.67 ±
1.39 nM) (n = 5) and 73 ± 12% (n = 5), respectively.
Urinary concentrations of 8OHdG were ratioed to crea -
tinine for normalization, and the results expressed in
terms of μg 8OHdG/g cre atinine. The creatinine con-
centration was determined following the Jaffe method.
In the case of repeated measurement of the same indivi-
dual, there is an acceptable association between the
8OHdG concentration in the creatinine-corrected spot
urine and the 24 hour urine [24]. Thus, the creatinine
correction may be applied in the present case.
Measurement of the reducing capacity in urine
We used a novel redox sensor to measure the levels of
reducing species in the urine samples. This technique is
an electrochemical-based method responding to all
water soluble compounds in biological fluids (saliva,
serum, urine) which can be oxidized within a defined
potential range [36,37]. This assay has been shown to
respond linearly to low molecular weight antioxidants
like ascorbic and uric acid (P. Tacchini, personal
communication). The non-specificity of this assay is an
advantage in the present case, because we primarily
wanted to detect whether a systemic defense mechanism
was taking place after exposure to oxidants like diesel
particles. A minimum volume of 10 μlofsamplewas
loaded onto a chip, and an increasing potential between
0 and +1.2 V (vs Ag/AgCl reference electrode) was
applied between two carbon based printed conductors.
For each compound undergoing an oxidation reaction
within this range of po tential, a proportional contribu-
tion to the current was recorded. Since the potential
was increasing from low to high voltage, only compounds
in their reduced state will be measured using such a
method. Results are expressed in μW/g creatinine. The
factors controlling dilution of a urinary reducing com-
pound will also control the concentrations of normal
constituents of urine, if they are excreted by the same
mechanisms. The electrochemical measurement detects
thepresenceofcompoundslikeuricacidandaclose
association between the 24 hour excretion of creatinine
and uric acid has been reported [38] justifying the creati-
nine normalization in this study. The detection limit was
13 μW/g creatinine. As 8OHdG is also an electro-active
compound, we verified that the levels present in the
urine did not interfere with this measurement.
Statistical analyses
Statistical analyses were performed using Stata 10 ( Col-
lege Station, Tx). Urinary concentrations of 1-OHP,
8OHdG and reducing capacity were log-transformed to
normalize their distribution. The evolution of log(1-
OHP), log(8OHdG) and log(reducing capacity) was ana-
lyzed using a linear mixed model with the subject con-
sidered as a random effect and considering within-day
and between-day differences as main independent
effects. A fixed effect model was also applied to check
the robustness of the results. Adjustments were applied
when statistically significant differences were found for
season, night vs. day shift, body mass index (BMI), self-
declared exposure during the preceding week-end, self-
reported respiratory diseases and current smoking.
Interactions were expl ored between smoking stat us and
the b etween- and within-day differences. Residual plots
allowed the identification of potential outliers, which
were tentatively excluded in subsequent analyses to
assess the robustness of the results.
Results
Description of the studied subjects and sampling sites
The characteristics of the recruited workers, all male
mechanics from three bus depots in Switzerland, are
given in Table 1. Twenty-three workers were non-smo-
kers or former smokers (smoking stopped for an average
of 13 years, minimum of 2 years), and nine were
Sauvain et al. Journal of Occupational Medicine and Toxicology 2011, 6:18
/>Page 4 of 13
smokers. None of the workers was excluded. Eight
workers reported allergies (4 non-smokers and 4 smo-
kers), two heart problems, and nine used medications (5
non-smoker and 4 smokers), including vitamin/mineral
supplements. This i nformation was included in the
mixed models. The different sampling sites were large
yards (between 70-140’ 000 m
3
) used a s vehicle depot
and for mechanical repair and vehicle maintenance (see
Additional file 1 Table S2).
Occupational exposure to particles and pollutants
Table 2 shows the mean stationary and personal con-
centrations of particles and pollutants measured during
the investigated shifts. Stationary PM
4
concentrations
were between 43 and 71 μg/m
3
during daytime, and
between 25 and 32 μg/m
3
during the nighttime shift.
OC concentrations ran ged from 16-35 μg/m
3
and EC
concentrations from 6-16 μg/m
3
.PM
4
and OC were
strongly correlated (r
2
: 0.94; Pearson < 0.001). Metal
concentrations varied strongly across the sampling site.
The sequence of metal concentrations was u sually Fe >
Cu > Mn, except for bus depot 3 in summer, where the
particulate manganese content was higher than that of
copper. B[a]P equiva lent concentrations (B[a]P
eq
) ranged
from 0.17 to 9.56 ng/m
3
.NO
x
levels were between 190
and 920 ppb, and very variable depending on the sam-
pling site. Ozone concentrations were negligibly low, as
expected (range 1 to 13 ppb).
For non-smokers, personal PM
4
and OC air concen-
trations were always higher than the corresponding sta-
tionary air concentrations (Table 2). As expected,
smokers presented higher exposure to PM
4
and OC
compared to non-smokers (Table 2).
Urinary biomarkers of PAH exposure
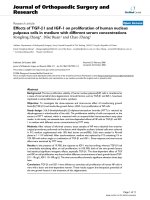
Figure 1(a) shows the urinary 1-OHP levels during the
two consecutive days of work. A clear difference was
observed between non-smokers (0.06 ± 0.04 μmol/mol
creatinine, average value for both days, n = 94) and
smokers (0.19 ± 0.08 μmol/mol creatinine, average value
for both days, n = 31). The linear mixed model (see
Additional file 1 Table S3) confirmed the effect of
smoking (p < 0.001), and identified a seasonal effect (p
= 0.02), and a trend for self-reported exposure during
the week-end (p = 0.08), which could be attributable to
exposure to barbecue activities during the summer. A
significant difference existed for non-smoke rs between
urinary concentrations at the beginning of day 1 and
those at the end of day 2 (p = 0.006).
Urinary levels of 8OHdG
The urinary concentrations of 8OHdG during both
days are shown in Figure 1(b), and the associated sta-
tistics in Table 3. The model was shown not to be
influenced by night shift, B MI, season, whereas current
smoking and self-reported respiratory problems were
partially associated with 8OHdG. Independent of expo-
sure (Model A1 o f Table 3), urinary levels of 8OHdG
were 40% higher for smokers than for non-smokers,
but this difference was not statistically significant (p =
0.175). Statistically significant differences were
observed between beginning and end of shifts (32% dif-
ference, p < 0.001) and between the two days among
non-smokers (40% difference, p < 0.001). No increase
between days w as observed for smokers. P M
4
levels
had no statistical influence on the urinary 8OHdG
levels but this biomarker was significantly influenced
by OC and NO
x
(both with random effect models-
Table 3 and fixed models - Additional file 1 Table S6),
and particulate copper content (only for the random
effect models-Table 3). When these three variables
were fitted simultaneously with the random effect
model, none was found to be significant. Non-para-
metric correlation tests between these three exposure
variables indicated that OC and NO
x
were significantly
correlated. In contrast to the above findings for sta-
tionary exposure variables, the personal exposure to
PM
4
, OC and EC were not significantly correlated to
8OHdG during these two days (see Additional file 1
Table S4 for the random effect models).
Urinary levels of the reducing species
The urinary concentration of reducing species during
the two sampling days is shown in Figure 1(c). As for
8OHdG, the levels of excreted reducing species were
35% higher among smokers (p = 0.08) compared to
non-smokers, and 41% higher for workers with self-
reported respiratory diseases (p = 0.08, see Table 4).
Adjusted for these factors, the level of reducing species
increased by 14% (p = 0.06) within the shifts, although
this increase seemed to be restricted to day 2. Again a
significant overall between-day increase was observed
only among non-smokers (p = 0.002). None of the
air concentrations (stationary - Table 4 and personal
- Additional file 1 Table S5) had any significant asso-
ciation to the within-shift urinary levels of reducing
species. This result indicated that the measured redu-
cing capacity in urine was not direc tly influenced by
the different exposure variables.
Table 1 Characteristics of the studied male workers
All subjects Non-smoker Smoker
Number of workers 32 23 9
Age, year (mean ± SD) 43.1 ± 9.3 43.0 ± 9.0 43.3 ± 10.8
BMI, kg/m
2
(mean ± SD) 25.2 ± 3.6 25.6 ± 3.2 24.2 ± 4.5
Years of employment
(mean ± SD)
11.8 ± 9.2 11.5 ± 9.1 12.7 ± 9.7
Characteristics of the studied male workers.
Sauvain et al. Journal of Occupational Medicine and Toxicology 2011, 6:18
/>Page 5 of 13
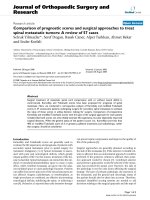
Correlation between urinary 8OHdG and reducing
capacity
A statistically significant correlation (Spearman rho =
0.53, p < 0.0001 ) was observ ed between urinary levels of
log-transformed 8OHdG and reducing capacity for all
workers (smokers and non-smokers, Figure 2(a)).
Further a nalysis revealed that the within-shift variation
of log-transformed 8OHdG concentration was also cor-
related with the within-shift variation of the reducing
species (Spearman r = 0.59, p < 0.0001; Figure 2(b)).
The range of variation for reducing species (-80% to
+1000%) was much greater th an that of 8OHdG (-50%
to +400%). Both of these values indicate that a tight
association i s present between urinary 8OHdG consid-
ered as a marker of oxidative stress and the amount of
excreted reducing species.
Discussion
This study shows that exposure to low concentrations of
PM
4
and related combustion-derived compounds was
associated to an increase in urinary 8OHdG levels dur-
ing two consecutive days in non-smoking male bus
mechanics. This increase in oxidative stress markers was
associated with increased urinary level of water soluble
reducing species.
Thequalityofapanelstudydependsstronglyonthe
exposure characterization [19]. In this work, an impor-
tant effort was spent to characterize it as thoroughly as
possible. The low occupational exposure to PM
4
in the
present study is comparable to two other studies for
similar workplaces [39,40]. We noticed that the PM
4
concentrations were lowe r during night time, possibly
due to reduced work activities. OC concentrations were
comparable to those obtained in previous studies con-
ducted in bus depots [40,41]. The presence of secondary
organic aerosol is suggested by the elevated proportion
of OC relative to EC. EC, a primary pollutant emitted
during incomplete combustion of fossil and carbonac-
eous fuels, is often used as a surrogate for diesel parti-
cles. Approximately 75% of a typical diesel particle is
EC, depending on engine operating conditions [42]. The
EC contribution to total PM
4
was between 12 and 24%
(Table 2 stationary m easurements). This indicated that
diesel emissions in the bus depots were not dominant.
The main source of particulate matter identified at these
workplaces was bus repair and maintenance. This was
corroborated with the much higher personal atmo-
spheric concentrations of PM
4
and OC, reflecting work
on engines and with organic compounds such as sol-
vents and lubricating fluids. Moreover, the surface
Table 2 Stationary and personal concentrations of particles and gaseous pollutants measured at the different
workplaces during two consecutive days of an 8-hour period of shift (day or night shift as indicated)
Parameter Depot 1
day
Depot 2
day
Depot 2
night
Depot 2
a
day
Depot 3
day
Depot 3
night
Stationary measurements
b
PM
4
[μg/m
3
] 71 ± 11 52 ± 2 32 ± 15 59 ± 12 43 ± 3 25 ± 9
OC [μg/m
3
] 29±2 24±2 30±4 35±4 26±0 16±6
EC [μg/m
3
] 16±1 7±1 7±1 7±2 7±1 6
Fe [ng/m
3
] 1280 ± 173 2346 ± 292 1053 ± 679 2907 ± 1213 323 ± 100 1459 ± 1454
Cu [ng/m
3
] 105 ± 51 48 ± 23 17 ± 5 186 ± 53 12 ± 2 75 ± 86
Mn [ng/m
3
] 9±3 27±1 13±8 29±1 25±33 13±14
B[a]P
eq
[ng/m
3
] 9.6 ± 0.8 0.85 ± 0.2 0.40 ± 0.3 1.6 ± 0.2 1.1 ± 0.1 0.2 ± 0.1
NO [ppb] 431 ± 69 n.a
c
n.a 781 ± 99 445 ± 218 176 ± 98
NO
2
[ppb] 117 ± 11 n.a n.a 136 ± 13 31 ± 16 17 ± 9
NO
x
[ppb] 547 ± 79 n.a n.a 917 ± 112 476 ± 234 192 ± 107
O
3
[ppb] 1.4 ± 0.2 2.3 ± 0.1 4.3 ± 0.8 1.7 ± 0.9 4.3 ± 4.7 12.9 ± 4.9
Personal measurements
d
PM
4
Non smoker 99 ± 49 (12) 73 ± 50 (6) 125 ± 181 (8)
e
69 ± 52 (12) 59 ± 47 (6) 56 ± 41 (2)
PM
4
Smoker 275 ± 195 (2) 182 ± 97 (4) 159 ± 88 (4) 164 ± 54 (4) 103 ± 8 (2) 150 ± 81 (2)
OC Non smoker 43 ± 12 (12) 34 ± 7 (6) 43 ± 12 (8) 48 ± 16 (12) 35 ± 14 (6) 37 ± 1 (2)
OC Smoker 85 ± 31 (2) 107 ± 71 (4) 137 ± 63 (4) 97 ± 34 (4) 68 ± 8 (2) 95 ± 55 (2)
EC Non smoker 11 ± 3 (12) 7 ± 2 (6) 5 ± 3 (8) 7 ± 2 (12) 7 ± 3 (6) 2 ± 1 (2)
EC Smoker 14 ± 4 (2) 13 ± 13 (4) 11 ± 5 (4) 10 ± 3 (4) 9 ± 1 (2) 7 ± 6 (2)
a
: Measurements done during winter time.
b
: Results are mean ± SD (n = 2).
c
: n.a: not available.
d
: Results are mean ± SD (n); units in μg/m
3
.
e
: including a heavily exposed worker (570 μg/m
3
).
Sauvain et al. Journal of Occupational Medicine and Toxicology 2011, 6:18
/>Page 6 of 13
(a)
(b)
(c)
200
500
1,000
2,000
4,000
day 1 day 2 day 1 day 2
before after before after before after before after
non smoker smoker
Reducing capacity [μW/g creatinine]
*
.5
1
2
5
10
day 1 day 2 day 1 day 2
before after before after before after before after
non smoker
smoker
[μg/g
creatinine]
.5
1
2
5
10
day 1 day 2 day 1 day 2
before after before after before after before after
non smoker smoker
8
-
OHdG
[μg/g creatinine]
*
* *
8OHdG [μg/g creatinine]
.02
.05
.1
.2
.5
day 1 day 2 day 1 day 2
before after before after before after before after
non smoker
smoker
1-OHP
[μmol/mol creatinine]
*
1-OHP [μmol/mol creatinine]
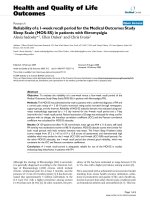
Figure 1 Levels of 1-OHP, 8OHdG and reducing species in urine. Concentrations of 1-OHP (a), 8OHdG (b) and reducing capacity (c) in urine
samples of workers, presented as a function of their smoking status and time of sampling. Concentrations are expressed as μmol/mol creatinine
for 1-OHP, μg/g creatinine for 8OHdG, and μW/g creatinine for the reduced species. Horizontal line in the box plot indicates the median, with
25 and 75% of the values being inside the box. Whiskers correspond to 95% of all the values, and dots to outliers. * indicate a statistically
significant difference (p < 0.05).
Sauvain et al. Journal of Occupational Medicine and Toxicology 2011, 6:18
/>Page 7 of 13
reactivity of the stationary collected particles in these
bus depots, described in a prev ious paper [27], indicated
that PM
4
was quite oxidized, probably because of ageing.
EC results (Table 2 stationary measurements) were com-
parable with those obtained in previous studies in bus
depots [30,43,44]. Unlike PM
4
and OC, the concentrations
of EC measured in personal air sampling (Table 2 personal
measurements) were comparable to those measured using
stationary air sampling. A similar trend was observed in
[40]. These results could imply that the EC concentration
may be considered as rather homogeneously distributed
throughout the investigated workplace. The fact that the
personal exposure to PM
4
and OC was greater than the
stationary concentration was expected and is in accor-
dance with previous studies [40,45].
We evaluated the adsorbed PAH on the collected par-
ticles because their presence may be considered a good
proxy for the pro-oxidant potenti al of ultrafine particles
[46]. The B[a]P
eq
concentration o btained in this study
corresponds to urban ambient levels [47] and is in
agreement w ith B[a]P data obtained fro m truck driv ers
[30,48]. Despite the low concentrations of B[a]P
eq
and
combustion- derived particles, we detected an increase in
urinary 1-OHP of non-smokers after two days of work
(Figure 1(a)). This indicates that the workplace was a
relevant contributor to the total PAH exposure and that
metabolic processes were active.Theslightlyelevated
1-OHP levels observed for non-smokers on day 1 before
shiftcomparedtoendofshiftforthesamedaymaybe
related to barbecues during the week-end. The half-life of
1-OHP in the body has been reported to be 6-35 hours
[32], which suggests that the observed 1-OHP levels were
mainly defined by PAH exposure of the previous
24 hours. It is known that one of the PAH activation
pathways may lead to redox active quinone-like com-
pounds, capable of oxidizing biological components [5].
Table 3 Coefficients with standard error and p-value for the different mixed models used for explaining the time
trend of urinary 8OHdG (log corrected)
Smoker Respiratory problems Between-day
a
Within day Constant OC NOx Cu
Model A1: No exposure
Coefficient 0.27 ± 0.20 0.63 ± 0.33 0.33 ± 0.07 0.25 ± 0.06 0.75 ± 0.2 - - -
p 0.175 0.055 < 0.001 < 0.001 < 0.001 - - -
Model A2: including stationary OC
Coefficient 0.34 ± 0.20 0.68 ± 0.33 0.29 ± 0.07 -0.47 ± 0.27 1.22 ± 0.3 0.03 ± 0.01 - -
p 0.087 0.039 < 0.001 0.083 < 0.001 0.007 - -
Model A3: including stationary NOx
Coefficient 0.46 ± 0.23 0.67 ± 0.34 0.39 ± 0.08 -0.22 ± 0.19 0.90 ± 0.3 - 7.7.10
-4
± 2.7. 10
-4
-
p 0.05 0.052 < 0.001 0.259 < 0.001 - 0.004 -
Model A4: including stationary Cu
Coefficient 0.36 ± 0.20 0.61 ± 0.31 0.36 ± 0.07 0.12 ± 0.09 0.60 ± 0.2 - - 1.5.10
-3
± 0.7. 10
-3
p 0.069 0.047 < 0.001 0.150 0.001 - - 0.029
a
: restricted to non-smokers.
Table 4 Coefficients with standard error and p-value for the different mixed models explaining the time trend of the
urinary concentrations of water-soluble reduced species (log corrected)
Smoker Respiratory problems Between-day
a
Within day Constant OC NOx Cu
Model A1: No exposure
Coefficient 0.30 ± 0.17 0.35 ± 0.20 0.35 ± 0.10 0.17 ± 0.09 6.5 ± 0.11 - - -
p 0.081 0.080 0.001 0.060 < 0.001 - - -
Model A2: including stationary OC
Coefficient 0.31 ± 0.18 0.39 ± 0.21 0.33 ± 0.10 -0.22 ± 0.38 6.7 ± 0.41 0.01 ± 0.01 - -
p 0.082 0.060 0.002 0.563 < 0.001 0.293 - -
Model A3: including stationary NOx
Coefficient 0.40 ± 0.20 0.37 ± 0.22 0.37 ± 0.11 -0.14 ± 0.26 6.6 ± 0.28 - 5.8.10
-4
± 3.6. 10
-4
-
p 0.044 0.093 0.001 0.596 < 0.001 - 0.112 -
Model A4: including stationary Cu
Coefficient 0.36 ± 0.18 0.34 ± 0.20 0.38 ± 0.10 0.04 ± 0.11 6.4 ± 0.18 - - 1.5.10
-3
± 0.9. 10
-3
p 0.045 0.090 < 0.001 0.760 < 0.001 - - 0.093
a
: restricted to non-smokers.
Sauvain et al. Journal of Occupational Medicine and Toxicology 2011, 6:18
/>Page 8 of 13
However, no association was observed between log
8OHdG and log 1-OHP, neither for smokers nor for
non-smokers (data not shown). This lack of correlation
with log 8OHdG in non-smokers suggests that PAH did
not contribute considerably as an oxidizing source in this
study. Conflicting results have also been reported in the
literature regarding a possible association between
8OHdG and 1-OHP. While many studies did not find
any correlation [9,33,49], some reported significant corre-
lations between these two urinary biomarkers [14,50].
(a)
(b)
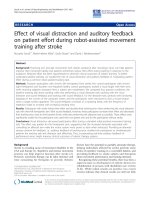
Figure 2 Correlation between 8OHdG and reducing species. (a) Correlation between urinary levels of 8OHdG ( in μg/g creatinine) and
reduced species (in μW/g creatinine) for all collected samples. (b) Correlation between within-shift variation of 8OHdG (% of initial value) and
within-shift reduced species (% of initial value) for smokers and non smokers.
Sauvain et al. Journal of Occupational Medicine and Toxicology 2011, 6:18
/>Page 9 of 13
The analytical determination of urinary 8OHdG is
challenging, mostly due to the complexity of the matrix
[19] a nd the use o f highly specific detection techniques
such as LC-MS/MS is recommended [21,51]. The urin-
ary levels of 8OHdG determined in this study for Mon-
day morning (0.34-7.21 μg/g cre atinine; median 2. 46 μg/
g creat inine for non-smokers and 1.71-5.23 μg/g creati-
nine, median 3.36 μg/g creatinine for smokers) were in
agreeme nt with other studies reporting 8OHdG concen-
trations in urine for controls (non-exposed non-smo-
kers) and an alyzed by HPLC techniques (3.3-5.6 μg/g
creatinine, median 3.7 μg/g creatinine - [22,49,51-54]).
We observed that the concentratio n of the oxidative
stress marker 8OHdG increased over the two consecu-
tive days of shift in non-smoking bus workers. Such an
increase of urinary 8OHdG levels is in accordance with
previous pre- and post-shift studies on boilermakers
exposed to residual oil fly ash [9] or security guards
exposed to ambient particles [55]. It is worth mention-
ing that c ontradictory results have been obtained for
garage and garbage workers [49] and for workers
exposed to PAH in silicon production [33], where no
statistical differences could be measured between pre-
and post-workshift urinary samples collected five days
later. Our statistical treatment using linear mixed mod-
els suggests that the observed 8 OHdG urinary increase
was mostly related to workplace exposure to OC (or
NO
x
) and possibly particulate copper. This result sup-
ports the hypothesis that PM components are causative
for such an increase, in agre ement with most of the
occupational studies investigating the effect of particle
exposure on 8OHdG in urine , reviewed in [25]. Particu-
larly for copper, an association with hydroxyl radical
generation potential of coarse ambient particle and the
formation of 8OHdG in an acellular test has been
reported [56]. The fact that PM
4
was not associated
with 8OHdG could be due to difficulties to accurately
determine low particle masses under our experimental
conditions.
Personal exposure characterization is reported to be
more strongly associated with the 8OHdG in lympho-
cytes than for stationary monitoring stations [57]. Sur-
prisingly, we found only c orrelations of urinary 8OHdG
with stationary, but not with personal air concentra-
tions. This could indicate that there either w as a pro-
blem with the personal measurement method (for which
we have no indications), or that the stationary measure-
ments at the workplace were a better representation of
the hazard-relevant particles. In our study, personal con-
centrations are thought to be strongly influenced by
newly emitted c ompounds, as volunteers are working
near the particle sources. It is known that diesel parti-
cles possess an intrinsic ability to act as oxidant [58]
and differences in the chemical composition of PM are
important for the induction of DNA damage [59]. Based
on a recent study indicating that aged diesel particles
present a higher oxidant generation and potential toxi-
city than fresh ones [60], we speculate that the station-
ary concentrations represent somewhat aged particles
(corresponding to more oxidized particles than freshly
emitted aerosols). This is supported by other measure-
ments [27] performed at the same depots.
Reducing species like antioxidants have an important
role to play in minimizing the amount of oxidative
damage that may arise fr om the endogenous normal
metabolism of oxygen or induced by exposure to exo-
genous reactive compounds [61]. In our study, low
exposure to particle components (OC or NO
x
and Cu)
led to a significant increase in urinary 8OHdG levels in
non-smokers after 2 days of work (Figure 1(b)). Conco-
mitantly, a clear association wa s observed between the
absolute values of urinary 8OHdG and soluble reducing
species (Figure 2(a)) as well as for the within-shift var ia-
tions (Figure 2(b)). One p ossible explanation for this
result seems to be that this correlation reflects a protec-
tive response of the organism to particle-induced oxida-
tive stress. The observed increase of reducing species in
urine would mirror an increased level in blood originat-
ing from a response to oxidative stress in the body mon-
itored by the urinary 8OHdG. This explanation is in
agreement with the protective tier 1 part of the hier-
archical response model [7]. In the past, antioxidant
responses elicited by environmental pollutants have
been described [62] but results are contradictory.
Increased antioxidant levels were observed in the lining
fluid of volunteers after low-dose inhalation of diesel
particles (approximately 100 μg/m
3
PM
10
) [63,64],
accompanied by an increase of reduced glutathione and
urate after 18 hours post-exposure. Such an increase
had been attributed to an up-regulation of protective
antioxidants [63]. Exposure to PM
2.5
has also been
reported to increase the serum levels of uric acid in
North Carolina police officers [4]. A similar increase of
plasma antioxidants in response to an increased oxid a-
tive stress was observed in newborns [22]. On t he con-
trary, an analysis of the relationship between biomarkers
of oxidative DNA damage and antioxidant status for
policemen and bus drivers from three European cities
[65] did not find correlations between plasma levels of
vitamin A , vitamin E, vitamin C, and lymphocyte
8OHdG, while plasma vitamin C levels were negatively
correlated with 8OHdG in urine of bus drivers [59].
Severe depl etion of plasma a ntioxidants was also
observed in cement plant workers, concomitantly with
increased concentrations of biomarkers of lipoperoxida-
tion [66]. High particle exposure usually associated with
such activities ma y have overwhelmed the antioxidant
control, which could explain these contradictory results.
Sauvain et al. Journal of Occupational Medicine and Toxicology 2011, 6:18
/>Page 10 of 13
Likewise, the use of different ant ioxidant markers makes
the comparison of these results difficult.
Another plausible explanation for the observed cor-
relation between 8OHdG and the urinary reducing
capacity could be due to changed metabolism related
to circadian r hythms. Such a process would be particu-
larly visible for the within-shift variations of these two
parameters (Figure 2(b)). Indeed, the concentrations of
urinary 8OHdG ha ve been show n to increase from 6 a.
m. to reach its maximum around 6 p.m. [67]. Such
biological variations may contribute to the obser ved
within-day changes of 8OHdG but not to the between-
day increase. On the other side, circadian rhythms
have been observed for the activity of antioxidant
enzymes as well as for the synthesis of low molecular
weight antioxidants (reviewed in [68]). Particularly for
urate, a molecule responding to the present electroche-
mical measurement, a diurnal maximum in human
serum (peaking at around 7 a.m.) has been reported
[67]. As only 10% of urate is excreted in the urine (the
remaining 90% being recirculated by the renal system
[3]), an increase of this antioxidant in blood will also
lead to an increase in urine. The fact that we do not
observe any correlation between the reducing capacity
and the expo sure parameters adds some weight to the
suggestion that these within-shift variations are related
to endogenous processes.
The p resence of confounding factors such as diet has
also to be taken into account when DNA damage bio-
markers are considered [19]. This parameter would have
an effect only on the reducing capacity, as 8OHdG levels
in urine are reported to be independent of the diet [69].
It is unlikely that the diet of the workers changed drasti-
cally during the two sampling days, suggesting that the
observed urinary increase of the reducing capac ity for
non-smokers may be due to other influences.
Conclusions
In summary, surveyed workers in bus depots were
exposed to low levels of PM
4
and related combustion-
derived compounds. Despite this low exposure, urinary
levels of 8OHdG increased significantly for non-smok-
ing mechanics during two consecutive days of shift.
This increase was correlated with the concentrations of
the particle-related variables OC, NO
x
,andpossibly
the particulate copper content. The increase of the oxi-
dative stress marker was accompanied by an increase
of urinary levels of water soluble reducing species.
This strong association is either suggestive of an
increase of the effect of different protection mechan-
isms or co uld be explained by changes in the metabo-
lism, as observed in circadian rhythms. Additional
investigations should be performed in order to shed
light on these issues.
Additional material
Additional file 1: Supplemental Material Manuscript ID
2422944994984550. File giving more details about the analytical
conditions for the 8OHdG determination in urine, the sampling sites as
well as the results of the different statistical fixed and random models
not presented in the main manuscript.
List of abbreviations used
B[a]P
eq
: Benzo[a]Pyrene equivalent concentrations; BMI: body mass index; Cu:
copper;
EC: elemental carbon; Fe: iron; GC-MS: gas chromatography-mass
spectrometer;
ISO/IEC 17025: International Organization for Standardisation,
Norm for “General requirements for the competence of testing and
calibration laboratories";
LC-MS/MS: liquid chromatography-tandem mass
spectrometry;
Mn: manganese; OC: organic carbon; 8OHdG: 8-hydroxy-2’-
deoxyguanosine;
1-OHP: 1-hydroxypyrene; PAHs : polycyclic aromatic
hydrocarbons;
PM
4
: particles with aerodynamic diameter smaller than 4 μm;
ROS: reactive oxygen species; SD: standard deviation; SPE: solid-phase
extraction;
μW: microwatt.
Acknowledgements
We thank all the workers of the bus depots as well as Dr Michèle Berode,
Christine Kohler and Dr Nancy Hopf (Institute for Work and Health) for their
help in the metal/creatinine analysis, and comments on the manuscript. The
medical team of the Institute for Work and Health (Prof Marcel-André Boillat,
Dr Sophie Praz, Dr David Kursner and Dr Fréderic Regamey) are
acknowledged for the biological fluid collection in the field.
This research project was supported by the Swiss State Secretariat for
Education and Research (grant BBW C03.0050) within the framework of the
COST Action 633 “Particulate Matter - Properties Related to Health Effects”.
Author details
1
Institute for Work and Health, University of Lausanne + Geneva, 21 rue du
Bugnon, CH-1011 Lausanne, Switzerland.
2
EDEL Therapeutics S.A., PSE-B/EPFL,
CH-1015 Lausanne, Switzerland.
3
Paul Scherrer Institute, Laboratory of
Atmospheric Chemistry (LAC), CH-5232 Villigen PSI, Switzerland.
4
University
of California, Davis; Department of Environmental Toxicology, 4422 Meyer
Hall, One Shields Avenue, Davis CA 95616 USA.
Authors’ contributions
JJS: participated in the study design and planning, was responsible for the
field campaign, performed the PM measurements and characterization,
evaluated and interpreted the data and participated in the writing of the
manuscript. AS: organized the field campaign, was responsible for the field
characterization of gaseous pollutants, performed the urinary 8OHdG
measurements, evaluated and interpreted the data, prepared and
participated in the manuscript writing. PW: evaluated the data, performed
the statistical analysis and participated in the writing of the manuscript. PT/
GL: performed the reducing species measurements and contributed to the
writing of the manuscript. FS: participated in the field campaign, performed
the 1-OHP analysis and contributed to the writing of the manuscript. SD:
participated in the field campaign, performed the PAH analysis and
contributed to the writing of the manuscript. MG/MJR: participated in the
study design and contributed to the scientific content of the manuscript
and its revision. MR: participated in the study design and planning,
interpreted the toxicological data and contributed to the scientific content
and manuscript revision. All authors have read and approved the final
manuscript.
Competing interests
The authors declare that they have no competing interests.
Received: 21 December 2010 Accepted: 30 May 2011
Published: 30 May 2011
References
1. Brook RD, Rajagopalan S, Pope A, Brook JR, Bhatnagar A, Diez-Roux AV,
Holguin F, Hong Y, Luepker RV, Mittleman MA, Peters A, Siscovick D,
Sauvain et al. Journal of Occupational Medicine and Toxicology 2011, 6:18
/>Page 11 of 13
Smith SC, Whitsel L, Kaufman JD: Particulate matter air pollution and
cardiovascular disease. An update to the scientific statement from the
American Heart Association. Circulation 2010, 121:2331-2378.
2. Halliwell B, Gutteridge JMC: Cellular responses to oxidative stress:
adaptation, damage, repair, senescence and death. In Free Radicals in
Biology and Medicine 4 edition. Edited by: Halliwell B, Gutteridge JMC. New
York: Oxford University Press; 2007:187-267.
3. Bergamini C, Cicoira M, Rossi A, Vassanelli C: Oxidative stress and
hyperuricaemia: pathophysiology, clinical relevance and therapeutic
implications in chronic heart failure. Eur J Heart Failure 2009, 11:444-452.
4. Riediker M, Devlin RB, Griggs TR, Herbst MC, Bromberg PA, Williams RW,
Cascio WE: Cardiovascular effects in patrol officers are associated with
fine particulate matter from brake wear and engine emissions. Particle
Fibre Toxicol 2004, 1:2.
5. Penning T, Burczynski M, Hung C, McCoull K, Palackal N, Tsuruda L:
Dihydrodiol dehydrogenases and polycyclic aromatic hydrocarbon
activation: Generation of reactive and redox active o-quinones. Chem Res
Toxicol 1999, 12:1-18.
6. Gaetke LM, Chow CK: Copper toxicity, oxidative stress, and antioxidant
nutrients. Toxicology 2003, 189:147-163.
7. Nel A, Xia T, Mädler L, Li N: Toxic potential of materials at the nanolevel.
Science 2006, 311:622-627.
8. Lee MW, Chen ML, Lung SC, Tsai CJ, Yin XJ, Mao IF: Exposure assessment
of PM2.5 and urinary 8-OHdG for diesel exhaust emission inspector. Sci
Total Environ 2010, 408:505-510.
9. Kim JY, Mukherjee S, Ngo L, Christiani DC: Urinary 8-hydroxy-2’-
deoxyguanosine as a biomarker of oxidative DNA damage in workers
exposed to fine particulates. Environ Health Perspect 2004, 112:666-671.
10. Lai CH, Liou SH, Lin HC, Shih TS, Tsai PJ, Chen JS, Yang T, Jaakkola JK,
Strickland PT: Exposure to traffic exhausts and oxidative DNA damage.
Occup Environ Med 2005, 62:216-222.
11. Liu AL, Lu WQ, Wang ZZ, Chen WH, Lu WH, Yuan J, Nan PH, Sun JY,
Zou YL, Zhou LH, Zhang C, Wu TC: Elevated levels of urinary 8-hydroxy-
2’-deoxyguanosine, lymphocytic micronuclei, and serum glutathione S-
transferase in workers exposed to coke oven emissions. Environ Health
Perspect 2006, 114:673-677.
12. Loft S, Poulsen H, Vistisen K, Knudsen L: Increased urinary excretion of 8-
oxo-2’-deoxyguanosine, a biomarker of oxidative DNA damage, in urban
bus drivers. Mutat Res 1999, 441:11-19.
13. Rossner P, Svecova V, Milcova A, Lnenickova Z, Solanski I, Santella RM,
Sram RJ: Oxidative and nitrosative stress markers in bus drivers. Mutat
Res 2007, 617:23-32.
14.
Nilsson R, Nordlinder R, Moen BE, Øvrebø S, Bleie K, Skorve AH, Hollund BE,
Tagesson C: Increased urinary excretion of 8-hydroxydeoxyguanosine in
engine room personnel exposed to polycyclic aromatic hydrocarbons.
Occup Environ Med 2004, 61:692-696.
15. Kuo H, Chang S, Wu K, Wu F: Chromium(VI) induced oxidative damage to
DNA: increase of urinary 8-hydroxydeoxyguanosine concentrations
(8OHdG) among electro-plating workers. Occup Environ Med 2002,
60:590-594.
16. Wong RH, Kuo CY, Hsu ML, Wang TY, Chang PI, Wu TH, Huang S: Increased
levels of 8-hydroxy-2’-deoxyguanosine attributable to carcinogenic
metal exposure among schoolchildren. Environ Health Persp 2005,
113(10):1386-1390.
17. Hu CW, Pan CH, Huang YL, Wu MT, Chang LW, Wang CJ, Chao MR: Effects
of arsenic exposure among semiconductor workers: A cautionary note
on urinary 8-oxo-7,8-dihydro-2’-deoxyguanosine. Free Radic Biol Med 2006,
40:1273-1278.
18. Barbato DL, Tomei G, Tomei F, Sancini A: Traffic air pollution and
oxidatively generated DNA damage: can urinary 8-oxo-7,8-dihydro-2-
deoxiguanosine be considered a good biomarker? A meta-analysis.
Biomarkers 2010, 15(6):538-545.
19. Møller P, Loft S: Oxidative damage to DNA and lipids as biomarkers
of exposure to air pollution. EnvironHealthPerspect2010,
118:1126-1136.
20. Halliwell B: Can oxidative DNA damage be used as a biomarker of cancer
risk in Humans? Problems, resolutions and preliminary results from
nutritional supplementation studies. Free Rad Res 1998, 29:469-486.
21. Loft S, Danielsen PH, Mikkelsen L, Risom L, Forchhammer K, Moller P:
Biomarkers of oxidative damage to DNA and repair. Biochem Soc Trans
2008, 36:1071-1076.
22. Dziaman T, Gackowski D, Rozalski R, Siomek A, Szulczynski J, Zabielski R,
Olinski R: Urinary excretion rates of 8-oxoGua and 8-oxodG and
antioxidant vitamin levels as a measure of oxidative stress in healthy,
full-term newborns. Free Radic Res 2007, 41:997-1004.
23. Cooke MS, Henderson PT, Evans MD: Sources of extracellular, oxidatively-
modified DNA lesions: Implications for their measurement in urine. J Clin
Biochem Nutr 2009, 45:255-270.
24. Poulsen HE, Loft S: Interpretation of oxidative DNA modification: relation
between tissue levels, excretion of urinary repair products. In DNA and
Free Radicals. Techniques, Mecanisms and Applications. Edited by: Aruoma OI,
Halliwell B. St Lucia: OICA International Press; 1998:261-270.
25. Pilger A, Rüdiger H: 8-Hydroxy-2’-deoxyguanosine as a marker of
oxidative DNA damage related to occupational and environmental
exposures. Int Arch Occup Environ Health 2006, 80:1-15.
26. Comité Européen de Normalisation (CEN EN 481): Workplace atmospheres:
specification for conventions for measurement of suspended matter in
workplace atmospheres Brussels, Belgium; 1993.
27. Setyan A, Sauvain J-J, Riediker M, Guillemin M, Rossi MJ: Characterization
of
surface functional groups present on laboratory-generated and ambient
aerosol particles by means of heterogeneous titration reactions. J Aerosol
Sci 2009, 40:534-548.
28. Perret V, Huynh CK, Droz P-O, Vu Duc T, Guillemin M: Assessment of
occupational exposure to diesel fumes - parameter optimisation of the
thermal coulometric measurement method for carbon. J Environ Monit
1999, 1:367-372.
29. Sauvain J-J, Vu Duc T, Huynh CK: Development of an analytical method
for the simultaneous determination of 15 carcinogenic polycyclic
aromatic hydrocarbons and polycyclic aromatic nitrogen heterocyclic
compounds. Application to diesel particulates. Fresenius J Anal Chem
2001, 371:966-974.
30. Sauvain J-J, Vu Duc T, Guillemin M: Exposure to carcinogenic polycyclic
aromatic compounds and health risk assessment for diesel-exhaust
exposed workers. Int Arch Occup Environ Health 2003, 76:443-455.
31. Bouchard M, Viau C: Urinary 1-hydroxypyrene as a biomarker of exposure
to polycyclic aromatic hydrocarbons: biological monitoring strategies
and methodology for determining biological exposure for various work
environments. Biomarkers 1999, 4(3):159-187.
32. Jongeneelen F: Benchmark guideline for urinary 1-hydroxypyrene as
biomarker of occupational exposure to polycyclic aromatic
hydrocarbons. Ann Occup Hyg 2001, 45:3-13.
33. Marie C, Ravanat J-L, Badouard C, Marques M, Balducci F, Maître A: Urinary
levels of oxidative DNA and RNA damage among workers exposed to
polycyclic aromatic hydrocarbons in silicon production: comparison with
1-hydroxypyrene. Environ Mol Mutagen 2009, 50:88-95.
34. Germadnik D, Pilger A, Rüdiger HW: Assay for the determination of
urinary 8-hydroxy-2’-deoxyguanosine by high-performance liquid
chromatography with electrochemical detection. J Chrom B 1997,
689:399-403.
35. Hua Y, Wainhaus SB, Yang Y, Shen L, Xiong Y, Xu X, Zhang F, Bolton JL, van
Breemen RB: Comparison of negative and positive ion electrospray
tandem mass spectrometry for the liquid chromatography tandem mass
spectrometry analysis of oxidized deoxynucleosides. J Am Soc Mass
Spectrom 2001, 12:80-87.
36. Liu J, Roussel C, Lagger G, Tacchini P, Girault HH: Antioxidant sensors
based on DNA-modified electrodes. Anal Chem 2005, 77:7687-94.
37. Liu J, Su B, Lagger G, Tacchini P, Girault HH: Antioxidant redox sensors
based on DNA modified carbon screen-printed electrodes. Anal Chem
2006, 78:6879-84.
38. Nishida Y: Relation Between Creatinine and Uric-Acid Excretion. Ann
Rheum Dis 1992, 51:101-102.
39. Lewné M, Plato N, Gustavsson P: Exposure to particles, elemental carbon
and nitrogen dioxide in workers exposed to motor exhaust. Ann Occup
Hyg 2007, 51:693-701.
40. Groves J, Cain JR:
A survey of exposure to Diesel engine exhaust
emissions
in the workplace. Ann Occup Hyg 2000, 44:435-447.
41. Wheatley AD, Sadhra S: Occupational exposure to diesel exhaust fumes.
Ann Occup Hyg 2004, 48:369-376.
42. U.S. Environmental Protection Agency: Health assessment document for
Diesel engine exhaust. EPA/600/8-90/057F, Washington DC 2002.
43. Seshagiri B, Burton S: Occupational exposure to Diesel exhaust in the
Canadian federal jurisdiction. AIHA Journal 2003, 64:338-345.
Sauvain et al. Journal of Occupational Medicine and Toxicology 2011, 6:18
/>Page 12 of 13
44. Ramachandran G, Paulsen D, Watts W, Kittelson D: Mass, surface area and
number metrics in diesel occupational exposure assessment. J Environ
Monit 2005, 7:728-735.
45. Lee BK, Smith TJ, Garshick E, Natkin J, Reaser P, Lane K, Lee HK: Exposure of
trucking company workers to particulate matter during the winter.
Chemosphere 2005, 61:1677-1690.
46. Li N, Sioutas C, Cho A, Schmitz D, Misra C, Sempf J, Wang M, Oberley T,
Froines J, Nel A: Ultrafine particulate pollutants induce oxidative stress
and mitochondrial damage. Environ Health Perspect 2003, 111:455-460.
47. Zmirou D, Masclet P, Boudet C, Dor F, Déchenaux J: Personal exposure to
atmospheric polycyclic aromatic hydrocarbons in general adult
population and lung cancer risk. J Occup Environ Med 2000, 42:121-126.
48. Guillemin M, Herrera H, Huynh CK, Droz PO, Vu Duc T: Occupational
exposure of truck drivers to dust and polynuclear aromatic hydrocarbon:
a pilot study in Geneva, Switzerland. Int Arch Occup Environ Health 1992,
63:439-447.
49. Harri M, Svoboda P, Mori T, Mutanen P, Kasai H, Savela K: Analysis of 8-
hydoxydeoxyguanosine among workers exposed to diesel particulate
exhaust: comparison with urinary metabolites and PAH air monitoring.
Free Radic Res 2005, 39:963-972.
50. Chuang CY, Lee CC, Chang YK, Sung FC: Oxidative DNA damage
estimated by urinary 8-hydroxydeoxyguanosine: influence of taxi
driving, smoking and areca chewing. Chemosphere 2003, 52:1163-1171.
51. Hu CW, Wu MT, Chao MR, Pan CH, Wang CJ, Swenberg JA, Wu KY:
Comparison of analyses of urinary 8-hydroxy-2’-deoxyguanosine by
isotope-dilution liquid chromatography with electrospray tandem mass
spectrometry and by enzyme-linked immunosorbent assay. Rapid
Commun Mass Spectrom 2004, 18:505-510.
52. Chien YC, Yeh CT: Excretion characteristics of urinary 8-
hydroxadeoxyguanosine after dietary exposure to polycyclic aromatic
hydrocarbons. Environ Mol Mutagen 2010, 51:243-250.
53. Toraason M, Hayden C, Marlow D, Rinehart R, Mathias P, Werren D,
DeBord DG, Reid T: DNA strand breaks, oxidative damage, and 1-OH
pyrene in roofers with coal-tar pitch dust and/or asphalt fume exposure.
Int Arch Occup Environ Health 2001, 74:396-404.
54. De Boeck M, Lardau S, Buchet JP, Kirsch-Volders M, Lison D: Absence of
significant genotoxicity in lymphocytes and urine from workers exposed
to moderate levels of cobalt-containing dust: a cross-sectional study.
Environ Mol Mutagen 2000, 36:151-160.
55. Wei Y, Han IK, Shao M, Hu M, Zhang J, Tang X: PM2.5 constituents and
oxidative DNA damage in humans. Environ Sci Technol 2009,
43(13):4757-4762.
56. Shi T, Knaapen AM, Begerow J, Birmili W, Borm PJA, Schins RPF: Temporal
variation of hydroxyl radical generation and 8-hydroxy-2’-
deoxyguanosine formation by coarse and fine particulate matter. Occup
Environ Med 2003,
60:315-321.
57. Sørensen M, Autrup H, Hertel O, Wallin H, Knudsen LE, Loft S: Personal
exposure to PM2.5 and biomarkers of DNA damage. Cancer Epidem
Biomarkers and Prev 2003, 12:191-196.
58. Sauvain J J, Deslarzes S, Riediker M: Nanoparticle reactivity toward
dithiothreitol. Nanotoxicology 2008, 2(3):121-129.
59. Rossner P, Svecova V, Milcova A, Lnenickova Z, Solanski I, Sram R: Seasonal
variability of oxidative stress in city bus drivers Part I. Oxidative damage
to DNA. Mutat Res 2008, 642:14-20.
60. Li Q, Wyatt A, Kamens R: Oxidant generation and toxicity enhancement
of aged-diesel exhaust. Atmos Environ 2009, 43:1037-1042.
61. Valko M, Leibfritz D, Moncol J, Cronin M, Mazur M, Telser J: Free radicals
and antioxidants in normal physiological functions and human disease.
Int J Biochem Cell Biol 2007, 39:44-84.
62. Limòn-Pacheco J, Gonsebatt M: The role of antioxiants and antioxidant-
related enzymes in protective responses to environmentally induced
oxidative stress. Mutat Res 2009, 674:137-147.
63. Mudway I, Stenfors N, Duggan S, Roxborough H, Zielinski H, Marklund S,
Blomberg A, Frew A, Sandström T, Kelly F: An in vitro and in vivo
investigation of the effects of diesel exhaust on human airway lining
fluid antioxidants. Arch Biochem Biophys 2004, 423:200-212.
64. Behndig AF, Mudway IS, Brown JL, Stenfors N, Helleday R, Duggan ST,
Wilson SJ, Boman C, Cassee FR, Frew AJ, Kelly FJ, Sandström T, Blomberg A:
Airway antioxidant and inflammatory responses to diesel exhaust
exposure in healthy humans. Eur Respir J 2006, 27:359-365.
65. Singh R, Sram R, Binkova B, Kalina I, Popov T, Georgieva T, Garte S, Taioli E,
Farmer PB: The relationship between biomarkers of oxidative DNA
damage, polycyclic aromatic hydrocarbons DNA adducts, antioxidant
status and genetic susceptibility following exposure to environmental
air pollution in humans. Mutat Res 2007, 620:83-92.
66. Aydin S, Aral I, Kilic N, Bakan I, Aydin S, Erman F: The level of antioxidant
enzymes, plasma vitamins C and E in cement plant workers. Clin Chim
Acta 2004, 341:193-198.
67. Kanabrocki E, Murray D, Hermida R, Scott G, Bremner F, Ryan M, Ayala D,
Third J, Shirazi P, Nemchausky B, Hooper C: Circadian variation in
oxidative stress markers in healthy and type II diabetic men. Chronobiol
Int 2002, 19:423-439.
68. Hardeland R, Coto-Montes A, Poeggeler B: Circadian rhythms, oxidative
stress and antioxidative defense mechanisms. Chronobiol Int 2003,
20(6):921-962.
69. Halliwell B, Whiteman M: Measuring reactive species and oxidative
damage in vivo and in cell culture: how should you do it and what do
the results mean? Br J Pharmacol 2004, 142:231-255.
doi:10.1186/1745-6673-6-18
Cite this article as: Sauvain et al.: Biomarkers of oxidative stress and its
association with the urinary reducing capacity in bus maintenance
workers. Journal of Occupational Medicine and Toxicology 2011 6:18.
Submit your next manuscript to BioMed Central
and take full advantage of:
• Convenient online submission
• Thorough peer review
• No space constraints or color figure charges
• Immediate publication on acceptance
• Inclusion in PubMed, CAS, Scopus and Google Scholar
• Research which is freely available for redistribution
Submit your manuscript at
www.biomedcentral.com/submit
Sauvain et al. Journal of Occupational Medicine and Toxicology 2011, 6:18
/>Page 13 of 13