Advances in Sound Localization part 8 doc
Bạn đang xem bản rút gọn của tài liệu. Xem và tải ngay bản đầy đủ của tài liệu tại đây (2.56 MB, 40 trang )
Sonification of 3D Scenes in an Electronic Travel Aid for the Blind
267
low number of selected sound streams are presented only so that the user can easily track
them while in movement.
Further research is needed to judge the usefulness of the prototype when users need to focus
on the actual task of walking and navigating in real environments. Real-world trials with a
portable prototype and visually impaired participants are in preparation.
Results of the presented work can be of use in virtual reality systems in which immersion in
virtual world can be further improved by supporting 3D imaging of objects with 3D
auditory sensation of the surrounding acoustic scenes.
8. Acknowledgements
This work has been supported by the Ministry of Science and Higher Education of Poland
research grant no. N N516 370536 in years 2009-2010 and grant no. N R02 008310 in years
2010-2013. The third author is a scholarship holder of the project entitled "Innovative
education [ ]" supported by the European Social Fund.
9. References
Benjamin, J., Malvern, J., (1973), “The new C-5 laser cane for the blind.” In: Proc. Carnahan
Conf. on Electronic Prosthetics, Univ. of Kentucky.
Bourbakis, N. (2008). Sensing Surrounding 3-D Space for Navigation of the Blind, IEEE
Engineering in Medicine and Biology Magazine, Jan/Febr. 2008, 49–55
Bregman S. (1990). Auditory Scene Analysis: the Perceptual Organization of Sound, A Bradford
Book, The MIT Press, Cambridge, Massachusetts
Brown, M.Z., Burschka, D. & Hager, G.D. (2003). ”Advances in computational stereo”, IEEE
Transactions on Pattern Analysis and Machine Intelligence, Vol. 25, No. 8, 993–1008
Bujacz, M. & Strumillo, P. (2006): Stereophonic Representation of Virtual 3D Scenes – a
Simulated Mobilty Aid For the Blind, XI Symposium AES: New Trends In Audio And
Video, 157–162
Capp, M., Picton, P., (2000) The optophone: an electronic blind aid, Engineering Science and
Education Journal, June 2000, 137-143
Castro-Toledo, D.; Magal, T.; Morillas, S. & Peris-Fajarnés, G. (2006). 3D Environment
Representation through Acoustic Images. Auditory Learning in Multimedia
systems, Current Developments in Technology-Assisted Education, 735–740
Damaschini, R.; Legras, R.; Leroux, R. & Farcy, R. (2005). Electronic Travel Aid for the Blind
people, in Assistive Technology: from Virtuality to Reality, Pruski, A. & Knops, H.
(Eds.), 251–260
Dobrucki, A., Plaskota, P., Pruchnicki, P., Pec, M., Bujacz, M., Strumillo, P., (2010).
Measurement System of Personalized Head Related Transfer Functions and Its
Verification by Virtual Source Localization Trials with Visually Impaired and
Sighted Individuals, Journal of Audio Engineering Society, vol. 58, no. 9, pp. 724–
738.
Gollage, R. G. (Ed.) (1999). Wayfinding behaviour: cognitive mapping and other spatial processes,
John Hopkins University Press, Baltimore , USA
Gonzalez-Mora, J. L., Rodriguez-Hernandez, A., Rodriguez-Ramos, L. F., Diaz-Saco, L.,
Sosa, N., (1999). Engineering Applications of Bio-Inspired Artificial Neural Networks.
Advances in Sound Localization
268
Springer Berlin/Heidelberg, Ch. Development of a new space perception system
for blind people, based on the creation of a virtual acoustic space, 321-330.
Hall, E. T. (1966). The Hidden Dimension, Doubleday, Garden City, N.Y.
Hersh, M. A. & Johnson, M. A. (Eds.) (2008). Assistive Technology for Visually Impaired and
Blind People, Springer–Verlag, London Limited
Heyes, D. A., (1984). The sonic pathfinder: A new electronic travel aid. Journal of Visual
Impairment and Blindness 77, 200-202.
Hoyle, B. S. (2003). The Batcane – mobility aid for the vision impaired and the blind, IEE
Symposium on Assistive Technology, 18–22
Kato, M., Uematsu, H., Kashino, M., Hirahara, T., (2003) “The effect of head motion on the
accuracy of sound localization”, Acoustical Science and Technology, Vol. 24, No.5,
315-317.
Kay, L., (1964). An ultrasonic sensing probe as a mobility aid for the blind. Ultrasonics April-
June.
Kay, L., (1974). A sonar aid to enhance spatial perception of the blind : Engineering design
and evaluation. Radio and Electronic Engineer 44, 605-627.
Meijer, P., (1992). An experimental system for auditory image representations. IEEE
Transactions on Biomedical Engineering 39, 112-121.
Moore, B. C. J. (2004). An introduction to the psychology of hearing, Elsevier Academic Press,
London, UK
Millar, S. (1994), Understanding & representing space, Clarendon Press, Oxford.
Miller, J., (2001), SLAB: A software-based real-time virtual acoustic environment rendering
system. In: Proceedings of the 2001 International Conference on Auditory Display, Espoo,
Finland.
Pelczynski, P., Strumillo, P., Bujacz, M., Formant-based speech synthesis in auditory
presentation of 3D scene elements to the blind, ACOUSTICS High Tatras 2006 -
33rd International Acoustical Conference - EAA Symposium, Štrbské Pleso, Slovakia,
October 4th - 6th, 2006, 346-349.
Skulimowski, P., Bujacz, M., Strumillo, P., (2009). Image Processing & Communications
Challenges. Academy Publishing House EXIT, Warsaw, Ch. Detection and
Parameter Estimation of Objects in a 3D Scene. 308-316
Skulimowski, P. & Strumillo, P. (2007). Obstacle localization in 3D scenes from stereoscopic
sequences. Proc. of the 15th European Signal Processing Conference (EUSIPCO 2007),
September 3-7, Poznań, Poland, 2095–2099
Skulimowski, P. & Strumillo, P. (2008). Refinement of depth from stereo camera ego-motion
parameters, Electronics Letters, vol. 44, no. 12, 729–730
Strumillo, P.; Pelczynski, P.; Bujacz, M. & Pec, M. (2006). Space perception by means of
acoustic images: an electronic travel aid for the blind, ACOUSTICS High Tatras 06 -
33rd International Acoustical Conference – EAA Symposium, Štrbské Pleso, Slovakia,
October 4th – 6th, 2006, 296–299
15
Virtual Moving Sound Source
Localization through Headphones
Larisa Dunai, Guillermo Peris-Fajarnés,
Teresa Magal-Royo, Beatriz Defez and Victor Santiago Praderas
Universitat Politécnica de València
Spain
1. Introduction
Humans are able to detect, identify and localize the sound source around them, to roughly
estimate the direction and distance of the sound source, the static or moving sounds and the
presence of an obstacle or a wall [Fay and Popper, 2005]. Sound source localization and the
importance of acoustical cues, has been studied during many years [Brungart et al., 1999]. Lord
Rayleigh in his “duplex theory” presented the foundations of the modern research on sound
localization [Stutt, 1907], introducing the basic mechanisms of localization. Blauert defined the
localization as “the law or rule by which the location of an auditory event (e.g., its direction
and distance) is related to a specific attribute or attributes of a sound event” [Blauert, 1997].
A great contribution on sound localization plays the acoustical cues, Interaural Time
Difference ITD and Interaural Level Diference ILD, torso and pinnae (Brungart et al., 1999),
[Bruce, 1959]. [Kim et al., 2001] confirm that the Head Related Transfer Functions (HRTFs)
which represent the transfer characteristics of the sound source in a free field to the listener
external ear [Blauert, 1997]), are crucial for sound source localization.
An important role in the human life plays the moving sound localization [Al’tman et al., 2005].
In the case of a moving source, changes in the sound properties appear due to the influence of
the sound source speed or due to the speed of the used program for sound emission.
Several research have been done on static sound localization using headphones [Wenzel et
al., 1993], [Blauert, 1997] but few for moving sound source localization. It is well known that
on localization via headphones, the sounds are localized inside the head [Junius et al., 2007],
known as “lateralization”. Previous studies [Hartmann and Wittenberg, 1996] in their
research on sound localization, showed that sound externalization via headphones can be
achieved using individual HRTFs, which help listeners to localize the sound out in space
[Kulkani et al., 1998], [Versenyi, 2007]. Great results have been achieved with the individual
HRTFs, which are artificially generated and measured on a dummy head or taken from
another listener. Due to those HRTFs, the convolved sounds are localized as real sounds
[Kistler et al., 1996], [Wenzel, 1992].
This chapter presents several experiments on sound source localization. Two experiments
are developed using monaural clicks in order to verify the influence of the Inter-click
interval on sound localization accuracy.
In the first of these experiments [Dunai et al., 2009] the localization of the position of a single
sound and a train of sounds was carried out for different inter-click intervals (ICIs). The
Advances in Sound Localization
270
initial sound was a monaural delta sound of 5ms processed by HRTFs filter. The ICIs were
varying from 10ms to 100ms. The listeners were asked to inform what they listened, the
number and the provenience of the listened sound and also if there was any difference
between them, evaluating the perceived position of the sound (“Left”, “Right” or “Centre”).
It was proven that the accurateness in the response improves with the increase of the length
of ICI. Moreover, the train of clicks was localized better than the single click due to the
longer time to listen and perceive the sound provenience.
In the second study (Dunai et al., 2009), the real object localization based on sensory system
and acoustical signals was carried out via a cognitive aid system for blind people (CASBliP).
In this research, the blind users were walking along a 14m labyrinth based on four pairs of
soft columns should localize the columns and avoid them. The average time of sound
externalization and object detection was 3,59 min. The device showed no definitive results
due to the acoustical signal speed, which required improvements.
2. Experiment
2.1 Experiment 1. A pair of sounds and a train of sounds source localization
In the Experiment 1, the localization of the static sound source was studied; the saltation
perception on the inter-click presence was also analyzed. The experiment is based on
monaural click presented at different inter-click intervals (ICI), from 10ms to 100ms. Two
types of sounds single click and train of clicks are generated and thereafter tested at
different inter-click intervals. At short inter-click intervals, the clicks were perceived as a
blur of clicks having a buzzy quality. Moreover, it was proven that the accurateness in the
response improves with the increase of the length of ICI.
The present results imply the usefulness of the inter-click interval in estimating the
perceptual accuracy. An important benefit of this task is that this enables a careful
examination of the sound source perception threshold. This allows detecting, localizing and
dividing with a high accuracy the sounds in the environment.
Sound sample
Sound source positions used for stimulus presentation in this experiment were generated
for a horizontal frontal plane. A sound of 5ms duration was generated with Above Audition
software.
In the first case, the generated sound with duration of 5ms was used as spatial sound and in
the second case; the sound was multiplied by six, becoming a train of sound with duration
of 30ms.
The sound has been convolved using Head Related Transfer Functions (HRTFs). It is known
that the HRTFs are very important for sound localization, because they express the sound
pressure at the listener eardrum over the whole frequency range. In the present study, the
HRTFs were generated at 80dB at a frequency of 44100 Hz and processed by a computer for
the frontal plane, for a distance of 2 m, with azimuth of 64º (32º at the left side of the user
and 32º at the right side of the user).
In the experiments the sound were presented randomly in pairs Left-Right and Right-Left,
delivered using Matlab version 7.0, on an Acer laptop computer.
Test participants
Ten volunteers, 4 females and 6 males, age range 27-40 years, average 33,5 participate in this
experiment. Each subject reported to have normal hearing, they did not reported any
Virtual Moving Sound Source Localization through Headphones
271
hearing deficiencies. All of them were supposed to other acoustical experiments with
computer and acoustical mobility devices.
Procedure
The experiment was carried out in a single session. The session consisted of two runs, one
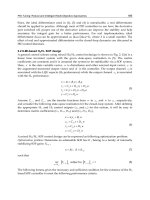
for a single sound and one for a train of sound. Each run was based on six sounds. Fig.1
shows the schematic presentation of the sound: a) shows the monaural sound in which, the
click comes from (Left) L→R (Right) and R→L, with randomly varying ICIs; b) shows the
train of sound, where the presentation procedure is the same as for the single sound, the
sound come from L→R and R→L, with randomly varying ICIs. Different interclick intervals
(ICI), from 10 ms to 100 ms were used (10ms, 12ms, 25ms, 50ms and 100ms).
Localization test were carried out in a chamber of 4,8m x 2,5m x 12m, where external sounds
were present.
Since the experiments described in this chapter were focused on examining the perception
in human listeners, it was important to be able to measure spatial capabilities in an accurate
and objective way. For the localization test, subject localized auditory sound presented in
the headphones, telling the direction of the listened sound. In both cases the experiment
begins with various exercises where the subjects are able to hear the sound and train of
sound, separately, firstly the left one and afterwards the right one, continuing with the six
sounds delivered by the program randomly. Afterwards the subject completed the all six
sounds, the new exercises were presented of the combination “Left-Right” and “Right-Left”.
For the localization tests, listeners were sitting comfortably in a chair in front of a computer.
Before starting the test, the listeners received written and oral instructions and explanations
of the procedure. They were asked to pay especial attention and to be concentrated on the
experiment.
Before localization experiments, subjects had a training protocol to become familiar with the
localization. This protocol included the speech pointing techniques, which requires that the
subject verbally informs the evaluator about the perceived localization of a sound. During
the experiment, since the subject had not access to the computer screen, the tendency of
capturing the sound with the eyes was eliminated.
During the test, the subjects were supposed to listen through the headphones, model HD
201, twelve pairs of sounds; six pairs of single sound and six pairs of trains of sound “Left-
Right” and “Right-Left” at different ICIs, from 100 ms to 10 ms in a decreasing succession.
The sounds were delivered in a random position. The sound used in the experiment was the
same sound used in the testing procedure. The sound duration was brief enough, so that
listener could not make head movements during the sound presentation. Between each two
consecutive pair of sound, the decision time (Td) was computed; this was the time needed
for evaluating the sound (see Fig. 1).
The subjects were asked what they listened, the number and the provenience of the listened
sound and also if there was any difference between them. The subjects where allowed to
repeat them, if necessary, after they had evaluated the perceived position for each sound,
classifying them as “Left”, “Right” or possible “Centre”. Once the subject had selected a
response, a next pair of sound was presented. Each trial lasted approximately 2 min. The
average time per subject for all experiment was around 35 min.
Some distraction cues as: environmental noises, draw away seeing or hearing someone-
since the subject remained with opened eyes influenced on the experimental sound source
perception and results. Because of this reason, the subjects were allowed to make judgments
about the source location independently.
Advances in Sound Localization
272
Fig. 1. Schematic presentation of the sound. In both situations the sound is of 5ms. In the
first case, the sound has been listened at the different interclick intervals ICI separated by a
decision time Td. In the second case, the sound has been substituted by a train of six sound.
The results were collected by the evaluator and introduced manually into a previously
prepared table. After the test, localization performances were examined using the analyses
described in the following section.
Results
The results from the Experiment 1 were collected for data analysis. Localization performances
summary statistics for each subject are listed in Table 1. The graphical user interface was
generated by Excel in linear standard model. Subject response was plotted in relation to the
Inter-click Interval. The main data for all subjects is presented in Fig. 2 with an error of 5%.
The perception of the single and train of sound and the perceived position of the sound
pairs “Left-Right” and “Right-Left” were analyzed. Both factors as well as the interaction
with the ICIs were significant.
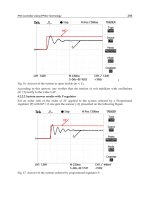
Fig. 2 shows that the perception of the sound source position decreases when ICIs does. For
avoiding errors, the tests results were registered up to an ICI of 10ms. Because ICI was
enough short, the sound were perceived as a single entity moving from one ear to another or
from one ear to the centre having a buzzing quality.
In the case of the single pair of sound at ICI of 12ms, because the length of the sound and the
length of the ICI were too short, the subjects could not distinguish clearly the sound
corresponding to the pairs “Left-Right” and “Right-Left”.
When comparing the perception of the single sound with the perception of the train of sound
Fig. 2 a), a great continuity of the sound position across almost the entire range of ICIs was
detected. In other words, the perception of the sound position was stronger for the train of
sound. This effect may be a result of the better localization associated with the sound.
2
()
(1)
x
x
n
−
−
∑
(1)
For ICIs between 25 and 10ms, the subjects perceive the “Right-Left” pair of sounds with a
higher precision than that of pairs “Left-Right” for single sound and train of sound.
1
s
t
Left
sound
1
s
t
Right
sound
ICI
1
s
t
Left train
of sound
1
s
t
Right train
of sound
ICI
2
nd
Left
sound
2
nd
Right
sound
ICI
6
th
Left
sound
6
th
Right
sound
ICI
6
th
Left train
of sound
6
th
Right train
of sound
ICI
Single monaural
sound
Train of six
monaural
sound
Td
Td
Virtual Moving Sound Source Localization through Headphones
273
In other case, for ICIs of 50ms, the perception of the pair of single sound “Right-Left” is
higher than the perception of the pair Left-Right. In the case of the train of sound, the
perception results are equivalent for both pairs Left-Right and Right-Left.
When trying to explain the sound source perception threshold, we perceive the perception
of the saltation illusion. With shorter ICIs, a blur of sound were perceived, in contrast with
the individual sound at longer ICIs. As the psychologist Gestalt noted, the perceptual
system scrambles for the simplest interpretation of the complex stimuli presented in the real
world. Therefore, the studies were based on analyzing and proving that, grouping the
sound, the sound source is better perceived and localized.
For longer ICIs, this procedure is not so important, since each sound can be identified and
localized. The present results demonstrate the usefulness of the inter-click interval in
estimating the perceptual accuracy. A possible benefit of this task is enabling a careful
examination of the sound source perception threshold. This allows detecting, localizing and
dividing with high accuracy the sounds in the environment.
Sound perception in % Train of sound perception in %
interclick
ms
Azimuth
-30º
azimuth
30º
interclick
ms
Azimuth
-30º
azimuth
30º
100 100% 100% 100 100% 100%
50 90% 86% 50 100% 100%
25 80% 90% 25 88% 96%
12 83% 95% 12 76% 79%
10 88% 86% 10 75% 86%
8 100% 95% 8 100% 96%
6 100% 95% 6 85% 93%
5 100% 92% 5 100% 95%
1 100% 100% 1 100% 100%
Table 1. Localization performance summary statistics for all subjects (P1-P9) in frontal field.
The percentage of the perception experiment is calculated on the basis of the six delivered
sounds.
2.1 Experiment 2. The influence of the inter-click interval on moving sound source
localization tests
In the Experiment 2, an analysis of moving sound source localization via headphones is
presented. Also, the influence of the inter-click interval on this localization is studied. The
experimental sound consisted of a short delta sound of 5ms, generated for the horizontal
frontal plane, for distances from 0,5m to 5m and azimuth of 32º to both left and right sides,
relative to the middle line of the listener head, which were convolved with individual
HRTFs. The results indicate that the best accurate localization was achieved for the ICI of
150ms. Comparing the localization accuracy in distance and azimuth, it is deduced that the
best results have been achieved for azimuth. The results show that the listeners are able to
extract accurately the distance and direction of the moving sound for higher inter-click
intervals.
Advances in Sound Localization
274
Fig. 2. Mean estimation of the click location: a) shows the sound perception at -30º (left side)
and +30º (right side); b) corresponds to the train of sound perception at -30º (left side) and
+30º (right side)
Subjects
Nine young subjects students with ages between 25 and 30 years and different gender, all of
them had normal vision and hearing abilities, were involved in the experiments. All
participants had normal distance estimation and good hearing abilities. They demonstrate a
correct perception of the sounds via headphones. A number P1-P9 identified the subjects.
All subjects participated in previous auditory experiments in the laboratory. Each
participant received a description of what was expected of him/her and about all
procedure. All participants passed the localization training and tests described below.
Stimuli and signal processing
A delta sound (click) of 2048 samples and sampling rate of 44.100 Hz was used. To obtain
the spatial sounds, the delta sound was convolved with Head-Related Transfer Function
(HRTF) filter measured for each 1º in azimuth (for 32º left and 32º right side of the user) at
60%
70%
80%
90%
100%
110%
120%
10050251210
ICI, ms
Perception, %
60%
70%
80%
90%
100%
110%
120%
100 50 25 12 10
Perception, %
ICI, ms
a)
b)
Virtual Moving Sound Source Localization through Headphones
275
each 1cm in distance. The distance range for the acoustical module covers from 0,5m to 5m,
an azimuth of 64º, and 64 sounding pixels per image at 2 frames per second.
Recording of Head-Relates Transfer Functions were carried out in an anechoic chamber. The
HRTFs measurements system consist on a robotic and acquisition system. The robotic
system consists of an automated robotic arm, which includes a loudspeaker, and a rotating
chair on an anechoic chamber. A manikin was seated in the chair with a pair of miniature
microphones in the ears. In order to measure the transfer function from loudspeaker-
microphone as well as for headphone-microphone, the impulse response using Maximum
Length Binary Sequence (MLBS) was used. The impulse response was obtained by taking
the measured system output circular cross-correlation with the MLBS sequence.
Due to that the HRTF must be measured from the two ears, there is necessary to define the
two inputs and output signals. Lets x
1
(n) be the digital register of the sound that must be
reproduced by the speakerphone. Lets y
1
(n) be the final register recorded by the microphone
placed in one of the acoustic channels of the manikin or man, corresponding to the response
to x
1
(n). Similarly, let x
2
(n) be the sound to be reproduced through the headphone and y
2
(n)
the answer registered by the headphone, respectively for the second ear. The location of the
head in the room is assumed to be fixed and is not explicitly included in our explication.
In order to determine x
1
(n), it is necessary to generate a x
2
(n) such that the y
2
(n) is identical to
y
1
(n). In that way, we achieve that an acoustic stimulus generated from the speakerphone and
another generated by the headphones, produce the same results in the auditive channel of the
user or manikin. Therefore we obtain the same acoustical and spatial impression.
In order to obtain these stimuli, a digital filter which transforms the x
1
(n) into x
2
(n) has been
developed. In the transformed frequency domain, let be X
1
the representation of the x
1
(n)
and Y
1
the representation of the y
2
(n).
Then Y
1
, which is the registered response of the x
1
(n) reproduction, is:
11YXLFM
=
(1)
In (1), L represents the grouped transfer function of the speakerphone and all audio
reproduction system. F represents the transfer function of the environment situated between
the speakerphone and the additive channel (HRTF) and M represents the set of functions
composed by the microphone and the whole audio reproduction system.
The response registered by the microphone via headphones, when the x
2
(n) is reproduced,
can be expressed as follows:
22
YXHM
=
(2)
where H represents the transfer function of the headphone and all reproduction system to
the additive channel.
If Y
1
=Y
2
, isolating X
2
we obtain:
1
2
XLF
X
H
=
(3)
Then, for any measurement the digital filter will be defined as follows:
LF
T
H
=
(4)
Advances in Sound Localization
276
Therefore, it will filter the signal x
1
(n) and the resulting signal x
2
(n) will be reproduced by
the headphone; then the signal registered by the microphone, which is placed in the auditive
channel must be y
1
(n). This signal must be equal to the signal x
1
(n), which is reproduced by
the speakerphone.
The filter described by (4) describes the speakerphone for a single spatial position for only
one ear. For both ears two filters are required for the simulation of each signal source for a
determined spatial position.
Assuming that we measure the Y
1
and X
1
transfer functions for different spatial positions for
both ears at the same time, the Transfer Function speakerphone-microphone (G
LM
) is
defined as follows:
1
1
LM
Y
GLFM
X
=
=⋅⋅ (5)
Having the function given by (5) simultaneously for both ears, we measure both transfer
functions Y
2
and X
2
, on which the transfer functions headphone-microphone G
HM
, are defined:
2
2
HM
Y
GHM
X
=
=⋅ (6)
The necessary filters for the sound simulation are obtained from the function speakerphone-
microphone G
LM
for each ear, as the reverse of the function headphone-microphone G
HM
of
the same ear (see (4)). So, for both ears:
LM
HM
G
LFM LF
T
GHMH
⋅
⋅⋅
== =
⋅
(7)
For both transfer function speakerphone-microphone G
LM
and headphone-microphone G
HM
,
the measurement technique of the impulse response Maximum Length Binary Responses
MLBS was applied with later crossed correlation between the system answer and input of
the MLBS.
The impulse response of the system can be obtained through circular crossed correlation
between input MLBS of the system and the output answer. This is, if we apply to the system
an MLBS, which will called s(n), and measure the output the signal y(n) during the time
which MLBS lasts, the impulse response h(n) will be defined as follows:
1
0
1
() () () () () ( )
1
L
sy
k
hn n sn yn sk yn k
L
−
=
=
Ω=Φ= ⋅+
+
∑
(8)
where Φ represents the circular or periodic crossed correlation operation, corrupted by the
aliasing time, and not a pure impulse response.
In the event that the sequence is enough long, then the resultant aliasing can be rejected.
Due to that, the direct implementation of (8) for long sound sequences require high
computational time, the equivalent between the correlation and periodic crossed correlation
has been used. The obtained information was passed into the frequency domain, where the
convolution operation is translated into a vector multiplication.
After this, the results were passed into the frequency domain, where the convolution
operation is translated into a vector multiplication.
Virtual Moving Sound Source Localization through Headphones
277
1
() () ( ) ()
1
an bn a n bn
L
Φ= −∗
+
(9)
where the inversion of the first sequence is circular, similar to the convolution. Nevertheless,
the computational time results to be enough high, due to that the used Fast Fourier
Transform (FFT) have a length of 2
k
-1. In order to obtain an increasing performance in time
processing the FFT length has to be (2
k
-1)
2
.
Finally, using the Fast Hadamard Transform (FHF), it was possible to reduce the
computational time between the two magnitudes. The h(n) is then calculated as follows:
()
()
{
}
22 111
1
() ()
10
L
hn P S H S Pyn
Ls
+
⎡
⎤
=
⎣
⎦
+
⎡⎤
⎣⎦
(10)
In this case to the system has been applied a MLBS s(n) with a length L, after what the result
y(n) was registered. The matrix P is the permutation matrix, the matrix S is matrix of
rescaling, the H
L+1
is the matrix Hadamard of degree L+1. After the HRTFs were measured,
with the equipment shown in figure 3.13, it was verified if the HRTFs are realistic and
externalized. For this purpose, an off-line localization procedure was carried out.
The output signals (the HRTF) are sampled at 22050Hz and a length of 46ms (8192 bit).
The HRTFs were measured for the horizontal frontal plane at the ear level from 0,5 to 5m in
distance and in azimuth between 32º left and 32º right with respect to the centre of the
listener head (measurements at every 1º). Fig. 4 shows the graphical representation of the
sound reproduction.
Fig. 4. Method for sound processing and reproduction
HRTF Sound
Convolution
ICI
16 channel
reproduction
Advances in Sound Localization
278
Equipment
A Huron system with 80 analogue outputs, eight analogue inputs and eight DSPs 56002, and
a computer for off-line sound processing was used for the sound generation and processing.
SENNHEISER headphones models HD 201 were used to deliver the acoustical information.
MATLAB 7.0 was used as experimental software. The resultant graphical sound trajectory
for each experiment was displayed on a separate window and saved for off-line processing.
All experiments run on ACER Aspire 5610 computer.
Procedure
The goal of the experiments is to analyze the localization of a moving sound source via
headphones and to see how the inter-click interval (ICI) influences the sound localization quality.
The comparison between the localization performances enables to evaluate the importance
of the inter-click interval parameter for its use in sound localization and acoustical
navigation systems.
The movement of the sound source was achieved by switching the convolved sound for a
frontal plane at the eyes level at increasing distances from 0,5 to 5m (1 cm increase) and for
azimuth between 32º right and 32º left (1º increase) with respect the middle of the head. The
sounds were delivered for five inter-click intervals [200ms, 150ms, 100ms, 75ms and 50ms].
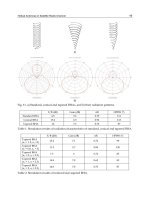
Fig. 5 shows one of the trajectories the sound was running. Four different trajectories were
created. The delivered trajectory was selected randomly by the computer when the
experiment starts.
Before starting the experiment, the training exercises were carried out; the objective and the
procedure of the experiment were explained to each individual participant. One sound was
delivered for all five ICIs, where the participants were able to see graphically the listened
sound trajectory (See Fig. 5). In order to proceed with the test and experiment, the
Fig. 5. Sound trajectory example, direction from left to right. The x axis represents the
azimuth where the 0 is the centre of the head, which is 0º. The -2.5 is the -32º at left side of
the head and 2.5 respectively is 32º at the right side of the head. The y axis represents the
distance from 0 to 5m
Virtual Moving Sound Source Localization through Headphones
279
participants were asked to seat comfortably in the chair in front of a computer. After reading
and testing the training exercises, the participants were supposed to carry out the experiment.
A sound at a specific ICI was delivered by the computer via headphones. During the
experiment, the participants were free to move. Nevertheless, they were required to move
the less possible and to be concentrated on the sound, in order to create a plane of the sound
route in the imagination. The test was performed both with open eyes and with closed eyes
depending on the participant wishes. In the case of the closed eyes, there was a limitation of
effects of the visual inputs. Due to this, the participant achieved a better interpretation of the
trajectory image.
The participants were asked to carefully hear the sound and draw the listened trajectory in a
paper. They were allowed to repeat the sound if it was necessary. All the participants asked
to repeat the sound at least three times. Each participant was supposed to have five trials,
one for each ICI. Only one sound trajectory was used per participant for all five ICIs. For all
participants, the experiment started with the ICI of 200ms, decreasing it progressively up to
50ms.
After the experiment the participants commented the perceived sound trajectory and they
compared the listened sound for each ICI.
Results
The moving sound source localization is an important factor for the navigation task
improvement. The main variables analyzed in this paper were the moving sound source
localization and the inter-click interval ICI [200, 150, 100, 75, and 50ms]. The study analyzes
the interaction between these variables in measurements of distance and azimuth.
Generally, no significant differences on the results were registered between participants.
However, great difference was found in the sound localization between higher and lowers
inter-click intervals.
The maximum displacement in distance is 1,26m for an ICI of 50ms and the minimum
displacement was 0,42m for an ICI of 150ms, the maximum displacement in azimuth was
11,4º for an ICI of 50ms and the minimum 0,71º for an ICI of 150ms.
Average results of sound localization in azimuth and distance as a function of the inter-click
interval are shown in Fig. 6. Best results have been achieved for greater ICIs, due to the time
needed by the brain to perceive and process the received information. Because the time
between two sounds is higher, the sound is perceived as jumping from one position to
another from left to right in equal steps. For the ICI of 200ms, the sound was not perceived
as a moving sound, but rather as a jumping sound from location to location. However, for
the ICIs lower than 100ms the sound was perceived as a moving sound from the left to right,
but there was enough difference between the original sound trajectory and the perceived
one. The participants had great difficulties to perceive the exact distance and azimuth,
because the sound was delivered too fast. Moreover, when the sound trajectory had
multiple turning points on a small portion of the space, the participants perceived this
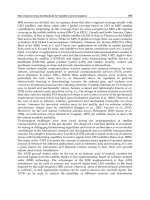
portion as one turn-return way. Fig. 7 represents a specific case, corresponding to one of the
participants; it shows the moving sound localization at four ICIs. The red colour represents
the listened sound trajectory drawn by the participant. The grey colour represents the real
sound trajectory drawn by the computer. The x axis represents the azimuth where the 0
value is the centre of the head, the negative values are the values at the left side of the head,
whereas the values at the right side of 0 represent the azimuth values at the right side of the
human head. The -2.5 represents the 32º at left side of the head and 2.5 the 32º at the right
side of the head. The y axis represents the distance from 0 to 5m.
Advances in Sound Localization
280
Fig. 6. Average displacements in azimuth and distance for all participants
In some cases, the participants perceived the sound trajectory as an approximate straight
line when the inter-click interval was 50ms. Even repeating several times the experiment,
the participants were confused regarding the localization of the moving sound. They
commented “the sound moves too fast and I feel that it is running from left to right in a
straight line”. Despite listeners were not able to localize the moving sound source at lower
inter-click intervals so well as they were able to localize the moving sound for greater inter-
click intervals, they were able to judge about the sound position in azimuth and distance.
Various factors as drawing abilities (how the participants can accurately draw), sound
interpretation (how the participants can interpret the heard sounds, by colours, by image
etc.), the used hearing methods (with closed or opened eyes), the external noises, etc.,
influenced the experiment results. Despite all participants were informed about the use of
one sound per participant for all ICIs, they draw the trajectories at different distances. This
error appears because of the participant drawing ability; it is not so easy to interpret
graphically what is listened or the image the brain creates if there is not practice on that. For
some of participants, great concentration and relaxation was required, to be able to correctly
perceive the sounds.
0
3
6
200 150 100 75 50
ICI, m s
º
0,50
0,60
0,70
0,80
200 150 100 75 50
ICI, m s
c
m
Virtual Moving Sound Source Localization through Headphones
281
Fig. 7. Sound trajectory for one participant for the ICIs of 50ms and 100ms. The black colour
represents the heard sound trajectory drawn by the participant; the green colour represents
the real sound trajectory drawn by the computer. The x axes represent the azimuth, in which
the 0 value is the centre of the head, the negative value are the values at the left side of the
head and the values at the right side of 0 represent the azimuth values at the right side of the
human head. -2.5 represents the 32º at left side of the head and 2.5 respectively the 32º at the
right side of the head. The y axis represents the distance from 0 to 5m.
Multiple observations on training sound trajectory were given to participants about how to
perceive the sound and to be confident of their answer. Two participants were excluded
from the main analysis due to the difficulties in localizing the sound. The participants
experienced the moving sound localization as a straight line for all inter-click intervals.
3. Conclusion
In the present chapter two sets of experiments are described according to the examined spatial
performance involving simple broad-band stimuli. Both experiments measured how well
single and train of static and moving sounds are localized in laboratory conditions. These
experiments demonstrated that sound source is essential for accurate three-dimensional
localization. The approach was to present sounds overlapped in time in order to observe the
performance in localization, in order to see how time delay between two sounds (ICI inter-
click interval) influences on sound source localization. From the first experiment it was found
that better localization performance was achieved for trains of sounds at an ICI of 100ms. If
analyzing the localization results at the left and right side of the human head, it must mention
that improved results were obtained at the left side for the single click and at the right side for
the train of clicks. At short inter-click intervals, the train of clicks was perceived as a blur of
clicks. At short inter-click intervals the single clicks was perceived as one click, there were not
perceived the difference between the first click and the second one. In this case only the first
click was perceived, the second click was perceived as a week eco. Moreover, the sound
perception threshold was studied. In the second study the localization of a moving sound
source both in distance and azimuth was analyzed. The results demonstrate that the best
results were achieved for an inter-click interval ICI of 150ms. When comparing the localization
accuracy in distance and azimuth, better results were obtained in azimuth. The maximum
error in azimuth is of 11,4º at the ICI of 50ms. The disadvantages of the results at short ICI’s are
Advances in Sound Localization
282
due to that the total time of the sound run is very short, that prevent the user to perceive all the
sound coordinates. Regarding the large ICI’s, the saltation from one click to another don not
allows the user to make the connection between the two clicks. From this motive the user
perceive the sounds as diffuse. Spatial cues such as interaural time difference ITD and
interaural level difference ILD play an important role in spatial localization due to their
attribution on the azimuthal sound localization. They arise due to the separation of the two
ears, and provide information about the lateral position of the sound.
4. References
Al`tman Ya.A.; Gurfinkel V.S.; Varyagina O.V.; Levik Yu.S. (2005). The effect of moving
sound images on postural responses and the head rotation illusion in humans,
Neuroscience and Behavioral Physiology, 35 (1), 103-106
Blauert J. (1997). Spatial Hearing: The Psychophysics of Human Sound Localization, revised
edn, The MI Press, Cambridge, MA, USA,
Bruce H., Hirsh D. and I.J., (1959). Auditory Localization of Clicks J. Acoust. Soc.Am., 31(4),
486-492
Brungart D.S Nathaniel I., W. R. Raibiowitz. (1999). Auditory localization of nearby sources
II. Localization of a broadband source, J. Acoust. Soc.Am. 106 (4), 1956-1968
1
Brungart D.S., Rabinowitz W. M. (1999). Auditory localization of nearby sources. Head-
related transfer functions, J. Acoust. Soc.Am. 106(3), 1465-1479
Dunai L., Peris F G , Defez B. G., Ortigosa A.N., Brusola S F. (2009). Perception of the sound
source position, Applied Physics Journal, (3), 448-451
1
Dunai L., Peris F G , Defez B. G., Ortigosa A.N., (2009). Acoustical Navigation Sysyem for
Visual Impaired People, LivingAll European Conference
Dunai L., Peris Fajarnes G., Defez Garcia B., Santiago Praderas V., Dunai I., (2010), The
influence of the Inter-Click Interval on moving sound source localization for
navigation systems, Applied Physics Journal, (3), 370-375
Hartmann W.M., Wittenberg A., (1996). On the externalization of sound images, J. Acoust.
Soc.Am. 99 (6): 3678-3688
Junius D., Riedel H., Kollmeier B., (2007). The influence of externalization and spatial cues
on the generation of auditory brainstem responses and middle latency responses,
Hearing Research 225, 91-104
Kim H.Y., Suzuki Y, Sh. Takane, Sone T. (2001). Control of auditory distance based on the
auditory parallax model, Applied Acoustics 62, 245-270
Kistler D.J., Wightman F.L., (1996). A model of head-related transfer functions based on
principal components analysis and minimum-phase reconstruction a, b), J. Acoust.
Soc.Am. 91 (3), 1637-1647
Kulkani A., Colburn S.H., (1998). Role of spectral detail in sound-source localization,
Nature, 396, 747-749
Strutt J.W. (1907). On our perception of sound direction, Philos. Mag.; Vol 13, 214.232
Versenyi G. (2007). Localization in a Head-Related Transfer Function-based virtual audio
sysnthesis using additional high-pass and low-pass filtering of sound sources,
Acoust. Science & Technology, 28 (4), 244-250
Wenzel E., Arruda M., Kistler D., Foster S. (1993). Localization using non-individualized
head-related transfer functions, J. Acoust. Soc.Am. 94, 111-123
Wenzel E.M., (1992). Localization in virtual acoustic display, Presence Telop Virt. Environ. 1,
80-107
16
Unilateral Versus Bilateral
Hearing Aid Fittings
Monique Boymans and Wouter A. Dreschler
Academic Medical Centre, Department of Clinical
and Experimental Audiology, Amsterdam
The Netherlands
1. Introduction
This study is designed to assess the added value of fitting a second hearing aid: to evaluate
the current fitting practices, to assess the effect on spatial hearing, to evaluate this
objectively, and to predict a positive effect from diagnostic tests.
The reasons and/or criteria for fitting one or two hearing aids are not always obvious. Many
considerations, as localization, seem to play a role both for the hearing-impaired person and
for the audiologist. A large asymmetry in hearing loss can be a contra indication for a
bilateral fitting, but it is not clear to which limits. The key question in section two is: What
are current fitting practices in a large (multi-centre) clinical population and which are the
audiometric characteristics of subjects fitted with one or two hearing aids? Section three
describes some recent findings in the literature. Section four describes the effects on spatial
hearing that can be assessed in the individual patient. Section five addresses the issue
whether a successful bilateral fitting can be predicted from apriori tests.
2. What are the current fitting practices
In order to find current fitting practices a large retrospective study (Boymans et al.2006,
2009) was conducted. In this study case history data, audiometric, and rehabilitation data,
and subjective fitting results were evaluated in a population of 1000 subjects using modern
hearing aids, included from eight Audiological Centers in the Netherlands. All centers are
members of the foundation PACT, the Platform for Audiological and Clinical Testing and
they are representative for Audiological Centers in the Netherlands. PACT was established
as a platform for independent clinical research related to the use of hearing aids. Each center
selected 125 consecutively hearing aid fittings and analyzed the clinical files of these
subjects.
An extensive questionnaire on long-term outcome measures was conducted. This
questionnaire is called the AVETA (the Amsterdam questionnaire for unilateral and bilateral
hearing aid fittings). 505 questionnaires were returned from 1000 files/subjects described
above after at least two years of hearing aid use. The questionnaire consisted of different
components. Besides some general questions parts of existing questionnaires were included
like the Hearing Handicap and Disability Inventory (HHDI, van den Brink, 1995), the
Amsterdam Inventory of Auditory Disability and Handicap (AIADH, Kramer et al., 1995),
Advances in Sound Localization
284
Abreviated Profile of Hearing Aid Benefit (APHAB, Cox et al., 1995), and the International
Outcome Inventory for Hearing Aids (IOI-HA, Cox et al., 2000). In addition we asked about
the reasons why the patients used one or two hearing aids. The AIADH and APHAB
questions were asked for the situation without a hearing aid, with one hearing aid, and with
two hearing aids (if applicable). On the basis of 28 questions, 7 categories were composed in
which auditory functioning was measured in the different situations: detection of sounds,
discrimination or recognition of sounds, speech intelligibility in quiet, speech intelligibility
in noise, speech intelligibility in reverberation, directional hearing or localization, and
comfort of loud sounds. For each patient and each category the mean scores were calculated
only when more than 50% of the questions were available. The total auditory function is the
average result of all categories.
The subjective results of the populations with unilateral and bilateral hearing aids were
compared with the case-history and audiometric data from the clinical files.
2.1 Percentage bilateral
In our sample of 1000 subjects, 587 Subjects were fitted with two hearing aids (bilaterally).
413 Subjects were fitted with one hearing aid, but in 7 of these subjects a CROS or biCROS
fitting was applied. The latter fittings were regarded as unilateral fittings, because the sound
presentation was to one ear only (in all of these subjects the hearing loss at the better ear was
worse than 30 dB (HL).
2.2 Effects of age
Age appeared not a factor of importance with respect to the distribution of bilateral and
unilateral fittings: about 60% of every age decade was fitted bilaterally.
2.3 Effects of hearing loss
Figure 1 shows the absolute numbers of unilateral and bilateral fittings as a function of the
average hearing loss at the better ear. For small hearing losses relatively more unilateral
fittings than bilateral fittings were found. For larger hearing losses more bilateral fittings
were found, ranging from 40% to 69%.
There is a trend that patients with small hearing losses have a preference for unilateral
fittings at the poorer ear, while patients with larger hearing losses have a preference for
unilateral fittings at the better ear.
2.4 Effects of asymmetry
Figure 2 represents the absolute difference between both ears for the groups with unilateral
and bilateral fittings. Most bilaterally fitted patients had a rather symmetric hearing loss
(92% had inter aural differences up to 20 dB) but bilateral fittings were also found for
asymmetrical losses with interaural differences up to 30-40 dB. The average asymmetry
between both ears for unilateral fittings was 22.2 dB (±23.0) and for the bilateral fittings 8.0
dB (±8.7).
In the unilateral fitted group 44 % of the hearing losses was symmetrical (± 10dB), and in
65% of the remaining cases the hearing aid was fitted to the better ear.
There was a trend that a large asymmetry in pure-tone audiogram went along with a large
asymmetry in maximum speech discrimination. But there was also a lot of scatter.
Sometimes a small asymmetry in pure-tone audiogram went along with a large asymmetry
Unilateral Versus Bilateral Hearing Aid Fittings
285
0
50
100
150
200
250
<25 25-35 35-45 45-55 55-65 65-75 75-85 85-95 95-105 105-115 >115
A
verage loss (1,2,4 kHz) better ear (dB)
number
unilateral
bilateral
Fig. 1. Cumulative histogram for the numbers of unilateral and bilateral fittings for the total
group for different hearing losses at the better ear (average 1,2,4 kHz).
0
5
10
15
20
25
30
35
40
45
0 102030405060708090100
Absolute difference between both ears in dB
Percentages (%)
unilateral fittings
bilateral fittings
Fig. 2. The absolute difference between the PTA’s (1,2,4 kHz) of both ears for the groups
with unilateral and bilateral fittings.
Advances in Sound Localization
286
in speech discrimination and vice versa. The trend that better-ear fittings were found for
larger asymmetries, was predominantly dependent on the asymmetry of the speech
discrimination.
In subgroups matched on gender, age, degree of hearing loss and audiometric asymmetry,
no significant differences between unilaterally fitted and bilaterally fitted participants were
found for hearing aid use, residual handicap, and satisfaction. However significant better
results were found for the bilaterally fitted group than for the unilaterally fitted group for
localization but also for detection and reverberation when the situation as fitted (bilateral or
unilateral) was compared to the unaided situation.
Significantly higher scores for localization and speech in noise were found for the group
with “high-end” hearing aids and they showed less residual handicap than the group with
more basic hearing aids. However this does not influence the long-term effects of bilateral
benefits.
The analysis of the relation between objective parameters from audiometric and case history
data and the subjective outcome measures of different subgroups showed that the
candidacy for bilateral fittings could not be predicted from age, maximum speech
intelligibility, employment, exposure to background noise, and social activities.
2.5 Reasons for choosing bilateral
Part of the questionnaires was devoted to reasons why the patient himself/herself chose for
one or two hearing aids. This was partly an open question.
In the group of 210 unilaterally fitted patients 410 times a reason was mentioned to choose
for a unilateral fitting. The choice of one hearing aid was frequently based on the residual
capacity of the other ear that was still relatively good (70x) or just worse (73x). Also using
the telephone with the other ear could be a reason to choose for one hearing aid (43x), or
problems with the own voice when fitted bilaterally (39x).
In the group of 295 bilaterally fitted patients 690 times a reason was mentioned to choose for
a bilateral fitting. Obviously, the quality of sound was mentioned as the most important
reason (150x). Other reasons like better localization, the balance between ears, and listening
to both sides occurred in about the same numbers (90x-110x). In only one case it was
mentioned that two hearing aids are chosen to stop further deprivation.
3. Some issues on bilateral fitting in literature
3.1 Deprivation
Deprivation effect was frequently described in the literature. When the hearing organ is
stimulated insufficiently, speech discrimination ability can deteriorate gradually. Hearing
impaired subjects fitted unilaterally and who have bilateral hearing losses may develop a
deprivation effect in the unaided ear.
Gelfand et al. (1987) described long-term effects of unilateral, bilateral or no amplification in
subjects with bilateral sensorineural hearing losses. They compared audiometric thresholds
and speech scores for phonetically balanced (PB) words with results obtained 4-17 years
later. Speech recognition scores were not significantly different in both ears for the
bilaterally fitted subjects and for the subjects not wearing hearing aids. However, in adults
with a unilateral hearing aid fitting, speech recognition performance for the unaided ear was
decreased significantly. This might be attributed to the deprivation effect. Silman et al.
(1984) also used the deprivation effect as starting point for their research. They investigated
Unilateral Versus Bilateral Hearing Aid Fittings
287
whether deprivation occurs and if it can be found after a long-term follow-up. 44 Adults
with bilateral sensorineural hearing losses were fitted unilaterally with hearing aids and 23
with bilateral aids. For all of these subjects data about auditory functioning were obtained
prior to the hearing aid evaluation, at the time of the hearing aid evaluation, and 4-5 years
after the evaluation. The most important result is that there were significant differences
between initial and follow-up speech-recognition scores only for the unaided ears of the
unilaterally fitted group. The authors indicate that this is an auditory deprivation effect that
was not found in the bilaterally fitted group. Age and hearing sensitivity factors were partial
led out. So, these factors could not have influenced the conclusions. A third study is the
work of Silman et al. (1993), who investigated both auditory deprivation and
acclimatisation. To investigate both aspects, 19 adult subjects were fitted unilaterally, 28
bilaterally and there were 19 matched control subjects. All of them had a bilaterally
symmetrical sensorineural hearing impairment. Their speech recognition ability was tested
by three different tests (W-22 CID, nonsense syllable test (NST), speech-reception-in-noise
(SRT)). They were initially tested six to twelve weeks following the hearing aid fitting. After
one year, the follow-up test was performed. The results of the latter test showed a slight
improvement in speech perception in the aided ear, in comparison with the initial test, and a
larger decrement in the unaided ear. This was visible in the W-22 test as well as in the NST
test. The improvements in the aided ear can be regarded as acclimatisation to amplification
at the aided ear; the decrements can be ascribed to auditory deprivation in the unaided ear.
The difference in magnitude suggests that more time is needed for a significant
acclimatisation effect in the aided ears of both the unilaterally and bilaterally aided groups
than for an auditory deprivation effect in the unaided ears of the unilaterally aided group.
The occurrence of deprivation is a reason to choose for two hearing aids. Hurley (1999)
found that word recognition scores deteriorated in the unaided ear after 5 years of hearing
aid use for 25% of the unilaterally fitted subjects. Although there can be some recovery from
deprivation, there are also cases known where the auditory deprivation effect is not
reversible (Gelfand, 1995). In contrast to other investigators, Jauhiainen (2001) found no
indications for the onset of auditory deprivation in unaided ears.
3.2 Horizontal localization
Improved localization is an advantage often mentioned in literature. It means that subjects
with two hearing aids are better capable of determining from what direction a sound arrives.
Punch et al. (1991) presented objective data of this advantage. Although their research is
focused on bilateral fitting strategies, they found that localization with bilateral hearing aids
was significantly superior to localization with unilateral hearing aids. Besides this objective
advantage, Stephens et al. (1991) found that an improvement of localization was one of the
reasons for people to choose for two hearing aids. Dreschler and Boymans (1994) tested
localization ability with one and two hearing aids in the same subjects. They found that the
localization ability was significantly better with two aids than with one. The results of Byrne et
al. (1992) showed that the bilateral advantage was also applicable for subjects with moderate to
severe hearing losses. In the experiments of Köbler et al. (2002) the subjects had to repeat
sentences and indicate the side where the sentence came from. The results for localization were
almost the same for the condition without hearing aids and with two hearing aids. A worse
result was found for the condition with only one hearing aid.
Advances in Sound Localization
288
In contrast with other studies, Vaughum-Jones et al. (1993) found that the localization ability
with two hearing aids was worse than with one hearing aid in some subjects. Their
conclusion was that subjects initially should be aided unilaterally and, if necessary, two aids
could be considered. Nabelek et al. (1980) investigated the effect of asymmetry in sound
pressure levels produced by signals coming from two loudspeakers. By changing the sound
pressure level (when the sound level at one side was increased by a certain amount of dB’s
(ΔL), the sound level at the other side was decreased by the same amount) the position of
the sound image in a lateralization experiment varied. In normal-hearing subjects, for sound
imagines on the midline, ΔL was zero. In unfitted hearing-impaired subjects with bilateral
hearing losses, ΔL was within the normal range. However, in aided balanced (equal gains)
and/or unbalanced conditions (10 dB disparity in gains) ΔL for midline images was outside
the normal range for some bilaterally fitted subjects. Based on these results, the authors
concluded that bilateral hearing aids could give a bias in the symmetry of the presentation
levels between both ears.
3.3 Speech perception
Speech intelligibility is one of the most important aspects for the hearing-impaired (if not
the most important). Most studies concentrate on the speech perception in noise and in
reverberation, because these are the most critical listening situations. The fitting of bilateral
hearing aids introduces two sources of improvement: the binaural squelch effect and the
removal of head-shadow effect. The squelch effect is the true binaural component and can
be described as the difference (in dB) in the critical signal-to-noise ratio (S/N ratio) between
monaural and binaural listening. However, the benefits of bilateral fittings for speech
intelligibility appear to be related primarily to the compensation of head-shadow effect.
When listening with two hearing aids, the difference (in dB) of the critical S/N ratio
between near-ear and far-ear listening is about 6-7 dB smaller than for listening with one aid
(Markides, 1982). Köbler et al. (2002) used a fixed S/N ratio of + 4dB, and they found a
statistically significant advantage of 5% in speech intelligibility when the subjects were fitted
bilaterally.
Festen and Plomp (1986) investigated the speech-reception threshold (SRT) in noise with
one and with two hearing aids in a group of 24 hearing-aid users. All subjects had a nearly
symmetrical hearing loss. The critical S/N ratio measured (the S/N ratio at 50 % speech
perception) proved to be hardly better with two hearing aids than with one hearing aid for
subjects with moderate hearing losses when speech and noise came from the frontal
direction. However, a significant benefit for bilaterally fitted hearing aids was present in
subjects with a pure tone average PTA
(.5,1,2 kHz)
larger than 60 dB, and when the speech and
noise sources were spatially separated. Day et al. (1988) also concluded that subjects with
severe hearing losses experience more benefit from two hearing aids than from one. They
used a free field audiovisual sentence-in-noise test (FASIN) in a reflection-free room.
Bronkhorst and Plomp (1989) showed that the binaural advantage due to head shadow
effect decreased when the hearing loss at high frequencies was more severe. So, the binaural
advantage depends on the audiometric configuration of the hearing loss. Also, Bronkhorst
and Plomp (1990) found that the binaural advantage due to a spatial separation of speech
and noise was smaller for small hearing losses than for large hearing losses. In contrast to
this study, Moore et al. (1992) showed a binaural advantage for almost all hearing losses
when speech and noise were separated. However, in Moore’s test design one ear was
blocked for the unilateral situation. This suggests that contribution of the unaided ear was
Unilateral Versus Bilateral Hearing Aid Fittings
289
mainly responsible for the fact that the benefit from bilateral fitting depends on the degree
of hearing loss.
Hawkins and Yacullo (1984) determined the S/N ratio necessary for a constant performance
level of word recognition for normal hearing and for hearing-impaired listeners with
bilaterally symmetrical mild-to-moderate sloping sensorineural hearing losses. The showed
a bilateral advantage (2-3 dB) and this appeared to be independent of microphone type and
reverberation time. In addition, there was a directionality advantage for the conditions with
directional microphones compared to the same conditions with omni-directional
microphones. These two advantages appeared to be additive (at least at the two shorter
reverberation times) because no interaction between the two was found. The results
indicated that the optimum performance in noise was achieved when hearing-impaired
subjects weared bilateral hearing aids with directional microphones in rooms with short
reverberation times.
Nabelek et al. (1981) measured the effects of unilateral and bilateral fittings for 15 subjects
with bilateral sensorineural hearing losses in noise and in reverberation. Word recognition
scores were significantly higher in bilateral listening modes. The advantage of bilateral
listening did not depend strongly on reverberation time or the use of hearing aids. The
scores improved by 7 % for a reverberation time of 0.1 s and 3.4 % for a reverberation time
of 0.5 s.
Leeuw and Dreschler (1991) found better critical S/N ratios for speech intelligibility in noise
(SRT-test) tested by normal-hearing listeners using two BTE hearing aids compared to one
BTE hearing aid (mean difference 2.5 dB). This implied a significant advantage of bilateral
over unilateral amplification, which proved to be dependent on the type of microphone
(omni-directional or directional) and the azimuth of the noise source, except for 0
0
. Contrary
to the results of Hawkins and Yacullo (1984), the bilateral advantage in speech intelligibility
was highest with directional microphones.
Dreschler and Boymans (1994) measured SRTs in noise with a spatial separation between
speech and noise in 12 hearing-impaired subjects. The results showed better SRT’s for the
subjects using bilateral hearing aids. Bilaterally fitted subjects made better use of the spatial
separation between speech and noise sources, resulting in 5dB better SRT thresholds. In
addition, they applied a dichotic discrimination task, where 3-syllable words and 4-syllable
numbers were presented simultaneously from +45
0
and –45
0
azimuths. Results only showed
a clear bilateral improvement in speech discrimination for the speech material that was
presented from the (unilaterally) unaided side. For words and for numbers, this effect was
statistically significant.
Not all studies support the findings of improved speech intelligibility. Allen et al. (2000)
found a significant evidence of binaural interference for 2 out of 48 elderly subjects (p<0.05).
Although the small number could easily be explained by normal variability in differences
between speech scores, this finding may indicate that for some individuals speech
intelligibility scores with two ears could be poorer than with the better ear alone. Bodden
(1997) argued that the binaural function of the ears should be restored by hearing aids.
When hearing loss deteriorates the binaural function, signal processing should be used as
compensation.
Markides (1982) found a difference of 2-3 dB as the bilateral advantage of two hearing aids.
His experiments confirm that the effect of the head-shadow compensation are more
important than the effect of binaural squelch.
Advances in Sound Localization
290
4. What are the effects on spatial hearing objectively and subjectively?
In the literature many advantages of bilateral hearing aid fittings, relative to unilateral
fittings, were shown, but it is difficult to obtain hard evidence about the benefits because of
methodological limitations. For the correct interpretation one has to keep in mind that
blinding was not possible, and that the selection of subjects in these studies partly
determined the findings.
In the retrospective study described in section 2 no clear information could be found about
the objective outcome measures. Therefore a prospective study was conducted. In that
study (Boymans et al 2006, 2008) the same Audiological centers participated. 214 Subjects
who were willing to start a trial period with bilateral hearing aids were included, 113 men
and 101 women with an average age of 66 years (range: 18-88). For 133 subjects the fitting
concerned a first fitting (62%). Most hearing losses were sensorineural hearing losses (79%).
The average hearing loss (500 - 4000 Hz) was 47 dB for the right ears as well as for the left
ears. After the trial period 200 subjects opted for a bilateral fitting (93%) and 14 subjects (7%)
for a unilateral fitting. The small unilateral group was not distinguishable from the bilateral
group on base of the asymmetry between both ears.
After the trial period that was long enough to decide between unilateral or bilateral fitting,
(trial durations vary individually from 4 weeks to several months), the evaluation tests were
conducted in order to evaluate the benefits of a second hearing aid, objectively.
To measure the effect of a second hearing aid a localization test was used as well as a Speech
Reception Threshold Test (SRT-test) with spatially separated sound sources. To perform
well on the latter test good localization ability was needed. Both measurements were
conducted with unilateral and bilateral conditions for all subjects. The ear of the unilaterally
fitted hearing aid was based on the preference of the individual subject.
4.1 Localization test
For the localization test 5 loudspeakers were used (-90º, -45º, 0º, +45º, +90º) at 75 cm from the
subject. Mixed sounds were randomly presented from different loudspeakers, for example:
music, children laughing, dogs barking. All sounds were presented at an average level of 65
dB(A) with adequate roving. Every 0.7 seconds a new sound was generated randomly from
the sounds that were not active at that time. The duration of the signals varied between 2.2
and 3.5 seconds. So, during the test three to five signals were presented simultaneously at
each moment. There was one target sound: the telephone bell. The subject had to indicate
where the target sound came from. The duration between the answer and the next stimuli
varied between 4 and 10 seconds. The order of presentations was randomized, in total six
measurements for each loudspeaker box. The test was performed with one and with two
hearing aids.
In table 1 the results of the unilateral condition (average for the right and the left side) and
the bilateral condition are shown. Localization was significantly better for the bilateral
condition than for the unilateral condition. Most errors were made within 45°. There was a
reduction of errors when a second hearing aid was added, for all degrees of errors (< 45
0
,
45
0
- 90
0
, >90
0
): a bilateral improvement of about 10% for the situation within 45 degrees and
13% for all situations together.
The benefit of a second hearing aid for localization proved to be rather independent of the
other data, but showed a small but significant correlation with total auditory functioning
(result derived from the AVETA questionnaire (r = 0.18; p< 0.05)).
Unilateral Versus Bilateral Hearing Aid Fittings
291
Unilateral (avg R/L) Bilateral
< 45 degrees 38,3 28,3
45 - 90 degrees 7,2 5,1
> 90 degrees 2,5 1,3
Total 48,0 34,7
Percentage of errors
Table 1. The percentage of errors (within 45 degrees, between 45-90 degrees, more than 90
degrees and the total errors) of the localization test, for the unilateral condition (2nd
column) and the bilateral condition (3rd column).
4.2 Speech intelligibility with spatially separated sound sources
A test with separated sound sources is a good simulation of daily conversations in real life.
Localization plays an important role during this test. Two loudspeakers were positioned in
front of the subject. The left loudspeaker was placed at -45 degrees and the right
loudspeaker at + 45 degrees at 75 cm from the subject. For both sides a Speech Reception
Threshold test was performed. The noise was an interfering (time-reversed) signal of the
other gender. In conditions with speech from the left-hand side, the interfering signal came
from the right-hand side and vice versa. The sentences (VU98, see Versfeld et.al., 2000) were
presented randomly from the left and the right hand side, however, the male and the female
speaker did not change from position during one list. So the subjects had to concentrate on
where the normal speech came from and had to repeat the sentence. The interfering noise
was presented at 65 dB(A).
Ipsi lateral side Contra lateral side
Unilateral -4,6 dB -1,6 dB
Bilateral -5,0 dB -4,9 dB
Critical S/N ratio in dB
Table 2. Average critical S/N ratio for the condition with the unilateral hearing aid at the
speech side (ipsi-lateral, 2nd column) and the hearing aid at the noise side (contra-lateral,
3rd column) and for the bilateral condition (n=214). Lower values indicate better results.
In table 2 the average critical signal to noise ratios are presented for the ipsi- and contra-
lateral condition, lower values represent better results. In this table the results with a female
and a male voice have been averaged.
The ipsi-lateral condition (second column) is the condition with the unilaterally fitted
hearing aid at the speech side; this is the most favorable condition. In the bilateral condition
the second hearing aid is added to the noise side. Nevertheless, an improvement of 0.4 dB is
shown. This is a purely binaural effect (binaural squelch effect).
The contra-lateral condition (third column) is the most difficult condition, with the
unilaterally fitted hearing aid at the noise side. In the bilateral condition the second hearing
aid is added to the speech side. An improvement of 3.3 dB is shown, due to the combined
effect of elimination of the head shadow and the effect of binaural squelch. Participants