Advances in Sound Localization part 14 ppt
Bạn đang xem bản rút gọn của tài liệu. Xem và tải ngay bản đầy đủ của tài liệu tại đây (2.65 MB, 40 trang )
Directional Hearing in Fishes
507
3. The TS has a columnar organization with similar best axes of horizontal motion tending
to be constant within vertical columns (Wubbles et al. 1995, Wubbles and Schellart
1998).
4. Some phase-locked units had phase angles of synchronization that did not vary with
the stimulus axis angle (except for the expected 180
o
shift at one angle), while others
showed a phase shift that varied continuously with stimulus angle over 360
o
(Wubbles
and Schellart 1997).
Wubbles and Schellart concluded that those and other results strongly supported the phase
model. They speculated that the rostro-caudally oriented units of the medial TS were
channels activated by swim bladder-dependent motion input, while the diversely oriented
units of the lateral TS represented direct motion input to the otolith organs. The utricle was
thought to be the otolith organ supplying the direct motion-dependent input because of its
horizontal orientation. The authors speculated that the units with synchronization angles
independent of stimulus direction represented pressure-dependent swim bladder inputs
while the units with variable synchronization phase angles represented direct motion
inputs. Wubbles and Schellart (1997) then concluded that “…the phase difference between
the(se) two unequivocally encodes the stimulus direction (0-360
o
)…” (i.e., solves the 180
o
ambiguity problem). This conclusion would be strengthened by a more clear and detailed
explanation for the direction-dependent variation in synchronization angle shown by some
units and by a testable theory for the final step that solves the 180
o
ambiguity.
8. Summary and conclusions
1. There are much data on the accoustical behaviors of several fish species that strongly
suggest the capacity directional hearing and sound source localization. Most of these
observations indicate the necessity that one or more otolith organs respond to acoustic
particle motion.
2. The question of localization in the near- versus far-fields is no longer a critical issue
because we now know that near field hearing does not imply that the lateral line system
must be involved. The otolith organs respond directly to acoustic particle motion in
both fields.
3. Most conditioning and psychophysical studies on the discrimination of sound source
location provide evidence consistent with the hypothesis that fishes are able to locate
sound sources in a way analogous to localization capacities of human beings and other
tetrapods, both in azimuth and elevation. However, most of these studies fail to
unequivocally demonstrate that fishes can actually perceive the location of sound
sources.
4. An explanation for sound source localization behavior at the level of Mauthner cells
and other reticulo-spinal neurons cannot serve to explain conditioning and
discrimination learning phenomena with respect to source location.
5. All present accounts postulate that the process begins with the determination of the axis
of acoustic particle motion by processing the profile of activity over an array of
peripheral channels that directly reflect diverse hair cell and receptor organ orientations
(“vector detection”).
6. Neurophysiological studies on cells of the auditory nerve and brainstem are consistent
with vector detection and show that most brainstem cells preserve and enhance the
Advances in Sound Localization
508
directionality originating from otolith organ hair cells. Goldfish and other Otophysi
present a clear problem for this view because there is little or no variation of hair cell
directionality in the saccule or at the midbrain. This has lead to speculations that
Otophysi use other otolith organs (lagena or utricle) in addition to the saccule for vector
detection.
7. Vector detection leaves an essential “180
o
ambiguity” as an unsolved problem (Which
end of the axis points to the source, or, in what direction is the sound propagating?).
The “phase model” of directional hearing has been moderately successful in solving
this ambiguity in theory and experiment. However, the 180
o
ambiguity is not the only
ambiguity for sound source localization throughout the vertebrates. It is not certain that
auditory processing, alone, must be able to solve this problem.
8. Although the phase model is successful in a general sense, it is difficult to apply in
several important cases (i.e., for fishes without swimbladders, and for Otophysi) where
effectively independent representations of the particle motion and pressure waveforms
are required but are not evident.
9. Additional problems for vector detection and the phase model are that the axis of
acoustic particle motion points directly at the source only for monopole sources, and
that clear and unambiguous representations of waveform phase that could help in
localization have not been observed in auditory nerve units (distributions of phase-
locking angles tend to be uniform).
10. While there are behavioral and electrophysiological observations that are consistent
with sound source localization in fishes, there are no examples of localization capacities
in a single species that have a comprehensive theoretical explanation. Sound source
localization in fishes remains incompletely understood.
9. References
Allen, J. (1996). OHCs shift the excitation pattern via BM tension, In: Diversity in Auditory
Mechanics, Lewis, E.R.; Long, G.R.; Lyon, R.F.; Narins, P.M.; Steele, C.R. & Hecht-
Poinar, E., (Eds.), pp. 167-175, World Scientific Publishers, Singapore
Berg, A.V. van den & Schuijf, A. (1983). Discrimination of sounds based on the phase
difference between the particle motion and acoustic pressure in the shark
Chiloscyllium griseum. Proc. Roy. Soc. Lond. B, 218, 127-134
Bergeijk, W.A. van (1964). Directional and nondirectional hearing in fish. In: Marine
Bioacoustics, Tavolga, W.A., (Ed.), pp. 269-301, Pergamon Press, London
Bergeijk, W.A. van (1967). The evolution of vertebrate hearing, In: Contributions to Sensory
Physiology, Vol. 2, Neff, W.D., (Ed.), pp. 1-49, Academic Press, New York
Braun, C.; Coombs, S. & Fay, R. (2002). Multisensory interactions within the octavolateralis
systems: What is the nature of multisensory integration? Brain Behav & Evol, 59, pp.
162-176
Bregman, A.S. (1990). Auditory Scene Analysis. The Perceptual Organisation of Sound, MIT
Press, Cambridge
Buwalda, R.J.A.; Schuijf, A. & Hawkins, A.D. (1983). Discrimination by the cod of sounds
from opposing directions. J Comp Physiol, A, 150, pp. 175-184
Canfield, J.G. & Eaton, R.C. (1990). Swim bladder acoustic pressure transduction initiates
Mauthner-mediated escape, Nature, 347, pp. 760-762
Directional Hearing in Fishes
509
Chapman, C.J. (1973). Field studies of hearing in teleost fish. Helgolander wiss Meeresunters,
24, pp. 371-390
Chapman, C.J. & Sand, O. (1974). Field studies of hearing in two species of flatfish,
Pleuronectes platessa (L.) and Limanda limanda (L.) (Family Pleuronectidae). Comp
Biochem Physiol, 47, pp. 371-385
Chapman, C.J. & Johnstone, A.D.F. (1974). Some auditory discrimination experiments on
marine fish. J Exp Biol, 61, pp. 521-528
Cherry, E.C. (1953). Some experiments on the recognition of speech, with one and with two
ears. J Acoust Soc Am, 25, pp. 975-979
Dale, T. (1976). The labyrinthine mechanoreceptor organs of the cod (Gadus morhua L.
(Teleostei: Gadidae). Norw J Zool, 24, pp. 85-128
Dijkgraaf, S. (1960). Hearing in bony fishes. Proc Roy Soc, B, 152, pp. 51-54
Edds-Walton, P.L. (1998). Anatomical evidence for binaural processing in the descending
octaval nucleus of the toadfish (Opsanus tau). Hear Res, 123, 41-54.
Edds-Walton, P.L.; Fay, R.R. & Highstein, S.M. (1999). Dendritic arbors and central
projections of auditory fibers from the saccule of the toadfish (Opsanus tau). J Comp
Neurol, 411, pp. 212-238
Edds-Walton, P. & Fay, R.R. (2003). Directional selectivity and frequency tuning of midbrain
cells in the oyster toadfish, Opsanus tau. J Comp Physiol, 189, pp. 527-543
Edds-Walton, P. and Fay, RR (2005) Sharpening of Directional Responses along the
Auditory Pathway of the Oyster Toadfish, Opsanus tau. J. Comp Physiol, 191, 1079-
1086.
Edds-Walton, P.; Holstein, G.M, & Fay, R. (2009) γ-Aminobutyric acid is a neurotransmitter
in the auditory pathway of toadfish, Opsanus tau. Hear. Res. 262, 45-55.
Fay, R.R. (1981). Coding of acoustic information in the eighth nerve, In: Hearing and Sound
Communication in Fishes, Tavolga, W.; Popper, A.N. & Fay, R.R., (Eds.), pp. 189-219,
Springer-Verlag, New York
Fay, R.R. (1984). The goldfish ear codes the axis of acoustic particle motion in three
dimensions. Science, 225, pp. 951-954
Fay, R.R ; Coombs, S.L. & Elepfandt, A. (2002). Response of goldfish otolithic afferents to a
moving dipole sound source. Bioacoustics, 12, pp. 172-173
Fay, R.R. & Edds-Walton, P.L. (1997a). Directional response properties of saccular afferents
of the toadfish, Opsanus tau
. Hear Res, 111, pp. 1-21
Fay, R.R. & Edds-Walton, P.L. (1997b). Diversity in frequency response properties of
saccular afferents of the toadfish (Opsanus tau). Hear Res, 113, pp. 235-246
Fay, R.R., and Edds-Walton, P.L. (1999). Sharpening of directional auditory responses in the
descending octaval nucleus of the toadfish (Opsanus tau). Biol. Bull, 197, 240-241.
Fay, R.R. and Edds-Walton, P.L. (2000). Directional encoding by fish auditory systems.
Philosophical Transactions of the Royal Society London. B, 355, 1281-1284.
Fay, R.R., and Edds-Walton, P.L. (2001). Bimodal units in the torus semicircularis of the
toadfish (Opsanus tau). Biol. Bull, 201, 280-281.
Fay, R.R. & Olsho, L.W. (1979). Discharge patterns of lagenar and saccular neurones of the
goldfish eighth nerve: Displacement sensitivity and directional characteristics.
Comp Biochem Physiol, 62, pp. 377-386
Advances in Sound Localization
510
Fine, M,; Winn, H. & Olla, B. (1977). Communication in fishes. In: How Animals Communicate,
Sebeok, T., (Ed.), pp. 472-518, Indiana University Press, Bloomington
Fish, J.F. (1972). The effect of sound playback on the toadfish. In: Behavior of Marine Animals,
Volume 2, Winn, H.E. & Olla, B.L. (Eds.), pp. 386-434, Plenum Publ. Corp, New
York
Flock, Å. (1964). Structure of the macula utriculi with special reference to directional
interplay of sensory responses as revealed by morphological polarization. J Cell Biol
22, pp. 413-431
Flock, Å. (1965). Electron microscopic and electrophysiological studies on the lateral line
canal organ. Acta Oto-laryngol Suppl, 199, pp. 1-90
Frisch, K. von & Dijkgraaf, S. (1935). Can fish perceive sound direction? Z vergl Physiol, 22,
pp. 641-655
Furshpan, E.J. & Furukawa, T. (1962). Intracellular and extracellular responses of the several
regions of the Mauthner cell of the goldfish. J Neurophysiol, 25, pp. 732-771
Gray, G.A. & Winn, H.E. (1961). Reproductive ecology and sound production of the
toadfish, Opsanus tau. Ecology, 42, pp. 274-282
Hawkins, A.D. & Horner, K. (1981). Directional characteristics of primary auditory neurons
from the cod ear, In: Hearing and Sound Communication in Fishes, Tavolga, W.N.;
Popper, A.N. & Fay, R.R., (Eds.), pp. 311-328, Springer-Verlag, New York
Hawkins, A.D. & Sand, O. (1977). Directional hearing in the median vertical plane by the
cod. J Comp Physiol, 122, pp. 1-8
Hirsh, I.J. (1948). The influence of interaural phase on interaural summation and inhibition. J
Acoust Soc Am, 20, pp. 536-544
Kalmijn, A.J. (1997). Electric and near-field acoustic detection, a comparative study. Acta
Physiol Scand, 161, Suppl 638, pp. 25-38
Lu, Z.; Song, J. & Popper, A.N. (1998). Encoding of acoustic directional information by
saccular afferents of the sleeper goby, Dormitator latifrons. J Comp Physiol, A, 182,
pp. 805-815
Lu, Z.; Xu Z. & Buchser, W.J. (2003). Acoustic response properties of lagenar nerve fibers in
the sleeper goby, Dormitator latifrons. J Comp Physiol, A, 189, pp. 889-905
Ma, W-L. & Fay, R.R. (2002). Neural representations of the axis of acoustic particle motion in
the nucleus centralis of the torus semicircularis of the goldfish, Carassius auratus. J
Comp Physiol, A, 188, pp. 301-313
McKibben, J.R. & Bass, A.H. (1998). Behavioral assessment of acoustic parameters relevant
to signal recognition and preference in a vocal fish. J Acoust Soc Am, 104, pp. 3520-
3533
McKibben, J.R. & Bass, A.H. (2001). Effects of temporal envelope modulation on acoustic
signal recognition in a vocal fish, the plainfin midshipman.
J Acoust Soc Am, 109,
pp. 2934-2943
Moulton, J.M. & Dixon, R.H. (1967). Directional hearing in fishes. In: Marine Bio-acoustics,
Vol. II, Tavolga, W.N., (Ed.), pp. 187-228, Pergamon Press, New York
Platt, C. (1977). Hair cell distribution and orientation in goldfish otolith organs. J Comp
Neurol, 172, pp. 283-297
Directional Hearing in Fishes
511
Popper, A.N.; Salmon, A. & Parvulescu (1973). Sound localization by the Hawaiian
squirrelfishes, Myripristis berndti and M. argyromus. Anim Behav, 21, pp. 86-97
Pumphrey, R.J. (1950). Hearing. Symp Soc Exp Biol, 4, pp. 1-18
Reinhardt, F. (1935). Uber Richtungswharnehmung bei Fischen, besonders bei der Elritze
(Phoxinus laevis L.) und beim Zwergwels (Amiurus nebulosus Raf.). Z. vergl Physiol,
22, pp. 570-603
Sand, O. (1974). Directional sensitivity of microphonic potentials from the perch ear. J exp
Biol, 60, pp. 881-899
Schellart, N.A.M. Wubbels, R.J.; Schreurs, W. & Faber, A. (1995). Two-dimensional vibrating
platform in nm range. Med Biol Eng Comp, 33, pp. 217-220
Schuijf, A. (1975). Directional hearing of cod (Gadus morhua) under approximate free field
conditions. J Comp Physiol, A, 98, pp. 307-332
Schuijf, A. (1981). Models of acoustic localization. In: Hearing and Sound Communication in
Fishes, Tavolga, W.N., Popper, A.N. & Fay, R.R., (Eds.), pp. 267-310,
Springer-Verlag, New York
Schuijf, A. Baretta, J.W. & Windschut, J.T. (1972). A field investigation on the
deiscrimination of sound direction in Labrus berggylta (Pisces: Perciformes). Netherl J
Zool, 22, pp. 81-104
Schuijf, A. & Buwalda, R.J.A. (1975). On the mechanism of directional hearing in cod (Gadus
morhua). J Comp Physiol, A, 98, pp. 333-344
Schuijf, A. & Hawkins, A.D. (1983). Acoustic distance discrimination by the cod. Nature, 302,
pp. 143-144
Schuijf, A. & Siemelink, M. (1974). The ability of cod (Gadus morhua) to orient towards a
sound source. Experientia, 30, pp. 773-774
Schuijf, A. Visser, C.; Willers, A. & Buwalda, R.J. (1977). Acoustic localization in an
ostariophysine fish. Experientia, 33, pp. 1062-1063
Vries, H.L. de (1950). The mechanics of the labyrinth otoliths. Acta Oto-Laryngol, 38, pp.
262-273
Weeg, M.S. & Bass, A.H. (2002). Frequency response properties of lateral line superficial
neuromasts in a vocal fish, with evidence for acoustic sensitivity. J Neurophysiol, 88,
pp. 1252-1262
Wightman, F. & Kistler, D. (1993). Sound localization. In: Human Psychophysics, Yost, W.A.;
Popper, A.N. & Fay, R.R. (Eds.), pp. 155–192, Springer-Verlag, New York
Winn, H.E. (1964). The biological significance of fish sounds. In: Marine Bioacoustics, Tavolga,
W.N. (Ed.), pp. 213-231, Pergamon Press, New York
Wubbels, R.J. & Schellart, N.A.M. (1997). Neuronal encoding of sound direction in the
auditory midbrain of the rainbow trout. J Neurophysiol, 77, pp. 3060-3074
Wubbels, R.J. & Schellart, N.A.M. (1998). An analysis of the relationship between the
response characteristics and toporgaphy of directional- and non-directional
auditory neurons in the torus semicircularis of the rainbow trout. J exp Biol, 201, pp.
1947-1958
Wubbles, R.J. Schellart, N.A.M. & Goossens, J.H.H.L.M. (1995.) Mapping of sound direction
in the trout lower midbrain. Neurosci Lett, 199, pp. 179-182
Advances in Sound Localization
512
Zeddies, D. Fay, R.; Alderks, P.; Shaub, K. & Sisneros, J. (2010a). Sound Source localization
by the plainfin midshipman fish (Porichthys notatus). Journal of the Acoustical Society
of America, 127, pp. 3104-3113
Zeddies, D. Fay, R.; Alderks, P.; Acob & Sisneros, J. (2010b). Sound source localization of a
dipole by the plainfin midshipman fish (Porichthys notatus). Journal of the Acoustical
Society of America, 127, pp. 1886 (Abstract)
27
Frequency Dependent Specialization for
Processing Binaural Auditory Cues in
Avian Sound Localization Circuits
Rei Yamada and Harunori Ohmori
Kyoto University
Japan
1. Introduction
Localizing sound sources is essential for survival of animals. It enables animals to avoid
danger, or to catch their prey. The differences of sound information between two ears, those
of interaural time and level difference (ITD and ILD), are important cues for sound source
localization. The minimum resolvable angle of sound source separation is less than 30˚ along
the horizontal plane in many species (cat, Casseday & Neff, 1973; rat, Masterton et al., 1975;
songbirds, Klump et al., 1986; Park & Dooling, 1991; Klump, 2000), and in some species the
resolution is extremely high. In human and in barn owl, the resolvable angle is as small as 1˚
(Mills, 1958; Knudsen & Konishi, 1979). ITD and ILD cues depend on the head size of
animals and are quite small, particularly in small-headed animals. Thus processing of these
cues may need specialization of individual neurons and neural circuits. The time and level
information of sounds are captured in the cochlea, transformed to trains of action potentials
in the auditory nerve fibers, and then transmitted to auditory nuclei in the brainstem. In the
brainstem, time and level information are extracted in the cochlear nucleus and then
transmitted in parallel pathways which are specialized to process ITD and ILD cues
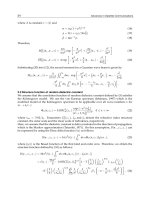
separately (Fig. 1A, indicating the auditory brainstem circuit in birds) (Sullivan & Konishi,
1984; Takahashi et al., 1984; Takahashi & Konishi, 1988; Warchol & Dallos, 1990; Moiseff &
Konishi, 1983; Yin, 2002). Furthermore, in the auditory system, neurons are tuned to a
specific frequency of sound (characteristic frequency, CF), and ITD and ILD cues are
processed by each CF neuron (Brugge, 1992; Klump, 2000). Recently, a series of studies in
the chicken have revealed several frequency dependent specializations in ITD coding
pathway (Kuba et al., 2005; Yamada et al., 2005; Kuba et al., 2006). These specializations
include the type and the density of ion channels, and their subcellular localization.
Furthermore, recent observations in mammals and birds indicate that time and level
information are not processed independently but rather cooperatively to enhance the
contrast of interaural difference cues even at the first stage of processing of these cues in the
brainstem auditory nuclei (Brand et al., 2002; Nishino et al., 2008; Sato et al., 2010). In this
chapter, we will first summarize what is known about the neural specializations that enable
the preciseness of coincidence detection of synaptic inputs, which is central to process the
ITD. And then, we will review observations on how the interaction of time and level
information of sounds modulates the processing of each ITD and ILD cue.
Advances in Sound Localization
514
A
Coincidence
detector
from contra NM
from ipsi NM
Delay line
B
NL
NA
NL
SON
ANF
NM
Time
Level
ITD
ILD
LLD
Midline
Cochlear nucleus
LLD
SON
NL
NA
NM
Excitation
Inhibition
Midline
Fig. 1. (A) Schematic diagrams of the auditory brainstem circuits for processing ITD and ILD
in birds. (B) Modification of Jeffress model incorporating features of NL of the chick. The
contralateral projections from NM to NL form delay lines, while NL neurons act as
coincidence detectors of bilateral excitatory inputs. When the sound source moves toward
more contralateral locations, spikes from contralateral NM will arrive at NL faster, and
bilateral spikes arrive simultaneously at the NL neuron located more laterally.
2. Specialization of ITD coding neurons
Extraction of ITDs in birds is explained on the classical Jeffress model (Jeffress, 1948), which
requires delay lines and an array of coincidence detectors (Fig. 1B). Delay lines delay the
arrival time of action potential to the coincidence detectors, while the coincidence detectors
fire maximally when they receive synaptic inputs simultaneously from both ears. These two
elements allow each ITD to be encoded as the place of neuron in the neuronal array. In
birds, ITDs are processed in the nucleus laminaris (NL, Fig. 1A) (Konishi, 2003), which is a
homologue of the mammalian nucleus of the medial superior olive (MSO). NL is innervated
bilaterally from the nucleus magnocellularis (NM). NM extracts fine temporal information
of sounds from auditory nerve fibers. In the chicken, the projection fibers from contralateral
NM to NL form delay lines (Young & Rubel, 1983; Carr & Konishi, 1988), while NL neurons
act as coincidence detectors of bilateral synaptic inputs (Fig. 1B) (Carr & Konishi, 1990;
Overholt et al., 1992). Sensitivity to ITDs is extremely high in NL neurons. In vivo single-unit
studies in the barn owl NL showed that the half-peak width of the ITD tuning curve varies
with the CF of neurons, and reaches about 0.1-0.2 ms at 3-7 kHz (Carr & Konishi, 1990; Fujita
& Konishi, 1991). This sharpness of ITD tuning of NL neurons should underlie the
resolution of a microsecond order of ITDs in the barn owl (Moiseff & Konishi, 1981) and
should be determined by the coincidence detection of NL neurons. The cellular mechanism
of coincidence detection in NL neurons was studied in vitro (Kuba et al., 2003). Experiments
were made in brainstem slices of the posthatch chick of P3-P11 at the body temperature of
birds (40˚C). Under the whole-cell recording, EPSPs were evoked in NL neurons by
electrical stimuli applied to both sides of projection fibers from NM, while the time interval
between the two stimuli (∆t) was varied (Fig. 2A). The EPSPs were summated to generate an
action potential as the interval of two stimuli decreased. The probability of firings peaked at
∆t of 0 ms (Fig. 2A and B), and the half-peak width of the coincidence detection curve (time
window) was 0.4 ms (Fig. 2B), which is comparable to that observed in the barn owl NL in
vivo (Carr & Konishi, 1990). What cellular mechanisms underlie to achieve such a high
accuracy of coincidence detection?
Frequency Dependent Specialization for
Processing Binaural Auditory Cues in Avian Sound Localization Circuits
515
The acceleration of EPSP time course is essential for the accurate coincidence detection
(Kuba et al., 2003) by limiting the time window for the summation of bilateral EPSPs. NL
neurons reduce their input resistance extensively by activating several membrane
conductances at the resting membrane potential (Reyes et al., 1996; Trussell, 1999; Kuba et
al., 2002; Kuba et al., 2003). Among them, the most important is the conductance of low-
threshold K
+
current (I
KLT
). I
KLT
is mediated by subtypes of voltage-gated K
+
channels, Kv1.1
and 1.2, and in particular, Kv1.2 channels are predominant in the NL (Fukui & Ohmori,
2004; Kuba et al., 2005). Developmentally, I
KLT
increases nearly fourfold around the hatch,
and becomes the dominant conductance at resting potential in NL neurons (Kuba et al.,
Fig. 2. Rapid EPSP time course is essential for coincidence detection (from Kuba et al., 2003;
Kuba et al., 2005). (A) Bilateral EPSPs are evoked at different time intervals (∆t). Spikes are
generated when ∆t is small. (B) Probability of spike generation as a function of ∆t. The time
window is indicated by the horizontal broken line. (C) EPSPs from the same NL neurons at
different holding potentials. EPSP is accelerated with membrane depolarization (from -62 to
-52 mV). Data are from middle CF neurons. (D) Time window of coincidence detection at
each CF. (E) EPSPs from each CF are normalized and superimposed. EPSP is fastest and
coincidence detection is the most accurate at middle CF.
Advances in Sound Localization
516
2002). Moreover, it is activated near the resting membrane potential with rapid kinetics (-60
mV; Rathouz & Trussell, 1998). I
KLT
is activated by a small membrane depolarization and
accelerates the falling phase of EPSP. Consequently, EPSP has a fast time course as fast as
EPSC at the resting membrane potential, and is even faster than EPSC with a small
membrane depolarization (Fig. 2C). These findings indicate that I
KLT
plays a crucial role in
shortening the time window of coincidence detection to submillisecond order. Recently, a
similar developmental increase of I
KLT
has been reported to shape the EPSPs in the
mammalian MSO neurons (Scott et al., 2005).
3. Frequency specific expression of I
KLT
Although the range of audible frequencies varies among species, precision is the highest in
the middle frequencies in most avian species; thus the acuity of azimuthal sound source
localization depends on the sound frequency (Klump, 2000). NL is organized tonotopically;
the CF of neurons is high in the rostro-medial (high CF) NL and decreases monotonically to
the caudo-lateral (low CF) NL (Rubel & Parks, 1975). ITDs are determined separately by
frequency-specific NL neurons. The coincidence detection is dependent on the frequency
region of NL (Kuba et al., 2005), and their time window of coincidence detection was the
smallest at the middle CF neurons, closely followed by the high CF neurons, and was the
largest at the low CF neurons (Fig. 2D). Thus the acuity of coincidence detection is the
highest in the middle CF NL neurons.
The EPSP time course is the fastest in the middle CF NL neurons (Fig. 2E). The size of I
KLT
conductance is the largest at the middle CF. The expression of Kv1.2 channels is the highest
in the middle CF neurons, followed by the high CF neurons, and is the lowest in the low CF
neurons (Kuba et al., 2005). These observations indicate that the high level of Kv1.2
expression accelerates the EPSPs and determines the tonotopy of the coincidence detection
in NL. Thus, the dominant expression of Kv1.2 may underlie the high resolution of sound
localization in the middle frequency range in avian species (Klump, 2000).
4. HCN channel
Hyperpolarization-activated cation current (I
h
) is another major conductance activated at the
resting membrane potential in NL neurons (Kuba et al., 2002). I
h
has slow activation and
deactivation kinetics, and has the reversal potential positive to the resting membrane
potential (-50 to -20 mV) (Pape, 1996). These allow I
h
to accelerate the EPSPs in two ways.
First, it works as a shunting conductance to shorten the membrane time constant. Second, it
depolarizes the resting membrane potential and activates I
KLT
. Thus, I
h
contributes to
improve the coincidence detection.
I
h
is mediated by HCN (hyperpolarization-activated and cyclic nucleotide-gated) channels
and four channel subtypes have been described (HCN1 ~ 4) with different rates of activation
and different sensitivities to cyclic nucleotides (Santoro & Tibbs, 1999). Expressions of
HCN1 and HCN2 are demonstrated in NL neurons and the level of expression varies along
the tonotopic axis (Yamada et al., 2005). HCN1 is expressed highest at the low CF and
decreases toward the high CF NL region, while HCN2 is evenly distributed along the
tonotopic axis. What is the functional significance of this CF-dependent expression of HCN
channels? HCN1 channels have a more positive activation voltage than HCN2 channels
(Santoro & Tibbs, 1999). Because of the predominant expression of HCN1 channels, I
h
Frequency Dependent Specialization for
Processing Binaural Auditory Cues in Avian Sound Localization Circuits
517
conductance shortens the membrane time constant and improves the coincidence detection
in the middle-low CF NL neurons. In contrast in high CF neurons, the I
h
conductance is
rather small at the resting potential because HCN2 channels are activated at more negative
membrane potentials than the resting level. HCN2 channels are more sensitive to [cAMP]
i
than HCN1 channels are, and the increase of [cAMP]
i
shifts the voltage-dependence of
activation to a positive direction (Ludwig et al, 1998; Santoro et al., 1998; Santoro & Tibbs,
1999). This makes it possible for the high CF neurons to increase the I
h
conductance at the
resting potential through the elevation of [cAMP]
i
(Fig. 3A) (Yamada et al., 2005).
Monoamine or acetylcholine is known to modulate I
h
by regulating [cAMP]
i
(DiFrancesco et
al., 1986; DiFrancesco & Tromba, 1988a,b; Bobker & Williams, 1989). In NL, noradrenaline
elevates [cAMP]
i
and increases the I
h
conductance, depolarizes the membrane and
accelerates the EPSPs (Fig. 3B). Thus, the acuity of coincidence detection is enhanced by
noradrenaline via the modulation of I
h
in the high CF neurons (Fig. 3C). A small
depolarization of the membrane by the current injection enhanced the coincidence detection
almost to the same extent as that caused by depolarization by noradrenaline. This indicates
that the noradrenergic effect on the coincidence detection is mediated by the membrane
depolarization through the activation of I
KLT
conductance.
These results raise the possibility that coincidence detection is under sympathetic control.
An interesting observation was made in the barn owl (Knudsen & Konishi, 1979). The
accuracy of sound source localization was tested by using either a short sound of 75 ms long
or a long sound of 1 s long. There was no difference in the error of localization at the initial
stage of head orientation whether the test sound stimulus was short or long and whether the
sound was a broadband noise or a pure tone; perhaps barn owl measures the ITD at the
onset of sound. However, adjustment of the head orientation at the end of a long sound
stimulus clearly improved in the middle-high CF ranges (6-8 kHz) (Figure 3 of Knudsen &
Konishi, 1979). This improvement might be related to the sympathetic activity when the
Fig. 3. Enhancement of coincidence detection by noradrenaline at high CF NL neurons (from
Yamada et al., 2005). (A) Voltage-dependent activation curve of I
h
at high CF. Membrane
permeable analogue of cAMP (8-Br-cAMP) shifts the voltage dependence of I
h
positively
(filled circles). Noradrenaline depolarized the membrane potential, accelerates EPSP (B), and
improves coincidence detection (C) at high CF.
Advances in Sound Localization
518
animal was exposed to a long sound stimulus. However, the expression pattern of HCN
channel subunits has not been examined in owls.
The CF-specific ITD information is integrated across frequencies at higher order nuclei to
create an auditory space map (Konishi, 2003). Therefore, the noradrenergic enhancement of
coincidence detection in the high CF NL neurons should increase the resolution of sound
source localization. Neurons in the nucleus locus ceruleus send noradrenergic projections to
almost all regions of the brain (Jones & Moore, 1977), and activities of these neurons are
increased during a high arousal state (Aston-Jones & Bloom, 1981). This may suggest that
noradrenergic systems are effective to increase the resolution of sound localization when
animals are listening carefully to the sounds.
5. Specialization of action potential initiation site along the tonotopic axis
NL neurons are also specialized along the tonotopic axis in initiating action potentials in the
axon. The axon initial segment has a high density of Nav channels (Catterall, 1981), and is
the site of action potential initiation in many neurons (Mainen et al., 1995; Luscher &
Larkum, 1998). However, the electron-microscopic studies indicated that the axon initial
segment of NL neurons is myelinated in the chicken and the barn owl (Carr & Boudreau,
1993). Since the myelination was not observed in low-frequency NL neurons (below 1 kHz),
they considered that the myelinated initial segment could be a consequence of adaptation
for accurate binaural processing of high frequency sounds. This raises questions as to the
location and role of action potential initiation site in NL neurons.
The distribution of Nav channels was studied in NL of the chicken (Kuba et al., 2006), and
found that Nav1.6 channels are expressed and clustered in the axon, while they are almost
absent in the soma. The distribution is different tonotopically, and in the high CF neurons,
the cluster of Nav1.6 channels is located at some distance from the soma (50 µm) and
stretches a short segment of the axon (10 µm), while it is located closer to the soma (5 µm)
and is extended much longer segment (25 µm) in the low CF neurons. Thus, the site of
action potential initiation is displaced more distant from the soma as the CF of neurons
becomes higher. Consistently, the somatic amplitude of action potentials is small in the high
CF NL neurons.
The CF-specific distribution of Nav channels ensures the acuity of coincidence detection. In
the high CF neurons, the higher rates of synaptic inputs temporally summate and generate a
plateau depolarization at the soma. This depolarization inactivates Nav channels and
impedes the generation of action potentials, and consequently reduces the ITD sensitivity of
the neuron. A distant localization of Nav channels from the soma may reduce the level of
depolarization and the level of inactivation electrotonically. A computer simulation
predicted that a distant localization of Nav channels enables the processing of ITD with a
high peak-trough contrast (the contrast of firing rate between the peak and trough of the
ITD tuning curve) in the high CF neurons.
6. Sound level dependent inhibition modulates the ITD tuning in NL
Processing of ITDs in NL in vivo is affected by sound loudness. Loud sound was expected to
reduce the peak-trough contrast by simulation (Dasika et al., 2005). However, the peak-
trough contrast was maintained rather at high sound pressure level in the barn owl (Pena et
al., 1996). They proposed that inhibition from the superior olivary nucleus (SON) controls
Frequency Dependent Specialization for
Processing Binaural Auditory Cues in Avian Sound Localization Circuits
519
ITD tuning in NL, rendering it tolerant to sound pressure level. The level information of
sound is extracted in the nucleus angularis (NA), which is another subdivision of cochlear
nucleus (Fig. 1A). The SON receives excitatory inputs from the NA and makes an inhibitory
innervation to NA, NM, and NL in a sound-level-dependent manner (Lachica et al., 1994;
Yang et al., 1999; Monsivais et al., 2000; Burger et al., 2005; Fukui et al, 2010). By recording
single unit activity in NL of chicken in vivo, the ITD tuning in NL is found being controlled
by both the frequency and level of sounds (Nishino et al., 2008). In the following discussion,
best frequency (BF) is used as an alternative to CF. BF is the sound frequency at which the
neuron generates spikes at the highest rate, while CF is the frequency at which neurons are
driven at the lowest level of sound.
The peak-trough contrast of ITD tuning in the low BF units (BF lower than 1 kHz) became
larger as the sound became louder, and was maintained high even at the loudest sound levels
(Fig. 4A). After electrical lesion of the SON, the peak-trough contrast of ITD tuning curve
collapsed at loud sound levels in the low BF NL neurons (Fig. 4B). In contrast, the peak-trough
contrast of the middle-high BF units (higher than 1 kHz) was maximized at the intermediate
sound pressure level and was practically lost when a loud sound was applied, which was
similar to that of the low BF units after the lesion of SON. Furthermore, the level dependence
of peak-trough contrast of middle-high BF neurons was not different from the control after the
lesion of SON. These observations demonstrated that the BF dependence of level-dependent
ITD tuning reflects the BF dependence of SON control on NL. The pattern and density of the
SON projection to NL is correlated with this BF dependent effect of the SON. The GABAergic
projection from SON to NL is robust in the low BF region of the nucleus and is less prominent
towards the high BF region (Nishino et al., 2008). Therefore, the dense inhibitory projection
from SON to NL is concluded to regulate the ITD tuning in NL.
The computer simulation that is based on a NEURON model reproduced a level
dependence of ITD tuning in NL neurons (Nishino et al., 2008). The simulation further
showed that without balance in the bilateral excitation, the peak-trough contrast of ITD
tuning lost tolerance to the loud sounds. The SON inhibition might also play a role in
maintaining the balance of excitation from NM on the two sides (Dasika et al., 2005).
-5000 0 5000
0
100
200
78dB
58dB
38dB
98dB
Firing rate
(spikes / sec)
Ipsi. lead ITD ( sec) Contra. lead
B
Firing rate
(spikes / sec)
Ipsi. lead ITD ( sec) Contra. lead
-2500 0 2500
0
400
78dB
38dB
48dB
300
200
100
A
Fig. 4. ITD tuning to a pure-tone sound stimulus of low BF unit in NL (from Nishino et al.,
2008). (A) ITD tuning curves from a low BF NL unit (200 Hz) with different sound pressure
levels. The solid line indicates the ITD tuning curve of best peak-trough contrast. (B) ITD
tuning curves from a low BF NL unit (400 Hz) after SON lesion.
Advances in Sound Localization
520
7. ILD coding
In birds, the interaural level differences ILDs are processed in the dorsal lateral lemniscal
neurons (LLD). The LLD receives excitatory inputs from the contralateral NA and inhibitory
inputs from the ipsilateral NA via the contralateral LLD (Manley at al., 1988; Takahashi &
Konishi, 1988; Mogdans & Knudsen, 1994; Konishi, 2003). Therefore, LLD neurons are
excited by contralateral sound and inhibited by ipsilateral sound, and encode ILDs by
comparing the sound level between two ears (Fig. 5A). However, small head diameter of the
animal and the limited audible frequency range (< 4kHz) may limit the physiological
relevant range of ILD to about ±5 dB or narrower in the chicken. By recording single unit
activity in NA and LLD of chicken in vivo, the neural activity in these neurons was found
being affected by the interaural phase difference (IPD), which is a frequency-independent
formula of ITD, through acoustic interference across the interaural canal that connects the
middle ears of the two sides in birds (Sato et al., 2010).
The firing of the NA unit increased monotonically not only by the ipsilateral sound but also
by the contralateral sound, whereas the sensitivity was lower (about 15 dB) with the
contralateral sound. Activity in the NA is affected by strong contralateral sound through the
interaural canal, an air-filled connection between the two middle ear cavities (Fig. 5A).
During the binaural sound stimulus, the interaction of contralateral sound shows IPD
dependence (Fig. 5B). Increasing the level of out-of-phase (IPD = 180º) contralateral sound
monotonically increased the firing rate of the NA neurons, whereas increasing the in-phase
(0º) sound produced a local minimum (dip-ILD) and then increased the firing rate, and the
depth of the dip was affected by the IPD (Fig. 5B). According to the NA activity, the LLD
unit is strongly modulated by the IPD. LLD neurons are activated by contralateral NA
activity and are inhibited by ipsilateral NA activity. Therefore, the firing activity of LLD
neurons is high at negative ILDs (ipsi < contra) and declines to positive ILDs (ipsi > contra).
Fig. 5C shows a unit that exhibited a low firing rate when the sound level was not different
in two ears. The firing activity was nearly absent at 0 dB to positive ILDs, demonstrating a
strong ipsilateral inhibition on this unit. Another unit (Fig. 5D) fired robust even when the
sound to the ipsilateral ear was loud (positive ILDs). The ipsilateral inhibition may not be
strong in this unit. The rate-ILD relationship varied with the IPD in both units, and the
firing rate was lowest for the in-phase sound (0º IPD, thick solid lines), and the rate
increased in most cases when IPD was included, to some extent.
In the open field, any displacement of the sound source from the midline must cause a
correlated change in both the level and phase of sounds between two ears. When the sound
source is presented at the midline, the ILD is 0 dB and IPD is 0º. A sound source
displacement towards the contralateral ear generates negative ILD and positive IPD in the
binaural sounds (by definition), and towards ipsilateral ear generates positive ILD and
negative IPD (Fig. 5C and D). With any IPD, the firing rate of most units increases (Fig. 5C
and D). Therefore, the responsiveness of the LLD units to small changes of ILD, namely the
slope of rate-ILD relationship, is increased toward the cotralateral ear (negative ILD) and
decreases toward the ipsilateral ear (positive ILD) corresponding to the respective
displacement of the sound source from the midline.
Consequently, the modulation of neuronal activity by IPD enhances the responsiveness of
LLD neurons to the contralateral field. Any particular dependence of this enhancement on
the BF was not found; however the sample numbers were small and most recordings were
made in high-BF LLD units.
Frequency Dependent Specialization for
Processing Binaural Auditory Cues in Avian Sound Localization Circuits
521
A simple model is proposed to explain the interaural coupling effects and IPD modulation
of LLD activity (Sato et al., 2010), and concluded that the modulation of neuronal activity by
IPD increases the sensitivity of LLD neurons to the contralateral field, and may improve the
processing of small ILD cues.
Fig. 5. IPD modulates the neural activity in the NA and LLD (from Sato et al., 2010). (A)
Schematic diagrams to show the ILD processing circuit in the brainstem. Open circles
indicate excitatory projections and filled bars indicate inhibitory projections. (B) The firing
rate of NA unit (BF 200 Hz) as a function of contralateral sound pressure level (SPL).
Ipsilateral sound (52 dB SPL) is constant at 20 dB above the threshold. A vertical thin line
indicates the 0 ILD in this unit. Binaural sound is presented at four IPDs, as indicated by the
different symbols. (C and D) IPD-dependence of rate-ILD relationship of two typical LLD
units. The inset indicates IPDs applied to both (C) and (D).
Advances in Sound Localization
522
8. Comparison to mammals
MSO neurons have several morphological and biophysical features common to NL
neurons (Oertel, 1999; Trussell, 1999). These include bipolar dendrites (Scheibel &
Scheibel, 1974), rapid time course of EPSCs (Smith et al., 2000), and large conductance of
I
KLT
and I
h
(Smith, 1995; Svirskis et al., 2002). Furthermore, channel molecules underlying
the synaptic and membrane conductances are also common between MSO and NL (Parks,
2000; Rosenberger et al., 2003; Koch et al., 2004), suggesting that the two structures share
some common mechanisms for enhancing the coincidence detection of binaural excitatory
inputs. However, no tonotopic specializations have been reported in the morphological
and biophysical features in MSO. This might be related to the limited frequency range
that mammals use for the ITD extraction (below 1.5 kHz; Heffner & Heffner, 1988).
Nevertheless, more thorough studies need to be conducted in MSO along the tonotopic
axis.
Single unit recordings from the MSO of gerbils revealed that glycinergic inhibition
improved ITD processing for low-frequency sound (Brand et al., 2002). Suppression of
inhibition by the iontophoretic application of strychnine increased the firing rate of MSO
neurons and shifted the peak of ITD tuning curves from contralateral-leading ITD to 0 ITD.
They concluded that precisely timed inhibition from the contralateral ear via the medial
nucleus of the trapezoid body (MNTB) precedes the excitatory input from that side and
creates an effective delay in the excitatory response, which is essential for ITD coding (Brand
et al., 2002). The cell in MNTB is a relay neuron, which receives excitatory input from
contralateral globular bushy cells in the anteroventral cochlear nucleus, and projects
ipsilaterally to MSO and lateral superior olive (LSO) (Spangler et al., 1985; Adams &
Mugnaini, 1990; Cant & Hyson, 1922). The MNTB neurons are also sensitive to the sound
level (Tollin & Yin, 2005). In fact, the ITD tuning of MSO neurons could be maintained even
at loud sound (Pecka et al., 2008). It has also been shown that the processing of ILD in LSO,
which is a homologue of the LLD in birds, depends critically on timing; the timing of
contralateral inhibition through MNTB has to be matched with ipsilateral excitation
(Finlayson & Caspary, 1991; Smith et al., 1993; Joris & Yin, 1995; Tollin & Yin, 2005). These
evidences suggest that also mammals may use the time and level information of sounds
cooperatively to extract ITD and ILD cues.
9. Conclusion
We reviewed here how the ITD and ILD cues are precisely processed basing on the in vitro
and in vivo researches conducted in the chicken auditory brainstem. In the ITD coding
circuit, NL neurons show several functional as well as morphological refinements along the
tonotopic axis to enhance the coincidence detection at each frequency. In particular, the
expression of channel molecules is highly organized in NL neurons to regulate auditory
coincidence detection across frequencies. We need to know further how the subcellular
localization of these molecules contributes to the computation of neurons and also to the
behavior of animals. In addition, new evidences suggest that time and level information of
sounds are used not independently but rather cooperatively to improve the processing of
both ITD and ILD cues. Interaural difference cues can be small, particularly for an animal
with a small head. Both mammals and birds may use similar strategies to compensate the
small interaural difference cues for the accurate sound source localization.
Frequency Dependent Specialization for
Processing Binaural Auditory Cues in Avian Sound Localization Circuits
523
10. References
Adams, J.C. & Mugnaini, E. (1990). Immunocytochemical evidence for inhibitory and
disinhibitory circuits in the superior olive. Hear. Res., 49, 281-298,
Aston-Jones, G. & Bloom, F.E. (1981). Activity of NE-containing locus coeruleus neurons in
behaving rats anticipates fluctuations in the sleep-waking cycle. J. Neurosci., 1, 876-
886,
Bobker, D.H. & Williams, J.T. (1989). Serotonin augments the cationic current I
h
in central
neurons. Neuron, 2, 1535–1540,
Brand, A.; Behrend, O.; Marquardt, T.; McAlpine, D. & Grothe, B. (2002). Precise inhibition is
essential for microsecond interaural time difference coding. Nature, 417, 543-547,
Brugge, J.F. (1992). An overview of central auditory processing, In: The mammalian auditory
pathway: Neurophysiology, Popper, A.N. & Fay, R.R., (Ed.), 1-33, Springer-Verlag,
New York
Burger, R.M.; Cramer, K.S.; Pfeiffer, J.D. & Rubel, E.W. (2005). Avian superior olivary
nucleus provides divergent inhibitory input to parallel auditory pathways. J. Comp.
Neurol., 481, 6-18,
Cant, N.B. & Hyson, R.L. (1992). Projections from the lateral nucleus of the trapezoid body
to the medial superior olivary nucleus in the gerbil. Hear. Res., 58, 26-34,
Carr, C.E. & Konishi, M. (1988). Axonal delay lines for time measurement in the owl’s
brainstem. Proc. Natl. Acad. Sci. USA, 85, 8311-8315,
Carr, C.E. & Konishi, M. (1990). A circuit for detection of interaural time differences in the
brain stem of the barn owl. J. Neurosci., 10, 3227-3246,
Carr, C.E. & Boudreau, R.E. (1993). An axon with a myelinated initial segment in the bird
auditory system. Brain Res., 628, 330-334,
Casseday, J.H. & Neff, W.D. (1973). Localization of pure tones. J. Acoust. Soc. Am., 54, 365-372,
Catterall, W.A. (1981). Localization of sodium channels in cultured neural cells. J. Neurosci.,
1, 777-783,
Dasika, V.D.; White, J.A.; Carney, L.H. & Colburn, H.S. (2005). Effects of inhibitory feedback
in a network model of avian brain stem. J. Neurophysiol., 94, 400-411,
DiFrancesco, D.; Ferroni, A.; Mazzanti, M. & Tromba, C. (1986). Properties of the
hyperpolarizing-activated current (If) in cells isolated from the rabbit sino-atrial
node. J. Physiol., 377, 61-88,
DiFrancesco, D. & Tromba, C. (1988a). Inhibition of the hyperpolarization-activated current
(if) induced by acetylcholine in rabbit sino-atrial node myocytes. J. Physiol., 405,
477-491,
DiFrancesco, D. & Tromba, C. (1988b). Muscarinic control of the hyperpolarization-activated
current (if) in rabbit sino-atrial node myocytes. J. Physiol., 405, 493-510,
Finlayson, P.G. & Caspary, D.M. (1991). Low-frequency neurons in the lateral superior olive
exhibit phase-sensitive binaural inhibition. J. Neurophysiol., 65, 598-605,
Fujita, I. & Konishi, M. (1991). The role of GABAergic inhibition in processing of interaural
time difference in the owl’s auditory system. J. Neurosci., 11, 722-739,
Fukui, I. & Ohmori, H. (2004). Tonotopic gradients of membrane and synaptic properties for
neurons of the chicken nucleus magnocellularis. J. Neurosci., 24, 7514-7523,
Fukui, I.; Burger, R.M.; Ohmori, H. & Rubel E.W. (2010). GABAergic inhibition sharpens the
frequency tuning and enhances phase locking in the chicken nucleus
magnocellularis neurons. J. Neurosci., 30, 12075-12083,
Advances in Sound Localization
524
Heffner, R.S. & Heffner, H.E. (1988). Sound localization and use of binaural cues by the
gerbil (Meriones unguiculatus). Behav. Neurosci., 102, 422-428,
Jeffress, L.A. (1948). A place theory of sound localization. J. Comp. Physiol. Psychol., 41, 35-39,
Jones, B.E. & Moore, R.Y. (1977). Ascending projections of the locus coeruleus in the rat. II.
Autoradiographic study. Brain Res., 127, 25-53,
Joris, P.X. & Yin, T.C. (1995). Envelope coding in the lateral superior olive. I. Sensitivity to
interaural time differences. J. Neurophysiol., 73, 1043-1062,
Klump, G.M.; Windt, W. & Curio, E. (1986). The great tit’s (Parus major) auditory resolution
in azimuth. J. Comp. Physiol., 158, 383-390,
Klump, G.M. (2000). Sound localization in birds. In: Comparative Hearing: Birds and Reptiles,
Dooling, R.J.; Fay, R.R. & Popper, A.N. (Eds.), 249-307, Springer, New York
Knudsen, E.I. & Konishi, M. (1979). Mechanisms of sound localization in the barn owl (Tyto
alba). J. Comp. Physiol., 133, 13-21,
Koch, U.; Braun, M.; Kapfer, C. & Grothe, B. (2004). Distribution of HCN1 and HCN2 in rat
auditory brainstem nuclei. Eur. J. Neurosci., 20, 79-91,
Konishi, M. (2003). Coding of auditory space. Annu. Rev. Neurosci., 26, 31-55,
Kuba, H.; Koyano, K. & Ohmori, H. (2002). Development of membrane conductance
improves coincidence detection in the nucleus laminaris of the chicken. J. Physiol.,
540, 529-542,
Kuba, H.; Yamada, R. & Ohmori, H. (2003). Evaluation of the limiting acuity of coincidence
detection in nucleus laminaris of the chicken. J. Physiol., 552, 611-620,
Kuba, H.; Yamada, R.; Fukui, I. & Ohmori, H. (2005). Tonotopic specialization of auditory
coincidence detection in nucleus laminaris of the chick. J. Neurosci., 25, 1924-1934,
Kuba, H.; Ishii, T.M. & Ohmori, H. (2006). Axonal site of spike initiation enhances auditory
coincidence detection. Nature, 444, 1069-1072,
Lachica, E.A.; Rubsamen, R. & Rubel, E.W. (1994). GABAergic terminals in nucleus
magnocellularis and laminaris originate from the superior olivary nucleus. J. Comp.
Neurol., 348, 403-418,
Ludwig, A.; Zong, X.; Jeglitsch, M.; Hofmann, F. & Biel, M. (1998). A family of
hyperpolarization-activated mammalian cation channels. Nature, 393, 587–591,
Luscher, H.R. & Larkum, M.E. (1998). Modeling action potential initiation and back-
propagation in dendrites of cultured rat motoneurons. J. Neurophysiol., 80, 715-729,
Mainen, Z.F.; Foerges, J.; Huguenard, J.R. & Sejnowski, T.J. (1995). A model of spike
initiation in neocortical pyramidal neurons. Neuron, 15, 1427-1439,
Manley, G.A.; Koppl, C. & Konishi, M. (1988). A neural map of interaural intensity
differences in the brain stem of the barn owl. J. Neurosci., 8, 2665-2676,
Masterton, B.; Thompson, G.C.; Bechtold, J.K. & RoBards, M.J. (1975). Neuroanatomical
basis of binaural phase-difference analysis for sound localization: a comparative
study. J. Comp. Physiol. Psychol., 89, 379-386,
Mills, A.W. (1958). On the minimum audible angle. J. Acoust. Soc. Am., 30, 237-246,
Mogdans, J. & Knudsen, E.I. (1994). Representation of interaural level difference in the
VLVp, the first site of binaural comparison in the barn owl's auditory system. Hear.
Res., 74, 148-164,
Moiseff, A. & Konishi, M. (1981). Neuronal and behavioral sensitivity to binaural time
differences in the owl. J. Neurosci., 1, 40-48,
Frequency Dependent Specialization for
Processing Binaural Auditory Cues in Avian Sound Localization Circuits
525
Moiseff, A. & Konishi, M. (1983). Binaural characteristics of units in the owl's brainstem
auditory pathway: precursors of restricted spatial receptive fields. J. Neurosci., 3,
2553-2562,
Monsivais, P.; Yang, L. & Rubel, E.W. (2000). GABAergic inhibition in nucleus
magnocellularis: implications for phase locking in the avian auditory brainstem. J.
Neurosci., 20, 2954-2963,
Nishino, E.; Yamada, R.; Kuba, H.; Hioki, H.; Furuta, T.; Kaneko, T. & Ohmori, H. (2008).
Sound-intensity-dependent compensation for the small interaural time difference
cue for sound source localization. J. Neurosci., 28, 7153-7164,
Oertel, D. (1999). The role of timing in the brain stem auditory nuclei of vertebrates. Annu.
Rev. Physiol., 61, 497-519,
Overholt, E.M.; Rubel, E.W. & Hyson, R.L. (1992). A circuit for coding interaural time
differences in the chick brainstem. J. Neurosci., 12, 1698-1708,
Pape, H.C. (1996). Queer current and pacemaker: the hyperpolarization-activated cation
current in neurons. Annu. Rev. Physiol., 58, 299–327,
Park, T.J. & Dooling, R.J. (1991). Sound localization in small birds: absolute localization in
azimuth. J. Comp. Psychol., 105, 125-133,
Parks, T.N. (2000). The AMPA receptors of auditory neurons. Hear. Res., 147, 77-91,
Pecka, M.; Brand, A.; Behrend, O. & Grothe, B. (2008). Interaural time difference processing
in the mammalian medial superior olive: the role of glycinergic inhibition. J.
Neurosci., 28, 6914-6925,
Pena, J.L.; Viete, S.; Albeck, Y. & Konishi, M. (1996). Tolerance to sound intensity of binaural
coincidence detection in the nucleus laminaris of the owl. J. Neurosci., 16, 7046-7054,
Rathouz, M. & Trussell, L.O. (1998). Characterization of outward currents in neurons of the
avian nucleus magnocellularis. J. Neurophysiol., 80, 2824-2835,
Reyes, A.D.; Rubel, E.W. & Spain, W.J. (1996). In vitro analysis of optimal stimuli for phase-
locking and time-delayed modulation of firing in avian nucleus laminaris neurons.
J. Neurosci., 16, 993-1007,
Rosenberger, M.H.; Fremouw, T.; Casseday, J.H. & Covey, E. (2003). Expression of Kv1.1 ion
channel subunit in the auditory brainstem of the big brown bat, Eptesicus fuscus. J.
Comp. Neurol., 462, 101-120,
Rubel, E.W. & Parks, T.N. (1975). Organization and development of the brain stem auditory
nuclei of the chicken: tonotopic organization of N. magnocellualris and N.
laminaris. J. Comp. Neurol., 164, 411-434,
Santoro, B.; Liu, D.T.; Yao, H.; Bartsch, D.; Kandel, E.R.; Siegelbaum, S.A. & Tibbs, G.R.
(1998). Identification of a gene encoding a hyperpolarization-activated pacemaker
channel of brain. Cell, 93, 717-729,
Santoro, B. & Tibbs, G.R. (1999). The HCN gene family: molecular basis of the
hyperpolarization-activated pacemaker channels. Ann. N.Y. Acad. Sci., 868, 741–764,
Sato, T.; Fukui, I. & Ohmori, H. (2010). Interaural phase difference modulates the neural
activity in the nucleus angularis and improves the processing of level difference
cue in the lateral lemniscal nucleus in the chicken. Neurosci. Res., 66, 198-212,
Scheibel, M.E. & Scheibel, A.B. (1974). Neuropil organization in the superior olive of the cat.
Exp. Neurol., 43, 339-348,
Advances in Sound Localization
526
Scott, L.L.; Mathews, P.J. & Golding, N.L. (2005). Posthearing developmental refinement of
temporal processing in principal neurons of the medial superior olive. J. Neurosci.,
25, 7887-7895,
Smith, A.J.; Steven, O. & Forsythe, I.D. (2000). Characterization of inhibitory and excitatory
postsynaptic currents of the rat medial superior olive. J. Physiol., 529, 681-698,
Smith, P.H.; Joris, P.X. & Yin, T.C. (1993). Projections of physiologically characterized
spherical bushy cell axons from the cochlear nucleus of the cat: evidence for delay
lines to the medial superior olive. J. Comp. Neurol., 331, 245-260,
Smith, P.H. (1995). Structural and functional differences distinguish principal from
nonprincipal cells in the guinea pig MSO slice. J. Neurophysiol., 73, 1653-1667,
Spangler, K.M.; Warr, W.B. & Henkel, C.K. (1985). The projections of principal cells of the
medial nucleus of the trapezoid body in the cat. J. Comp. Neurol., 238, 249-262,
Sullivan, W.E. & Konishi, M. (1984). Segregation of stimulus phase and intensity coding in
the cochlear nucleus of the barn owl. J. Neurosci., 4, 1787-1799,
Svirskis, G.; Kotak, V.; Sanes, D.H. & Rinzel. J. (2002). Enhancement of signal-to-noise ratio
and phase locking for small inputs by a low-threshold outward current in auditory
neurons. J. Neurosci., 22, 11019-11025,
Takahashi, T.; Moiseff, A. & Konishi, M. (1984). Time and intensity cues are processed
independently in the auditory system of the owl. J. Neurosci., 4, 1781-1786,
Takahashi, T.T. & Konishi, M. (1988). Projections of nucleus angularis and nucleus laminaris
to the lateral lemniscal nuclear complex of the barn owl. J. Comp. Neurol., 274, 212-
238,
Tollin, D.J. & Yin, T.C. (2005). Interaural phase and level difference sensitivity in low-
frequency neurons in the lateral superior olive. J. Neurosci., 25, 10648-10657,
Trussell, L.O. (1999). Synaptic mechanisms for coding timing in auditory neurons. Annu.
Rev. Physiol., 61, 477-496,
Warchol, M.E. & Dallos, P. (1990). Neural coding in the chick cochlear nucleus. J. Comp.
Physiol. A, 166, 721-734,
Yamada, R.; Kuba, H.; Ishii, T.M. & Ohmori, H. (2005). Hyperpolarization-activated cyclic
nucleotide-gated cation channels regulate auditory coincidence detection in
nucleus laminaris of the chick. J. Neurosci., 25, 8867-8877,
Yang, L.; Monsivais, P. & Rubel, E.W. (1999). The superior olivary nucleus and its influence
on nucleus laminaris: a source of inhibitory feedback for coincidence detection in
the avian auditory brainstem. J. Neurosci., 19, 2313-2325,
Yin, T.C. (2002). Neural Mechanisms of Encoding Binaural Localization Cues in the
Auditory Brainstem. In: Integrative Functions in the Mammalian Auditory Pathway,
Oertel, D, (Ed), 99-159, Springer-Verlag, New York
Young, S.R. & Rubel, E.W. (1983). Frequency-specific projections of individual neurons in
chick brainstem auditory nuclei. J. Neurosci., 3, 1373-1378,
Frédéric Bénard
1
, Hervé Glotin
2
and Pascale Giraudet
3
1,2
Systems & Information Sciences Laboratory (LSIS - UMR 6168 USTV&CNRS),
Université du Sud-Toulon-Var
3
Department of Biology, Université du Sud-Toulon-Var
France
1. Introduction
In this paper, we compare two low cost time-domain tracking algorithms based on passive
acoustics. The problem consists in tracking an unknown number of sperm whales (Physeter
catodon). Clicks are recorded on two datasets of 20 and 25 minutes on an open-ocean
widely-spaced bottom-mounted hydrophone array. The output of the method is the track(s)
of the Marine Mammal(s) (MM) in 3D space and time. Firstly, we briefly review studies
of the Stochastic Matched Filter (SMF) detector and its performances with a reflected click
cancellation, the Teager-Kaiser-Mallat (TKM) filtering, the source separation methods and
the main characteristics of MM signals. Then, we propose a real-time algorithm for MM
transient call localization. We also recall the Cramér-Rao Lower Bound (CRLB) Kay (1993)
and the confidence ellipses theory to predict the reachable accuracy and compare it to the
tracking results. In Section 3 we show and compare results of track estimates with results from
specialized teams and compare SMF versus TKM localization. Then, the system is evaluated
with the confidence ellipses on the trajectories. Finally, we discuss on the possible dynamic
behavior of the whale that these localizations offer, like hunting and foraging strategies.
This paper deals with the 3D tracking of MM using a widely-spaced bottom-mounted
hydrophone array in deep water. It focuses on sperm whale clicks. There were previous
algorithms developed in the state of the art Giraudet & Glotin (2006a;b); Morrissey et al.
(2006); Nosal & Frazer (2006) but none of them has satisfying results for multiple tracks and
most of them are far from being real-time. Our main goal is to build a robust and real-time
tracking model, despite ocean noise, multiple reflected clicks, imprecise sound speed profiles,
an unknown number of MM, and the non-linear time-frequency structure of most MM signals.
Background ocean noise results from the addition of several noises: sea state, biological noises,
ship noise and molecular turbulence. Propagation characteristics from an acoustic source to
an array of hydrophones include multipath effects (and reverberations, Fig. 1), which create
secondary peaks in the Cross-Correlation (CC) function that the generalized CC methods
cannot eliminate. In Caudal & Glotin (2008b); Glotin et al. (2008), we gave an extension
of Giraudet & Glotin (2006b) that shows multiple tracking using TKM. Here we improve
this model using SMF which also allows an efficient Inter-Click-Interval and reflected click
removal process.
Highly Defined Whale Group Tracking
by Passive Acoustic Stochastic Matched Filter
28
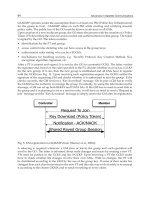
Fig. 1. (A): on the top, a raw signal from dataset2 (D2) and hydrophone 7 (H7) during the first
10 s of recording, containing 7 clicks and their reflected click. At the bottom, 10 s from dataset
1 (D1), hydrophone 1 (H1) containing several (4) simultaneous emitting whale clicks and the
reflected clicks. (B): a click train with reflected click from a single sperm whale. We can see an
Inter-Click-Interval (ICI), and two false ICI between direct and reflected clicks. (C): Example
of a raw multipe whales’ signal on H1 (10 s) (top) and the corresponding Λ
(x) presented in
paragraph 3.2 with the threshold in a log-scale (middle) and the thresholded signal (bottom).
528
Advances in Sound Localization
21 22 23 24 25 26 27 28 29 30
60
40
20
0
20
40
60
80
H1
21 22 23 24 25 26 27 28 29 30
10
5
0
5
H2
21 22 23 24 25 26 27 28 29 30
5
0
5
10
H3
21 22 23 24 25 26 27 28 29 30
8
6
4
2
0
2
4
6
8
H6
Fig. 2. H1 to H6: plots of a 10 sec samples of raw signals from the four hydrophones of the
dataset D1 (time in sec).
2. Hydrophone array characteristics
2.1 Records Settings
D Hydro Dist (m) X(m) Y(m) Z(m)
D1
H1 5428 18501 9494 -1687
H2 4620 10447 4244 -1677
H3 2514 14119 3034 -1627
H4 1536 16179 6294 -1672
H5 3126 12557 7471 -1670
H6 4423 17691 1975 -1633
D2
H7 1518 10658 -14953 -1530
H8 4314 12788 -11897 -1556
H9 2632 14318 -16189 -1553
H10 3619 8672 -18064 -1361
H11 3186 12007 -19238 -1522
Table 1. Hydrophones positions: Dist=Distance to the barycenter of the set. (H4 and H5 are
out of order)
The signals are records of March 2002 from the ocean floor (about 1500 m) near Andros Island -
Bahamas (Tab.1), provided with celerity profiles. Datasets are sampled at 48 kHz and contain
MM clicks and whistles, background noises like distant engine boat noises. Dataset1 (D1)
is recorded on hydrophones 1 to 6 during 20 min (see Fig.2 for a sample view) while the
dataset 2 (D2) is recorded on hydrophones 7 to 11 with 25 min length. We will use a constant
sound speed with c
= 1500ms
−1
or a linear profile with c(z)=c
0
+ gz,wherez is the depth,
529
Highly Defined Whale Group Tracking by Passive Acoustic Stochastic Matched Filter
c
0
= 1542ms
−1
is the sound speed at the surface and g = 0.051s
−1
is the gradient Caudal &
Glotin (2008b). Sound source tracking is performed by continuous localization in 3D using
Time Delays Of Arrival (TDOA) estimation from four hydrophones (Tab.1).
2.2 Cramér-Rao lower bound from the hydrophone array geometry
For each hydrophones array, the Cramér-Rao Lower Bound (CRLB) provides the maximum
accuracy for the estimation of any source position. Considering a constant sound speed
profile, the function model of the Time Delay Of Arrival (TDOA) is defined by:
s
(θ)=
1
c
s
||X
i
−θ||−||X
j
−θ||, ||X
i
−θ||−||X
k
−θ||, ||X
i
−θ||−||X
l
−θ||
T
,(1)
where
|| || denotes the euclidian norm, X
i
is the hydrophone i vector coordinate, θ is the
unknown parameters vector
[xyz]
T
and c
s
the celerity. Here i = 1, j = 2, k = 3, l = 4. Thus,
considering the TDOA noise as a Gaussian process and B its variance-covariance matrix, the
Fisher Information matrix is:
I
θ
= ∇
θ
s(θ)B
−1
∇
T
θ
s(θ).(2)
Then, the CRLB is B
θ
= I
−1
θ
. The solution error ellipses are contours of constant value of the
inner product θIθ.
We compute the CRLB (in meter) in the space (x,y,z) and plot the values for both datasets
(Fig.3). We consider that the standard deviation of the noise is equal to the quantification
noise with a sampling frequency of 480 Hz. The main dependencies of the bounds are the
noise and the array configuration. In figures 3.A to F, the CRLB on y and z is shown for a
depth of 500 m, and is just about the same for a depth of 1000 m as shown in figures 3.G-H.
3. Filters design
3.1 Teager-Kaiser-Mallat filtering
A sperm whale click is a transient increase of signal energy lasting about 20 ms (Fig.1).
Therefore, we use the Teager-Kaiser (TK) energy operator Kandia & Stylianou (2006) on the
discrete data:
Ψ
[x(n)] = x
2
(n) −x(n + 1)x(n − 1),(3)
where n denotes the sample number. Considering the raw signal s
(n) (sample n of the raw
signal) as:
s
(n)=x(n)+u(n),(4)
where x
(n) is the signal of interest (click), u(n) is an additive noise defined as a process
realization considered Wide Sense Stationary (WSS) Gaussian during a short time. By
applying TK to s
(n), Ψ[s(n)] is:
Ψ
[s(n)] ≈ Ψ[x(n)] + w(n),(5)
where w
(n) is a random gaussian process Kandia & Stylianou (2006). The output is dominated
by the clicks energy. Then, we reduce the sampling frequency to 480 Hz by the mean of
100 adjacent bins to reduce the variance of the noise. We apply the Mallat’s algorithm
530
Advances in Sound Localization
Fig. 3. CRLB values scaled in gray colors with a plan view: black means a null CRLB and
white a CRLB
≥10 m. For the figures A to F, a depth of 500 m was chosen. (A): CRLB on x
values, dataset D1. (B): y, D1. (C): z, D1. (D): x, D2. (E): y, D2. (F): z, D2. (G): CRLB on y axis,
plan view, dataset D1, depth=1000 m. (H): CRLB on z axis, plan view, dataset D1,
depth=1000 m.
531
Highly Defined Whale Group Tracking by Passive Acoustic Stochastic Matched Filter