Desalination Trends and Technologies Part 6 doc
Bạn đang xem bản rút gọn của tài liệu. Xem và tải ngay bản đầy đủ của tài liệu tại đây (2.33 MB, 25 trang )
Desalination, Trends and Technologies
114
expensive process, but the inclusion of renewable energy sources and the adaptation of
desalination technologies to renewable energy supplies can in some cases be a particularly
less expensive and economic way of providing water. The utilization of conventional energy
sources and desalination technologies, notably in conjunction with cogeneration plants, is
still more cost effective than solutions based on only renewable energies and, thus, is
generally the first choice.
In closing, the world's water demands are rising considerably. Much research has been
directed at addressing the challenges in using renewable energy to meet the power needs for
desalination plants. Renewable energy technologies are rapidly emerging with the promise
of economic and environmental viability for desalination. There is a need to accelerate the
development of novel water production systems from renewable energies. These
technologies will help to minimize environmental concerns. Our investigation has shown
that there is great potential for the use of renewable energy in many parts of the world.
Solar, wind, wave, geothermal and even nuclear sources could provide a viable source of
energy to power both seawater and the brackish water desalination plants. Finally, it must
be noted that part of the solution to the world’s water shortage is not only to produce more
water, but also to do it in an environmentally sustainable way and to use less of it. This is a
challenge that we should well be able to meet.
7. References
Alcocer, S. M. and Hiriart G. (2008). An applied research program on water desalination
with renewable energies. Am. J. Environ. Sci., 4, 3, 204-211
Al-Hallaj, S.; Farid, M. M. and Tamimi, A. R. (1998). Solar desalination with a
humidification-dehumidification cycle: performance of the unit. Desalination, 120,
273-280
BlurbWire (2010). Kiwana desalination plant
(
(accessed 8 August 2010)
Bouchekima B. (2003). A small solar desalination plant for the production of drinking water
in remote arid areas of southern Algeria. Desalination, 159, 197–204
Bourouni K.; Martin R.and Tadrist, L. (1999a). The International Workshop on Desalination
Technologies for Small and Medium Size Plants With Limited Environmental
Impact, Rome , Italy (03/12/1998), vol. 122, no 2-3, pp. 301-313
Bourouni K.; Martin R.; Tadrist L. and Chaibi M.T. (1999b). Heat transfer and evaporation in
geothermal desalination units, Applied Energy, 64, 1, 129-147
Bourouni. K, and Chaibi M. T. (2005). Application of geothermal energy for brackish water
desalination in the south of Tunisia. Proceedings World Geothermal Congress, Antalya,
Turkey, 24-29 April
Bourouni K.; Chaibi M. T. And Tadrist, L. (2001). Water desalination by humidification and
dehumidification of air: state of the art. Desalination, 137, 167–176
Burgess, G. and Lovegrove, K. (2005). Solar thermal powered desalination: membrane
versus distillation technologies (online: solar-thermal.anu.edu.au/wp-
content/uploads/DesalANZSES05.pdf) (accessed 14 August 2010)
Cataldi, R., S. Hodgson and J. Lund (editors), 1999. Stories from a Heated Earth – Our
Geothermal Heritage, Geothermal Resources Council, Davis, CA, 569 p.
Application of Renewable Energies for Water Desalination
115
Chapa, J. (2007) Wave energy: Aquabuoy 2.0
( />power-generator/) (accessed 16 August 2010)
Charcosset, C. (2009). A review of membrane processes and renewable energies for
desalination. Desalination, 245, 214–231
Childs, W. D.; Dabiri, A. E.; Al-Hinai, H. A. and Abdullah, H. A. (1999) VARI-RO solar
powered desalting study. Desalination, 125, 155-166
Cristo, M. W. and Kovalcik, M. P. (2008). Population pressure and the future of Saudi state
stability. Master of Science Thesis, Naval Postgraduate School, Monterey CA,
December, 77pp.
Davies P.A. and Paton C. (2005). The seawater greenhouse in the United Arab Emirates:
Thermal modelling and evaluation of design options. Desalination, 173,103-111
Davies, P.A. (2005) Wave-powered desalination: resource assessment and review of
technology, Desalination, 186, 97–109
Drude, B. C. (1967). Submarine units for reverse osmosis, Desalination, 2, 325–328
Dubowsky, S.; Wiesman, R.; Bilton, A.; Kelley, L. and Heller, R. (2010). Smart power and
water for challenging environments. MIT current projects
( (accessed 20 August 2010)
Eltawil, M. A.; Zhengminga, Z. and Yuana, L. (2009). A review of renewable energy
technologies integrated with desalination systems. Renewable and Sustainable Energy
Reviews. 13, 9, 2245-2262
Fahrenbruch, A. and Bube, R. H. (1983). Fundamentals of solar Cells. Academic Press, Orlando
FL, USA. 559pg
Fath, M. E. S. (1998). Solar desalination: A promising alternative for water provision with
free energy, simple technology and a clean environment. Desalination, 116, 45-56
Fekraoui A. and Kedaid F. (2005). Geothermal resources and uses in Algeria: A country
update report. Proceedings World Geothermal Congress 2005, Antalya, Turkey, 24-29
April.
Fernández J. L. and Norberto Chargoy N. (1990). Multistage, indirectly heated solar still.
Solar Energy, 44, 4, 215-223
Fridleifsson, I. B.; Bertani, R.; Huenges, E.; Lund, J. W.; Ragnarsson, A. and Rybach, L.
(2008). The possible role and contribution of geothermal energy to the mitigation of
climate change. In: IPCC Scoping Meeting on Renewable Energy Sources, Proceedings,
O. Hohmeyer and T. Trittin (Eds.) Luebeck, Germany, 20-25 January, 59-80
Glueckstern, P. (1982). Preliminary considerations of combining a large reverse osmosis
plant with the Mediterranean–Dead Sea project, Desalination, 40, 143–156
Goosen M. F. A. and Shayya W. (1999). Water management, purification and conservation in
arid climates. In: Water Management, Purification and Conservation in Arid Climates:
Volume I Water Management. M. F. A. Goosen and W. H. Shayya (EDS.), Technomic
Publishing Co., Lancaster, Pennsylvania, 1-6
Goosen, M. F. A.; Sablani, S.; Shayya, W. H.; Paton, C. and Al-Hinai, H. (2000).
Thermodynamic and economic considerations in solar desalination”, Desalination,
129, 63-89
Goosen, M. F. A.; Sablani, S.; Paton, C.; Perret, J.; Al-Nuaimi, A.; Haffar, J.; Al-Hinai, H. and
Shayya, W. (2003). Solar energy desalination for arid coastal regions: development of
a humidification-dehumidification seawater greenhouse, Solar Energy, 75, 413-419
Desalination, Trends and Technologies
116
Goosen, M. F. A.; Mahmoudi, H. and Ghaffour, N. (2010). Water desalination using
geothermal Energy. Energies, 3, 1423-1442
Houcine, I.; Benjemaa, F.; Chahbani, M. H. and Maalej, M. (1999) Renewable energy sources
for water desalting in Tunisia. Desalination, 125, 1–3,123–32
Huang, S. and Liu, J. (2010). Geothermal energy stuck between a rock and a hot place,
Nature, 463, 293
International Desalination Association (IDA) Conference (2008). 360 Environmental
Presentation, Gran Canaria, 2007 & Environmental Management Consultants
Newsletter, Perth, 2008 (
Kadyrzhanov, K. K.; Lukashenko, S. N. and Lushchenko, V. N. (2007). Assessment of
environmental impact of reactor facilities in Khazakstan. In: Safety Related Issues of
Spent Nuclear Fuel Storage, J. D. B. Lambert and K. K. Kadyrzhanov (Eds), Springer.
( (accessed 10 August
2010)
Kagel, A.; Bates, D. and Gawell, K. (2005). A guide to geothermal energy and the environment,
Geothermal Energy Association, Washington, D. C., 75 p.
Kalogirou S. (2005). Seawater desalination using renewable energy sources. Progress in
Energy and Combustion Science; 31, 242-281
Kedaid, F. Z. (2007). Database on the geothermal resources of Algeria. Geothermics, 36, 3, 265-
275
Khamis, I. (2009). A global overview on nuclear desalination. Int. J. of Nuclear Desalination, 3,
4, 311-328
Koschikowski, J. and Heijman, B. (2008). Renewable energy drives desalination processes in
remote or arid regions. Membrane Technology, 8, August, 8-9
Laboy, E.; Schaffner, F.; Abdelhadi, A. And Goosen, M.F.A. (Eds), (2009). Environmental
Management, Sustainable Development & Human Health, Taylor & Frances (Balkema
NDL) London. 35 Chapts, 594 pp ISBN: 978-0-415-46963-0
Lu, H.; Walton, J. C. and Swift, A. H. P. (2000). Zero discharge desalination. Int Desalination
Water Reuse Q, 10, 3, 35–43
Lund, J. W. (2006). Chena Hot Springs, Geo-Heat Center Quarterly Bulletin, 27, 3 (September),
Klamath Falls, OR, 2-4
Lund, J. W. (2007). Characteristics, development and utilization of geothermal resources,
GHC Bulletin, June, 1-9
Magagna, D. and Muller, G. (2009). A wave energy driven RO stand-alone desalination
system: initial design and testing. Desalination and Water Treatment, 7, 47–52
Mahmoudi, H.; Spahis, N.; Goosen, M.F.A.; Ghaffour, N.; Drouiche N. and Ouagued, A.
(2010). Application of geothermal energy for heating and fresh water production in
a brackish water greenhouse desalination unit: A case study from Algeria, J. Renew
Sustain Energy Rev, 14, 1, 512-517
Mahmoudi, H.; Spahis, N.; Goosen, M.F.A.; Sablani, S.; Abdul-Wahab, S.; Ghaffour, N. and
Drouiche, N. (2009a). Assessment of wind energy to power solar brackish water
greenhouse desalination units: A case study from Algeria. J. Renew Sustain Energy
Rev, doi:10.1016/j.rser.2009.03.001
Mahmoudi, H.; Ouagued, A. and Ghaffour, N. (2009b). Capacity building strategies and
policy for desalination using renewable energies in Algeria, J. Renew Sustain Energy
Rev; 13, 921–926
Application of Renewable Energies for Water Desalination
117
Mahmoudi, H. ; Abdul-Wahab, S. A.; Goosen, M. F. A. ; Sablani, S. S. ; Perret, J. and
Ouagued, A. (2008). Weather data and analysis of hybrid photovoltaic–wind power
generation systems adapted to a seawater greenhouse desalination unit designed
for arid coastal countries, Desalination, 222, 119–27
Misra, B. M. (2010). Sustainable desalination technologies for the future. Int. J. of Nuclear
Desalination, 4, 1, 37-48
Ophir, A. (1982). Desalination plant using low grade geothermal heat, Desalination, 40, 125–
32
Pacenti, P.; de Gerloni, M.; Reali, M.; Chiaramonti, D.; Gärtner, G. O.; Helm, P. and Stöhr, M.
(1999). Submarine seawater reverse osmosis desalination system, Desalination, 126,
213–218
Pankratz, T. (2008). Water desalination report (WDR), MEDRC Workshop, Muscat
(www.waterdesalreport.com)
Paton, C. and Davies, A. (1996). The seawater greenhouse for arid lands. Proc. Mediterranean
Conference on Renewable Energy Sources for Water Production, Santorini, Greece, 10–12
June
Popiel, C.; Wojtkowiak, J. and Biernacka, B. (2001). Measurements of temperature
distribution in ground. Exp Thermal Fluid Sci, 25, 301–9
Reali, M.; de Gerloni, M. and Sampaolo, A. (1997). Submarine and underground reverse
osmosis schemes for energy-efficient seawater desalination, Desalination, 109, 269–
275
Reif, T. 2008 Profitability analysis and risk management of geothermal projects, GHC
Bulletin, January, 1-4
Rodrıguez, G.; Rodrıguez, M., Perez, J. and Veza, J. (1996). A systematic approach to
desalination powered by solar, wind and geothermal energy sources, In:
Proceedings of the Mediterranean conference on renewable energy sources for water
production. European Commission, EURORED Network, CRES, EDS, Santorini,
Greece, 10–12 June, 20–5
Rybach, L. (2007). Geothermal sustainability, Proceedings European Geothermal Congress,
Unterhaching, Germany, 5 p.
Sablani, S.; Goosen, M. F. A.; Paton, C.; Shayya, W. H. and Al-Hinai, H. (2003). Simulation of
fresh water production using a humidification–dehumidification Seawater
Greenhouse. Desalination, 159,283–288
Sadhwani, J. J. and Veza, J. M. (2008). Desalination and energy consumption in Canary
Islands, Desalination 221, 143–150
Schwarzer K., Vieira M.E., Faber C. and Müller C. (2001) Solar thermal desalination system with
heat recovery. Desalination, 137 (1-3), 23-29.
Serpen, U.; Aksoy, N. and Öngür, T. 2010. 2010 present status of geothermal energy in
Turkey, Proceedings of Thirty-Fifth Workshop on Geothermal Reservoir Engineering,
Stanford University, Stanford, California, 1-3 February SGP-TR-188
Soerensen, B. (1979). Renewable Energy. London: Academic Press.
Stefansson, V. (2005). World geothermal assessment. Proceedings of the World Geothermal
Congress, Antalya, Turkey, 24-29 April ()
Stock Trading (2010). How quickly will Saudi Arabia turn to nuclear vitality? (July 3
rd
, 2010
by admin) ( /> Desalination, Trends and Technologies
118
trading/stock-trading-how-quickly-will-saudi-arabia-turn-to-nuclear-vitality)
(accessed on 27 July 2010)
Szacsvay, T.; Hofer-Noser, P. and Posnansky, M. (1999). Technical and economic aspects of
small-scale solar-pond-powered seawater desalination systems. Desalination, 122,
185–93
Tester, J. W.; Anderson, B. J.; Batchelor, A. S.; Blackwell, D. D.; DiPippo, R.; Drake, E. M.;
Garnish, J.; Livesay, B.; Moore, M. C.; Nichols, K.; Petty, S.; Toksoz, M. N.; Veatch,
R. W.; Baria, R.; Augustine, C.; Murphy, E.; Negraru, P. and Richards, M. (2007).
Impact of enhanced geothermal systems on U. S. energy supply in the twenty-first
century, Phil Trans R Soc A, 365, 1057-1094
( ISBN:
9780615134383
Tzen, E.; Theofilloyianakos, D and Karamanis, K. (2004). Design and development of a
hybrid autonomous system for seawater desalination. Desalination, 166, 267–274
USBR (U.S. Bureau of Reclamation) (2003). Cost estimating procedures. In Desalting
Handbook for Planners, 3rd ed.; Desalination and Water Purification Research and
Development Program Report No. 72; United States Department of Interior, Bureau
of Reclamation, Technical Service Center, US Government Printing Office:
Washington DC, USA, Chapter 9, pp. 187–231
U.S. Census Bureau, (2004). Table A-4 Population by Region and Country 1950-2050,
(
U. S. Energy Information Administration/ International/ Country Briefs/ Saudi Arabia
(2010). ( (Accessed 27
July 2010)
Wash Technology, (2009). Geothermal desalination: hot rocks key to producing low cost
fresh water. 9 December
Water Corporation (2002) Perth Metropolitan Desalination Proposal, Perth
White, D. E. and Williams, D. L. (Eds.), (1975). Assessment of geothermal resources of the
United States – 1975, U.S. Geological Survey Circular 727, U.S., Government
Printing Office, 155 p.
Wright, J. D. (1982) Selection of a working fluid for an organic Rankine cycle coupled to a
salt-gradient solar pond by direct-contact heat exchange, J. Sol. Energy Eng., 104, 4,
286 293
Wright, M. (1998). Nature of Geothermal Resources, in Geothermal Direct-Use Engineering and
Design Guidebook, John W. Lund,(Ed), Geo-Heat Center, Klamath Falls, OR, 27-69
6
Seawater Desalination:
Trends and Technologies
Val S. Frenkel, Ph.D., P.E., D.WRE.
Kennedy/Jenks Consultants,
USA
1. Introduction
Figure 1 below provides information on our planet’s available water resources which do not
allow too many alternatives.
Fig. 1. Water Resources on the Earth
With 97% of available water represented by salty water with the Salinity Level > 35 g/l, the
largest possible source of alternative water supply requires and will require desalination.
The conventional water treatment technologies have been known and widely used for
centuries, and some, like media filtration, were applied thousands of years ago, while
Desalination, Trends and Technologies
120
membranes were introduced to water treatment just in the second half of the 20
th
Century.
Development of the first high pressure membrane, Reverse Osmosis (RO) was claimed at
University of California in Los Angeles (UCLA) in 1962, and commercialized by the early
1970s The low pressure membranes, Microfitration (MF) and Ultrafiltration (UF) were
commercialized for drinking water treatment just about one decade ago. Because they
provide significant technical benefits and have become cost-competitive, membrane
technologies are rapidly displacing and replacing traditional processes verified by the
centuries.
The oldest desalination methods are based on evaporating water and collecting the
condensate. The best known commercially applied thermal technologies are:
- Multi Stage Flash (MSF)
- Multi Effect Distillation (MED
- Vapor Compression (VC)
While MSF, MED, and VC use thermal power to separate water from the brine,
Electrodialisys Reversal (EDR) uses high voltage current to remove Cations and Anions
from the stream.
The newest commercial technology for Desalination is based on membrane treatment.
Reverse Osmosis (RO) and Brackish Water Reverse Osmosis (BWRO) or Sea Water
Reverse Osmosis (SWRO), are the fastest growing desalination techniques with the greatest
number of installations around the globe. Desalination by RO is beginning to dominate the
current and future desalination markets. As seen in the chart below, the number of
membrane desalination installations is close to 80% of all desalination facilities.
T o t a l N u m b e r o f D e s a li n a t io n P l a n t s ~ 1 4 , 0 0 0
Thermal
Desalination 20%
Mem brane
Desalination
80%
MSF,
45%
MED,
25%
VC, 30%
EDR, 10%
RO, 90%
Fig. 2. Number of desalination plants worldwide. RO - Reverse Osmosis, EDR - Electro
Dialysis Reversal, MSF - Multi Stage Flash, MED - Multi Effect Distillation, VC - Vapor
Compression
Seawater Desalination: Trends and Technologies
121
The first RO desalination membranes were developed in the first half of the 20
th
Century.
Desalination by RO entered the commercial market in the early
1970s when the membrane
manufacturing process became efficient enough to produce desalted water that was
competitive to thermal processes, and when the technological process for RO desalination
was well established.
While leading in the number of installations, desalination by RO still provides only a
comparable capacity to the thermal processes:
T o t a l C a p a c i t y o f D e s a li n a t i o n P l a n t s
~ 7 , 0 0 0 , 0 0 0 M G D
Membrane
Desalination
50%
Thermal
Desalination
50%
EDR, 10%
RO, 90%
VC, 10%
MSF,
85%
MED, 5%
Fig. 3. Desalination Capacity Worldwide. RO - Reverse Osmosis, EDR - Electro Dialysis
Reversal, MSF - Multi Stage Flash, MED - Multi Effect Distillation, VC - Vapor Compression
The lack of correlation between the number of installations and overall capacities can be
explained by the development of membrane desalination. Thermal processes have been on
the market for more than five decades and most of them provide relatively high capacities.
However, this ratio is expected to change significantly because most of the desalination
systems currently designed, constructed, and considered for construction are based on
membrane technology. For example, the largest membrane desalination plant in the U.S. is
the Tampa Bay SWRO, with a capacity of 25 MGD / 95,000 m3/day (and provision for up to
35 MGD / 130,000 m3/day expansion). The plant went into the operation in 2003. The
newly considered Carlsbad desalination plant capacity 50 MGD / 190,000 m3/day is
planning to use SWRO membrane technology. A much larger membrane desalination
facility was commissioned in May 2005 in Israel, the Ashkelon SWRO, with a capacity of 44
Desalination, Trends and Technologies
122
MGD / 166,000 m3/day, which was expanded to 88 MGD / 330,000 m3/day at the end of
2005.
When different technologies were evaluated for these large desalination facilities, SWRO
provided the most cost-effective solution for all considerations: capital expenditures, O&M,
and cost per 1,000 gallons of treated water based on 20 – 30 years of operation.
As positive results, such as cost-effectiveness, emerge from large SWRO facilities in
operation, they will provide more security and confidence in building SWRO plants with
larger capacities.
2. Membrane technologies
Membranes are becoming a common commodity in water treatment, with four major
membrane categories that depend on the membrane pore sizes in commercial use at the
present time:
• Microfiltration (MF) - screens particles from 0.1 to 0.5 microns
• Ultrafiltration (UF) - screens particles from 0.005 to 0.05 microns
• Nanofiltration (NF) - screens particles from 0.0005 to 0.001 microns
• Reverse Osmosis (RO) - ranging molecular size down to 10 MWCO
The appropriate membrane treatment process for the removal of different constituents from
water can be traced in the chart below. All four membrane categories are commonly used in
water treatment to achieve the goals of Drinking Water Guidelines and Standards, as well as
LOW PRESSURE
HIGH PRESSURE
Fig. 4. Water Treatment Spectrum
Seawater Desalination: Trends and Technologies
123
to produce desalted and/or Ultra Pure Water (UPW) for different industrial and other
needs, such as power plants make-up water, electronic ships manufacturing, food industry,
pharmaceutical, medical, and others.
Water impurities depending on size and hydraulic properties:
• Suspended Solids (expressed as TSS, TVSS, Turbidity)
• Colloids (expressed as SDI)
• Dissolved Solids (expressed as TDS, TVDS)
Nature of water impurities:
• Mineral nature (non organic)
• Organic nature
Membrane Shape Type:
• Spiral Wound
• Hollow Fiber
• Flat Sheet
Membrane Type depending on driven pressure:
• Pressure Driven (MF, UF, NF and RO)
• Immersed, Vacuum Driven (MF only)
The first commercial use of membrane technology was desalination by RO, the process
known decades ago and commercialized in the early 1960s.
3. Energy recovery
Implementation of efficient Energy Recovery Turbines (ERT) into the RO desalination
technologies boosted growth of RO plants worldwide. There are three major types of ERT:
• Pelton Wheel
• Francis type
• Reversal pump
Recent developments in RO energy conservation brought the following technologies into the
market:
• Double Work Exchanger Energy Recovery DWEER
• Hydraulic turbo-charger
• Pressure/Work Exchanger and others
From the ERT, the most popular and reliable was the first type, Pelton Wheel ERT, which
can save up to 30% and higher of the energy consumed by high pressure RO pumps,
represents the highest O&M expenditure for RO plant operation. Of the latest
developments, DWEER and other systems can save up to 90-95% of the brine energy. For
example, for high salinity water with the RO recovery of 40%, the overall energy savings can
be as high as 50% or more of the energy for the entire plant operation.
4. Desalination statistics
Table 1 provides more detailed information and figures on the global production of
desalinated water, by process and plant capacity.
Desalination, Trends and Technologies
124
Desalting process Percentage
Capacity
(×10
6
m
3
/day)
Capacity
(10
6
gal/day)
No. of plants
Unit capacity
100-60 000 m
3
/day
Multistage flash 44.4 10.02 2,204 1,244
Reverse osmosis 39.1 8.83 1,943 7,851
Multiple effect 4.1 0.92 202 682
Electrodialysis
Reversal
5.6 1.27 279 1,470
Vapor compression 4.3 0.97 213 903
Membrane softening 2.0 0.45 99 101
Hybrid 0.2 0.05 11 62
Others 0.3 0.06 13 120
100.0 22.57 4,965
12,433
Unit capacity
500-60 000 m
3/
day
Multistage flash 46.8 10.00 2,200 1,033
Reverse osmosis 37.9 8.10 1,782 3,835
Multiple effect 3.8 0.81 178 653
Electrodialysis
Reversal
4.7 1.00 220 230
Vapor compression 4.2 0.90 198 486
Membrane softening 2.1 0.45 99 64
Hybrid 0.2 0.04 9 27
Others 0.23 0.05 11 11
EDI 0.05 0.01 2 97
100.0 21.36 4,699 6,436
Unit capacity
4000-60 000 m
3
/day
1
Multistage flash 64.0 9.27 2,039 496
Reverse osmosis 25.7 3.72 818 613
Multiple effect 3.6 0.52 114 48
Electrodialysis
Reversal
2.1 0.31 68 60
Vapor compression 1.9 0.28 62 42
Membrane softening 2 0.36 79 50
Hybrid 0 0.02 4 2
Others 0 0.00 0 0
100.0 14.48 3,186
1,311
Table 1. Summary of worldwide desalination capacity to 1998, split by plant type and
process capacity range. Source: 1998 IDA Worldwide Desalting Plants. Inventory Report
No. 15. Wangnick Consulting GmbH.
Seawater Desalination: Trends and Technologies
125
Today, the desalination capacity of membranes using RO reaches close to 3,500,000 MGD /
14 000 000 000 m3/day total capacity, which is half of the entire desalination capacity
worldwide. Membrane desalination is the fastest growing technology, and is expected to
become the prevalent desalination technology for the 21
st
century.
Microfiltration and ultrafiltration technologies became commercial in the late 1980s -1990s.
The major issues in membrane developments are:
• Increase membrane flux
• Decrease trans-membrane pressure
• Increase particles and salt rejection
• Extend membrane lifetime
• Improve operational process including back-wash technique and CIP cleaning
To address these issues, improve membrane performance, and bring membrane applications
to a new level, the following membrane characteristics and parameters are subjects for
current and future research and development:
• Improving pore shape, uniformity, and distribution
• Upgrading hydrophilic properties
• Increasing overall porosivity or pore density of membranes
• Developing more sophisticated and cost-effective membrane materials
• Improving the membrane manufacturing process
During the past 10 to 20 years, the availability, efficiency, and reliability of membrane
systems have increased significantly, while the capital and operational costs of these
Worldwide Membrane Facilities
0
1000
2000
3000
4000
5000
6000
1970 1980 1990 2000
Year
Number of Membrane Plants
Fig. 5. Worldwide Membrane Facilities (not including Desalination)
Desalination, Trends and Technologies
126
systems have dropped considerably. These developments have resulted in worldwide
exponential growth of membrane treatment plants. The latest AMTA information on the
number of membrane plants worldwide (not including desalination systems) is provided in
the following chart.
As a result of the growing membrane industry, membrane prices have trended lower during
the last decade. Some membrane manufacturers supply membranes to membrane system
integrators, while some suppliers also act as membrane integrators as well. When
manufacturers are deciding whether or not to be system integrators, they evaluate many
criteria, including competition with the professional system integrator companies. Since
high pressure membranes such as RO and NF are no longer on the market, most of the
RO/NF membrane manufacturers do not act as system integrators. Moreover, the industry
has reached a consensus on the standard sizes for RO and NF membranes. The most widely
used RO/NF elements are 2.5”, 4” and 8” in diameter and 40” and 60” long. Currently, RO
elements are sized 16”, 17.5”, 18 and 18.5” diameter in the commercialization process to
increase the amount of active membrane area provided by each element.
The low pressure MF/UF membranes are a relatively new technology, and no industrial
standard has yet been currently established. As the low pressure market grows, the low
pressure membranes will likely develop their own across-the-industry standard in order to
optimize MF/UF plant designs and reduce project costs. As a result of the current situation,
most of the MF/UF membrane manufacturers are also acting as system integrators.
When comparing open sea intakes to beach wells, the latter have preference:
• Less turbidity and solids in the feed and less pre-treatment is required
• Less chemical consumption by pretreatment
• Less seasonal and daily fluctuation of water quality and temperature, which allows
better and more reliable facility operation
For large SWROs, the well intakes are rarely considered as a water source, and open intakes
are the most appropriate solution. When an open intake is considered, the most common
pre-treatment may include a clarifier followed by media filters, two-stage media filters in
series, or other pre-treatment based on the feed water quality, local project conditions, and
project economics. As described above, conventional technologies can provide sufficient
pre-treatment when they are very sensitive to the water parameter fluctuations.
The best prototype may be low pressure MF/UF membrane pre-treatment, which provides
an absolute barrier to the particles regardless of the system load, operational conditions, or
the fluctuations and changes. The integrated membrane systems containing pre-treatment
by microfiltration or ultrafiltration have been successfully piloted around the world and
have found a significant number of applications in different industries. Some
small municipal plants are currently designed with membrane pre-treatment, and it is
believed that in the near future, more and larger municipal SWROs will be designed and
built with membrane pretreatment based on microfiltration and/or ultrafiltration
membranes.
5. SWRO design considerations
Figure 6 below can be a guide on the major criteria to be considered when designing
SWROs:
Seawater Desalination: Trends and Technologies
127
Brine Disposal
COST
Capital
O&M
Pre-Treatment:
-Filtration
-Chemicals
Post
Treatment
SWRO
M
M
a
a
j
j
o
o
r
r
c
c
o
o
n
n
s
s
i
i
d
d
e
e
r
r
a
a
t
t
i
i
o
o
n
n
s
s
f
f
o
o
r
r
S
S
W
W
R
R
O
O
d
d
e
e
s
s
i
i
g
g
n
n
Fig. 6. Major considerations for SWRO design. The larger the SWRO, the lower the water
cost and visa versa. For those who are considering SWRO, the tables below show
comparable numbers for facilities of different sizes.
Parameter Metric US
Capacity 20,000 m3/day 5.3 MGD
CAPITAL TOTAL $ 20 M $ 20 M
Capital cost for 20 yrs at 6% $ 0.27 /m3 $ 1.02 / 1000 gal
Energy cost at 4 KW-H/m3,
$ 0.06 /KW-H
$ 0.24 /m3 $ 0.91 / 1000 gal
Chemicals + Labor $ 0.21 /m3 $ 0.79 / 1000 gal
TOTAL WATER COST $ 0.72 /m3 $ 2.73 / 1000 gal
Table 2. Typical SWRO – 5 MGD (based on Eilat SWRO) (TDS = 52,000 ppm)
Parameter Value US
Capacity 95,000 m3/day (135,000
m3/day)
25 MGD (35 MGD)
CAPITAL TOTAL
(construction 20 months)
$ 110 M $ 110 M
Capital cost for 20 yrs at 6% $ 0.32 /m3 $ 1.21 / 1000 gal
Energy cost at 2.96 KW-H/m3,
$ 0.04 /KW-H
$ 0.12 /m3 $ 0.45 / 1000 gal
Chemicals + Labor (12 people) $ 0.219 /m3 $ 0.83 / 1000 gal
TOTAL O&M COST (Fixed $
8.5M/yr for 30 yrs)
$ 0.659 /m3 $ 2.49 / 1000 gal
Table 3. The largest SWRO in the U.S., Tampa Bay SWRO (TDS = 26,000 ppm), 25 MGD,
expansion to 35 MGD
Desalination, Trends and Technologies
128
Parameter Metric US
Capacity
165,000 m3/day (330,000 m3/day) 44 MGD (88 MGD)
CAPITAL TOTAL $ 212 M $ 212 M
Capital cost for 20 yrs at 6% $ 0.17 /m3 $ 0.64 / 1000 gal
Energy cost at 4 KW-H/m3,
$ 0.06 /KW-H
$ 0.24 /m3 $ 0.91 / 1000 gal
Chemicals + Labor $ 0.117 /m3 $ 0.44 / 1000 gal
TOTAL WATER COST $ 0.527 /m3 $ 1.99 / 1000 gal
Table 4. Largest SWRO in the world– Ashkelon, Israel 44 MGD (expansion to 88 MGD by
2005)
6. Summary
Membranes are becoming a commodity in the desalination and in the water treatment field,
finding more applications and replacing traditional conventional technologies. Used in
combination with different technologies, membranes may address removal of mineral and
organic compounds in the water including volatile types such as endocrine disruptors
(EDCs) (42 found in the U.S.), pharmaceutically-active compounds (PhACs), and personal
care products (PCPs).
The major reasons membrane desalination is emerging as the dominant technology are:
• Absolute barrier for treatment/removal
• Product water is not affected by the feed water hydraulic and contaminant overloads,
spikes, and fluctuations
• Less or no chemicals required
• Smaller footprint/layout
• Single step process
• Modular expandability (for future expansions)
• Less volume of discharged wastes (including sludge and chemicals)
• Simplicity of operation, process automation
7. References
[1] California Department Health Service (DHS) Surface Water Treatment Staff Guidance
Manual, California, 1993.
[2] Frenkel, V., Gourgi, T. 1994. Water Treatment Systems: Bed Filtration and Desalination by
Reverse Osmosis (RO).
[3] Frenkel, V., Pankratz, T., 2004. Desalination Methods, Technology and Economics.
Desalination Conference, April 16, 2004, The Seminar Group, Santa Barbara,
California.
[4] “The Guidebook to Membrane Desalination Technology. Reverse Osmosis,
Nanofiltration and Hybrid Systems. Process, Design and Applications” by M. Wilf
with chapters by C. Bartels, L. Awerbuch, M. Mickley, G. Pearce and N. Voutchkov,
Balaban Desalination Publications, 2006.
[5] L. Stevens, J. Kowal, K. Herd, M. Wilf, W. Bates, Tampa Bay seawater desalination
facility: start to finish, Proceedings of IDA Water Desalination Conference,
Bahamas (2003).
7
Advanced Mechanical Vapor-Compression
Desalination System
Jorge R. Lara, Omorinsola Osunsan and Mark T. Holtzapple
Texas A&M University
United States
1. Introduction
Vapor compression is a reliable and robust desalination technology that is attractive because
of its capacity to treat large volumes of water with a wide range of salt concentrations.
However, compared to other major desalination technologies such as reverse osmosis,
mechanical vapor compression has had relatively high operating and capital costs. New
innovative developments in compressor and evaporator designs make it possible to reduce
energy consumption so it is a more competitive alternative. Texas A&M University has
developed an advanced vapor-compression desalination system that operates at high
temperatures. Advanced sheet-shell latent heat exchangers promote dropwise condensation
allowing small temperature and pressure differentials between the saturated boiling liquid
and the condensing steam, hence reducing the energy requirements. This newer system
consists of a train of non-scaling evaporators arranged so feed water flows countercurrently,
recovering heat from both the condensate stream and the concentrated discharge brine. A
high-efficiency gerotor compressor provides the compression work required to return
saturated steam to the initial stage of the evaporator train. An experimental investigation of
hydrophobic copper plates described below shows that extraordinarily high heat transfer
coefficients can be attained. The gerotor compressor is particularly advantageous for
applications where either electricity or mechanical energy is available.
Extensive studies in dropwise condensation show that for low temperature differentials
across the hydrophobic plate, heat transfer coefficients will increase with elevated steam
pressures. According to the data described in this study, dropwise condensation of
saturated steam and forced-convection boiling of saturated water separated by a thin
hydrophobic copper plate result in ultra-efficient heat transfer. The forced convection in the
water chamber is produced by a liquid jet ejector.
1.1 Advanced mechanical vapor-compression desalination system
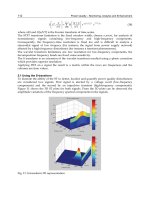
Figure 1 shows the advanced mechanical vapor-compression desalination system. In this
example, three evaporator stages are illustrated, but fewer or more could be employed
(Holtzapple et al., 2010). The left-most evaporator is at the lowest pressure and the right-
most evaporator is at the highest pressure. In the left-most evaporator, the vapor space
above the boiling water is connected to the compressor inlet. The work added to the
compressor causes the discharged steam to be superheated. The superheat is removed in the
desuperheater.
Desalination, Trends and Technologies
130
Fig. 1. Advanced mechanical vapor-compression desalination system.
Advanced Mechanical Vapor-Compression Desalination System
131
The saturated high-pressure steam that exits the desuperheater enters the condensing side
of the right-most evaporator. As this steam condenses, it evaporates water from the boiling
side thereby producing steam that can be fed to the middle evaporator. In the middle
evaporator, the steam condenses, which causes more steam to be produced on the boiling-
water side. This steam then enters the left-most evaporator where it condenses and
evaporates water from boiling side. The water evaporated from the boiling side enters the
compressor, as previously described.
The evaporators are operated at elevated temperature and pressure, which accomplishes the
following: (a) the physical size of the compressor is reduced, thereby reducing its cost and
(b) in the evaporators, high heat transfer coefficients are obtained.
The primary disadvantage of operating at elevated temperature is that it promotes scaling
on heat exchanger surfaces, primarily from salts with “reverse solubility,” i.e., those salts in
which the solubility decreases at elevated temperature. Examples of reverse solubility salts
are calcium carbonate, magnesium carbonate, calcium sulfate, and magnesium sulfate.
Commonly, to limit scaling, the maximum heat exchanger temperature is ~120
o
C; however,
at this temperature and pressure, the compressor is physically large and heat transfer
coefficients are poor. It is highly desirable to increase the operating temperature, which
requires methods to address scale formation such as the following: (a) remove carbonates
from the feed water by acidification and stripping the resulting carbon dioxide; (b) remove
sulfates via ion exchange; (c) promote salt nucleation in the bulk fluid rather than on
surfaces; (d) abrade heat exchanger surfaces with circulating “cleaning balls” commonly
made from rubber; and (e) apply non-stick coatings to heat exchanger surfaces.
In the evaporators, the steam-side heat transfer coefficient improves up to 30% by inducing
shearing steam on the condensing surface; the liquid-side heat transfer coefficient improves
with forced-convection boiling. This can be accomplished using an internal jet ejector
powered by a pump.
To preheat the feed to the evaporators, a sensible heat exchanger is employed, which
exchanges thermal energy between the incoming feed water and the discharged distilled
water and concentrated brine. As shown in Figure 1, the preheated feed water is fed to the
left-most evaporator. In a countercurrent series manner, the brine exiting the left-most
evaporator is directed to the middle evaporator and the brine exiting the middle evaporator
is directed to the right-most evaporator. As the brine flows from left to right, it becomes
ever more concentrated. In the left-most evaporator (lowest brine concentration), the
pressure ratio between the condensing steam and boiling water is minimal. In the right-most
evaporator (highest brine concentration), the pressure ratio between the condensing steam
and boiling water is maximal.
Because noncondensable gases are present in the feed water, it will be necessary to purge
them from the system. The purged gases exit with steam, which is sent to a heat exchanger
that preheats the incoming feed to the left-most evaporator.
1.2 Mass and energy balance
The steam-side energy balance (Lara, 2005) is
q = m
s
(H
s
– H
c
) = m
s
h
fg
(1)
where
q = rate of heat transfer (W)
Desalination, Trends and Technologies
132
m
s
= rate of steam flow (kg/s)
H
c
= specific enthalpy of condensate (J/kg)
H
s
= specific enthalpy of steam (J/kg)
h
fg
= latent heat of evaporation (J/kg)
The saltwater-side energy balance is:
q = m
v
H
v
– m
f
H
f
+ m
b
H
b
= (m
f
– m
b
) H
v
– m
f
H
f
+ m
b
H
b
(2)
where
m
f
= rate of saltwater feed flow (kg/s)
m
b
= rate of exiting brine flow (kg/s)
m
v
= m
f
– m
b
= rate of vapor flow to the next effect (kg/s)
H
v
= specific enthalpy of vapor going to the next effect (J/kg)
H
f
= specific enthalpy of saltwater feed (J/kg)
H
b
= specific enthalpy of exiting brine (J/kg)
Using the boiling temperature as a reference, the enthalpy H
f
can be calculated from the
specific heat of saltwater C
pf
(J/(kgּ°C))
H
f
= C
pf
(T
b
– T
f
) (3)
where
T
b
= temperature of brine exiting latent heat exchanger (°C)
T
f
= temperature of saltwater entering latent heat exchanger (°C)
At steady-state flow conditions in the evaporator, for seawater feed, the saltwater
concentration in the right-most evaporator has been set to 7%. Under these circumstances,
there is an appreciable boiling point elevation. The vapor leaving the evaporator solution is
superheated by about 1.5 °C, which corresponds to the boiling point elevation. Using the
boiling temperature as a reference (i.e., H
b
= 0), the specific enthalpy H
v
of the leaving vapor
equals the latent heat of vaporization plus the sensible superheat. However, the sensible
superheat is small so it is approximately true that H
v
is the latent heat of vaporization, which
is h
fg
. With this simplifying assumption, the steady-state evaporator energy balance derived
using Equations 1 to 3 becomes:
m
s
h
fg
= (m
f
– m
b
) h
fg
– m
f
C
pf
(T
b
– T
f
) + 0 (4)
1.3 Pressure drop in the heat exchanger
For two-phase flow inside horizontal tubes and channels (ASHRAE Fundamentals
Handbook, 2001), the pressure gradient is the sum of frictional and momentum terms
f
riction momentum
dP dP dP
dz dz dz
+
⎛⎞ ⎛⎞
=
⎜⎟ ⎜⎟
⎝⎠ ⎝⎠
(5)
Detailed analysis of the pressure drop in the hydrophobic heat exchanger was performed by
Lara (2005), and it was concluded that pressure drop in the sheet-shell heat exchanger is not
a major issue.
As described below, the advanced mechanical vapor-compression desalination system has
two key components: (1) hydrophobic heat exchanger, and (2) high-efficiency compressor.
Advanced Mechanical Vapor-Compression Desalination System
133
2. Hydrophobic heat exchanger
An extensive experimental investigation on hydrophobic heat exchangers was performed
(Lara & Holtzapple, 2010). The study shows dropwise condensation on the condensing
surface and forced-convective boiling on the boiling surface make a very efficient heat
transfer mechanism that delivers heat transfer coefficients of the order of 277 kW/(m
2
ּ
°
C)
for 0.2-mm-thick vertical copper plates coated with 2.54-µm-thick hydrophobic Ni-P-PTFE
coating for steam at 827 kPa. The extraordinarily high heat transfer coefficient requires small
pressure differentials between the condensing and the boiling chambers, hence the
compression energy requirement of the system is small. Hydrophobic heat exchangers
perform best at high pressure (Rose, 2002); therefore, the compressor must operate at high
pressures and small compression ratios. The mechanical vapor-compression system
described in this study uses an innovative gerotor compressor, which is now commercially
available from StarRotor Corporation (Murphey et al., 2010).
During the experimental investigation, heat transfer coefficients were measured in vertical
heat exchangers. Two different square, thin-sheet plate designs were tested. One had round-
dimpled spacers, and the other had round-shaped vertical-grooved spacers. In both cases,
the experimental plates were mounted in a sealed two-chamber apparatus with condensing
saturated steam on one side and boiling liquid water on the other (Figure 2).
The liquid-side heat transfer mechanism employed either natural or forced convection pool
boiling of saturated water. The steam-side heat transfer mechanism was condensing
saturated steam with either filmwise or dropwise condensation.
2.1 Apparatus and procedure
The experimental apparatus is tailored to observe and manipulate key heat transfer
variables. The apparatus (Figure 2) consists of two sections: (1) a boiling water chamber and
(2) a condensing steam chamber. Both chambers are made of stainless steel 304 and are
divided by the test plate. The whole assembly is bolted together. To prevent leakage, a
gasket is placed between each side of the test plate and frame. Data were collected only
after steady state was achieved.
High-pressure steam enters valve V1 into cyclone C1 where liquid is separated, thus
ensuring the steam quality entering the apparatus is 1.0. Pressure regulator V2 sets the
condenser pressure, which is measured by pressure gauge P. The steam enters the
condenser, which has a 3.2-mm gap that is set by the thickness of the aluminum plate
inserted into the condenser. At the bottom of the condenser, condensate flows into sight
glass S2. By manually opening valve V4, the liquid level in sight glass S2 can be maintained
constant. The drained liquid is collected in graduated cylinder G1 and is measured over a
90-s interval. (Note: This manual method of collecting condensate was more reproducible
than steam traps.)
The rate of shearing steam flowing past the plate is regulated by valve V3. Cyclone C2
separates liquid entrained with the shearing steam. The collected liquid enters sight glass S3;
by manually opening valve V5, the liquid level in sight glass S3 is kept constant. The
drained liquid collected in graduated cylinder G2 is measured over a 90-s interval.
The steam exiting cyclone C2 enters heat exchanger HX2 where it condenses and is collected in
graduated cylinder G3 over a 90-s interval. The amount of liquid collected in graduated
cylinder G3 is compared to the amount of liquid collected in both graduated cylinders G1 and
G2 so that the ratio R of each flow can be measured. Knowing the gap g (3.2 mm), the plate
depth, and the steam density allows the velocity of the shearing steam v to be measured.
Desalination, Trends and Technologies
134
Fig. 2. Schematic of experimental apparatus (Lara & Holtzapple, 2010).
Advanced Mechanical Vapor-Compression Desalination System
135
The boiling side is flooded with tap water; sight glass S1 ensures the liquid level is kept
constant. If necessary, excess liquid can be drained or make up water added by manually
opening three-way valve V6. The steam evaporated from the boiler enters heat exchanger HX1
where it condenses. The condensate is heated to saturation using electric resistance heater E1.
If necessary, make-up steam can be added to the boiler by opening valves V7 and V8.
To induce forced convection in the boiler, a pump circulates the liquid. An all-metal flow
meter measures the rate of circulating liquid. Knowing the gap f and the plate dimensions,
the liquid velocity can be calculated.
To ensure that noncondensable gases are removed from the system, valves V9 and V10
allow a small stream to be purged to the atmosphere.
The temperature differential ΔT between the steam side and the liquid side is set by the
amount of cooling water flowing through the heat exchanger HX1, the amount of make-up
steam added through valves V7 and V8, and the heat added through resistance heater E1.
The differential pressure between the two chambers is measured using differential pressure
gauges DP1 and DP2. One operates from 0 to 2 psid (0 to 13,800 Pa) and the other operates
from 0 to 10 psid (0 to 69,000 Pa). The measured pressure differential ΔP between chambers
and the steam pressure P allows ΔT to be determined using steam tables. Four thermocouples
measure the temperatures in each quadrant of the condenser. Similarly, four thermocouples T5
to T8 measure the temperatures in each quadrant of the boiler. Because thermocouples are not
particularly accurate, they were not used to measure ΔT across the test plate. Instead, their
purpose was to ensure uniform temperatures in each quadrant of the boiler and of the
condenser. Using steam tables, the thermocouple readings were found to be consistent with
the readings taken by the pressure gauge P and differential pressure gauges DP1 and DP2.
Thermal losses from insulation are calculated by opening valves V7 and V8, which equalizes
the pressures in both chambers with saturated steam so there is no temperature difference
across the plate. The condensate is collected and used to determine the heat loss through the
steam-side insulation. This collected steady-state condensate serves as the baseline, which is
subtracted from the condensate collected in both graduated cylinders G1 and G2 during the
experiments; the net condensate collected (m) is substituted in Equation 8 to calculate heat
flux. This allows the heat transfer through the plate to be measured without interference
from heat loss through the insulation.
Three different plate materials were tested: (1) 0.762-mm-thick naval brass 464 (2) 0.2-mm-
thick copper, and (3) 0.127-mm-thick titanium grade 2.
2.2 Calculation of heat transfer coefficient
Neglecting fouling, the theoretical overall heat transfer coefficient can be calculated using
1
11
cond boiling
U
x
hh k
=
⎛⎞
++
⎜⎟
⎝⎠
(6)
where
U = overall heat transfer coefficient (kW/(m
2
ּ°C))
x = plate thickness (m)
k = thermal conductivity (kW/(mּ°C))
h
cond
= condensation heat transfer coefficient (kW/(m
2
ּ°C))
h
boiling
= boiling heat transfer coefficient (kW/(m
2
ּ°C))
Desalination, Trends and Technologies
136
Measured heat transfer coefficients U are obtained from
q
U
T
⎛⎞
⎜⎟
=
⎜⎟
Δ
⎝⎠
(7)
and
q = (mh
fg
)/A (8)
where
q = heat flux (kW/m
2
)
m = net condensate collected from the apparatus (kg/s)
h
fg
= latent heat of condensation (kJ/kg)
A = effective heat transfer area (m
2
)
ΔT = temperature differential across the plate (°C)
Dropwise condensation performs best at higher pressures and small temperature
differentials across the plate (Rose, 2002). Moreover, high operating pressures increase
steam density which allows mechanical vapor-compression (MVC) desalination systems to
use smaller compressors.
2.3 Heat transfer enhancement techniques
Active and passive heat transfer enhancement techniques for heat exchangers have been
investigated intensively (Bergles, 2002). Fourth-generation heat transfer technology involves
simultaneous application of several techniques to produce an enhancement larger than the
individual techniques operating separately. Dropwise condensation has been studied for the
past 60 years (Rose, 2002). Experiments with brass tubes show dropwise condensation has
heat transfer coefficients 1.6–28.6 times greater than filmwise condensation (Ma et al., 2002).
The experiments reported herein enhanced heat transfer by simultaneously employing the
following: (1) passive electroless Ni-P-PTFE thin-hydrophobic coating to promote dropwise
condensation on the steam side and to inhibit fouling in the boiling side, (2) active forced
convection circulating saturated liquid in the boiling chamber, and (3) active shearing steam
on the condensing surface. This study measures the heat transfer with forced-convective
boiling (liquid side) and dropwise condensation (steam side). The following factors were
investigated: (a) saturated steam temperature; (b) temperature differential ΔT across the
plate; (c) shearing steam; (d) shearing liquid.
2.4 Summary of experimental results
The first plate was round-dimpled 0.762-mm-thick naval brass (k = 116 W/(mּ°C)), which
was roughened via sand-blasting on the liquid side to promote nucleation. The condensing
metal surface was either bare (filmwise condensation) or coated with 0.635-µm-thick layer of
Ni-P-PTFE (dropwise condensation).
Shearing steam on the condensing surface enhanced the overall heat transfer coefficient by 1.6
times and forced liquid convection increased it by additional 1.4 times. Interestingly, excessive
shearing steam reduced the overall heat transfer coefficient. Presumably, this occurred because
a film formed that increased the thermal resistance across the plate and disrupted the
dropwise condensation mode. Without coating, the best operating point delivered U = 16.5
kW/(m
2
·°C) (saturated steam T = 166 °C, P = 722 kPa, ΔT = 0.2 °C). With 0.635-µm Ni-P-PTFE
Advanced Mechanical Vapor-Compression Desalination System
137
hydrophobic coating, the best operating point delivered an overall heat transfer coefficient U =
99.4 kW/(m
2
·°C) (saturated steam T = 166 °C, P = 722 kPa, ΔT = 0.2 °C, shearing steam v = 0.16
m/s, R ≈ 1 kg shearing steam/kg condensate, saturated liquid side v = 1.57 m/s).
The second plate was round-dimpled 0.2-mm-thick copper (k = 400 W/(mּ°C)). The plate
surfaces in both chambers were modified with 0.635-µm Ni-P-PTFE hydrophobic layer.
Experiments on this plate were performed under two different conditions in the saturated
liquid chamber: (1) forced convection and (2) forced convection with PTFE boiling stones as
a dynamic nucleation agent. For the first condition, the best operating point delivered an
overall heat transfer coefficient U = 159 kW/(m
2
·°C) (saturated steam T = 166 °C, P = 722
kPa, ΔT = 0.2 °C, shearing steam v = 0.4 m/s, R ≈ 1 kg shearing steam/kg condensate,
saturated liquid side v = 1.57 ft/s). For the second condition, the best operating point
delivered an overall heat transfer coefficient U = 182 kW/(m
2
·°C) (saturated steam T = 166
°C, P = 722 kPa, ΔT = 0.2 °C, steam velocity v = 0.49 m/s, R ≈ 1 kg shearing steam/kg
condensate, saturated liquid velocity v = 1.57 m/s).
The third round-dimpled plate was made of grade-2 bare 0.12-mm-thick titanium (k = 21.9
W/(mּ°C)). The best design point delivered U = 77.8 kW/(m
2
ּ°C) (saturated steam T = 166
°C, P = 722 kPa, ΔT = 0.2 °C, steam velocity v = 0.15 m/s, R = 1.5 kg shearing steam/kg,
saturated liquid velocity v = 1.57 m/s).
The fourth plate was vertical-grooved 0.2-mm-thick copper (k = 400 W/(mּ°C)) coated with
0.635-µm Ni-P-PTFE hydrophobic coating. The best design point delivered U = 192
kW/(m
2
ּ°C) (saturated steam T = 166 °C, P = 722 kPa, ΔT = 0.2 °C, steam velocity v = 0.16
m/s, R ≈ 0.43 kg shearing steam/kg condensate, saturated liquid velocity v = 1.57 m/s). The
last experiment was performed on the copper plate previously described but with a
modified chemistry for the coating. Lead-free 2.5-µm-thick hydrophobic Ni-P-PTFE
delivered 21% better heat transfer coefficient. For this case, the best design point was U =
240 kW/(m
2
ּ°C) (saturated steam T = 166°C, P = 722 kPa, ΔT = 0.2 °C, steam velocity v =
0.23 m/s, R ≈ 0.6 kg shearing steam/kg condensate, saturated liquid velocity v = 1.57 m/s).
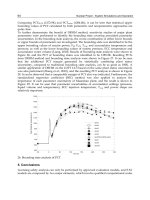
2.5 Experimental results of vertical groove plates
Figure 3 shows the overall heat transfer coefficients corresponding to different temperature
differences across the vertical groove plate at different constant saturated steam pressures
(Lara & Holtzapple, 2010). Forced convection is imposed in the saturated liquid side with
v
sat liq
= 1.57 m/s. Optimal shearing steam ratio (R) (Figure 4) was employed.
The following empirical equations describe each of the curves shown in Figure 3:
U = 61.1(ΔT)
–0.9153
(P = 722 kPa) (9)
U = 39.8(ΔT)
–0.8214
(P = 653 kPa) (10)
U = 25.9(ΔT)
–0.7715
(P = 446 kPa) (11)
Equations 9 to 11 can be used to calculate the heat flux:
q = U ΔT = 61.1(ΔT)
1–0.9153
= 61.1(ΔT)
0.0847
(P = 722 kPa) (12)
q = U ΔT 39.8(ΔT)
1–0.8214
= 39.8(ΔT)
0.1786
(P =653 kPa) (13)
q = U ΔT = 25.9(ΔT)
1–0.7715
= 25.9(ΔT)
0.2285
(P = 446 kPa) (14)
Figure 5 presents this information graphically.
Desalination, Trends and Technologies
138
Fig. 3. Overall heat transfer coefficients corresponding to different
.T
Δ
Copper 0.2-mm-
thick plate with round-shaped vertical grooves and fully coated with 2.54-µm-thick lead-free
Ni-P-PTFE hydrophobic coating. Forced-convection saturated pool boiling (v
sat liq
= 1.57
m/s). Optimal shearing steam on the condensing surface (see Figure 4). Condensing steam
at different pressures. (Lara & Holtzapple, 2010)
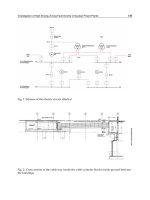
Fig. 4. Optimal shearing steam ratio R corresponding to saturated steam pressure P and
temperature differential across the test plate ΔT. Experiments conducted on 0.20-mm-thick
copper plate with round-shaped vertical grooves and fully coated with 2.54-µm-thick lead-
free Ni-P-PTFE hydrophobic coating. Forced convection in the saturated pool boiling side
(v
sat liq
= 1.57 m/s). (Lara & Holtzapple, 2010)