Báo cáo hóa học: " Detection of virus mRNA within infected host cells using an isothermal nucleic acid amplification assay: marine cyanophage gene expression within Synechococcus sp" doc
Bạn đang xem bản rút gọn của tài liệu. Xem và tải ngay bản đầy đủ của tài liệu tại đây (367.1 KB, 8 trang )
BioMed Central
Page 1 of 8
(page number not for citation purposes)
Virology Journal
Open Access
Research
Detection of virus mRNA within infected host cells using an
isothermal nucleic acid amplification assay: marine cyanophage
gene expression within Synechococcus sp
Susan D Wharam
1,2,3
, Matthew J Hall
3
and William H Wilson*
1,3,4
Address:
1
Bigelow Laboratory for Ocean Sciences, 180 McKown Point, West Boothbay Harbor, Maine 04575, USA,
2
Cytocell Ltd., Banbury Business
Park, Adderbury, OX17 3SN, UK,
3
Marine Biological Association, Citadel Hill, Plymouth, PL1 2PB, UK and
4
Plymouth Marine Laboratory,
Prospect Place, The Hoe, Plymouth, PL1 3DH, UK
Email: Susan D Wharam - ; Matthew J Hall - ; William H Wilson* -
* Corresponding author
Abstract
Background: Signal-Mediated Amplification of RNA Technology (SMART) is an isothermal nucleic
acid amplification technology, developed for the detection of specific target sequences, either RNA
(for expression) or DNA. Cyanophages are viruses that infect cyanobacteria. Marine cyanophages
are ubiquitous in the surface layers of the ocean where they infect members of the globally
important genus Synechococcus.
Results: Here we report that the SMART assay allowed us to differentiate between infected and
non-infected host cultures. Expression of the cyanophage strain S-PM2 portal vertex gene (g20)
was detected from infected host Synechococcus sp. WH7803 cells. Using the SMART assay, we
demonstrated that g20 mRNA peaked 240 – 360 minutes post-infection, allowing us to characterise
this as a mid to late transcript. g20 DNA was also detected, peaking 10 hours post-infection,
coinciding with the onset of host lysis.
Conclusion: The SMART assay is based on isothermal nucleic acid amplification, allowing the
detection of specific sequences of DNA or RNA. It was shown to be suitable for differentiating
between virus-infected and non-infected host cultures and for the detection of virus gene
expression: the first reported use of this technology for such applications.
Background
The Signal-Mediated Amplification of RNA Technology
(SMART, developed by Cytocell Ltd., Banbury, UK), also
referred to as CytAMP
®
(British BioCell International, Car-
diff, UK) was originally developed for the medical diag-
nostics industry [1]. Public Health Laboratory trials have
compared CytAMP
®
with more conventional methods for
the specific detection of MRSA (methicillin-resistant Sta-
phylococcus aureus) [2]. A review, outlining guidelines for
the laboratory diagnosis and susceptibility testing of
MRSA, reported that the sensitivity and specificity of
CytAMP
®
was comparable to those of PCR for this purpose
[3].
The SMART assay, summarised in figure 1, has been
described in detail elsewhere [1,4]. Briefly, the assay uses
two oligonucleotide probes which hybridise specifically
to the target, at adjacent sites, and also to each other to
Published: 6 June 2007
Virology Journal 2007, 4:52 doi:10.1186/1743-422X-4-52
Received: 15 March 2007
Accepted: 6 June 2007
This article is available from: />© 2007 Wharam et al; licensee BioMed Central Ltd.
This is an Open Access article distributed under the terms of the Creative Commons Attribution License ( />),
which permits unrestricted use, distribution, and reproduction in any medium, provided the original work is properly cited.
Virology Journal 2007, 4:52 />Page 2 of 8
(page number not for citation purposes)
form a "T" structure known as a three-way junction (3WJ)
(Fig. 1a). The efficiency of 3WJ formation is greatly
enhanced by the use of facilitator probes that anneal to
the target adjacent to the 3WJ. Only when specific target
nucleic acid is present, a T7 RNA polymerase promoter
sequence within the 3WJ structure becomes double
stranded, and hence activated. T7 RNA polymerase then
produces large amounts of an RNA transcript. This RNA is
the assay signal and it can be further amplified by the
same process if required, and detected by an enzyme-
linked oligosorbant assay (ELOSA) (Fig. 1b). Amplifica-
tion and signal detection processes have been fully
described and explained previously [1,4].
Here, we report the first application of this isothermal
nucleic acid amplification assay for the detection of viral
DNA and RNA within infected host cells. This is also the
first report of the assay being used to detect gene expres-
sion.
The viruses chosen for this study were cyanophages. These
are viruses that infect cyanobacteria, which are globally
important photosynthetic microorganisms. Cyanophages
have a wide spectrum of host ranges, are ubiquitous and
can be easily isolated from a range of aquatic environ-
ments [5]. Marine cyanophages are extremely numerous
in surface seawater [6-9]. Their hosts, Synechococcus spp.,
are marine cyanobacteria, which also have a widespread
distribution throughout the world's oceans and are
thought to contribute up to 25% of primary productivity
in the open ocean [10]. There is great interest in marine
cyanophages, as they are key components of microbial
communities and influence host populations [11] and
biogeochemical cycling [12-14], as well as primary pro-
ductivity.
Much of the emphasis of research on marine cyanophages
has focussed on the dynamics (or propagation strategy)
between phage and host in situ and on determining their
genetic diversities [15-20]. Until recently, very little had
been reported about marine cyanophage gene expression,
gene function or phage assembly apart from what could
be deduced from sequence information [21-25]. How-
ever, following the discovery of photosynthetic genes in
marine cyanophages [26-28], studies on their expression
using microarrays [29] and quantitative real-time PCR
[30], were used to help determine functionality (see
review by Clokie et al [31]).
Cyanophage strain S-PM2 was originally isolated by
plaque assay from coastal water off Plymouth, UK and
belongs to the family Myoviridae, a group of double-
stranded DNA phages with contractile tails. S-PM2 has
been classified into a sub-group of phages termed the 'exo
T-evens' based on a phylogenetic analysis of the structural
components, encoded on a 10 kb module, from a range of
T-even phages, [22]. One of these structural components
is the portal vertex protein (gp20). The g20 gene was orig-
inally identified in cyanophages in order to develop a
PCR-based assay to analyze natural cyanophage popula-
tions [21].
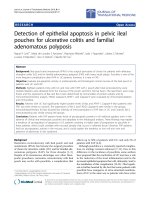
The SMART assayFigure 1
The SMART assay. (a) Specific probes hybridise with the tar-
get to form a three-way junction (3WJ), assisted by facilitator
probes (f1 & f2). The 3WJ initially contains a single-stranded,
inactive T7 RNA polymerase promoter sequence. The pro-
moter is made double stranded (active) by extension (by Bst
DNA polymerase) off the 3' of the extension probe, leading
to the generation of large amounts of RNA signal (by T7
RNA polymerase), which may itself be amplified if required.
(b) Detection of RNA signal by ELOSA (Enzyme Linked Oli-
goSorbant Assay). The assay uses 2 specific probes: a bioti-
nylated capture probe and enzyme (Alkaline phosphatase,
AP) linked detection probe. Non-specific nucleic acid and
3WJ probes are removed, following binding in a streptavidin
coated well, and RNA signal is detected via a colour change.
Quantification of signal takes place in a 96 well plate, allowing
multiple samples to be analysed simultaneously.
template probe
T7 RNA Pol Promoter
(single stranded)
target
extension probe 3’OH
transcription
template
Three-way junction
f2f1
T7 RNA Pol Promoter
(double stranded)
Bst DNA Pol
& T7 RNA Pol
RNA signal
a
Test results
substrate
streptavidin coated well
biotinylated
capture oligo
AP
probe
RNA
RNA capture
b
Test results
substrate
streptavidin coated well
biotinylated
capture oligo
AP
probe
RNA
RNA capture
b
Virology Journal 2007, 4:52 />Page 3 of 8
(page number not for citation purposes)
Sequence analysis of g20 in S-PM2 revealed significant
similarity to g20 from the enteric coliphage T4, therefore
it is likely that the function of gp20 in S-PM2 is similar to
that in T4 where it is involved in head assembly. T4 head
assembly takes place in several phases and is reviewed
extensively in Black et al. [32]. Briefly, a prohead is assem-
bled, starting from a membrane-bound initiation com-
plex, the prohead then undergoes proteolysis and is
detached from the membrane. The head is then packaged
with DNA and final maturation steps occur. At the mem-
brane attachment (proximal) vertex of the prohead shell,
there is a dodecameric ring of gp20 protein, termed con-
nector or portal protein. Formation of this structure is
essential, and is thought to be the rate-limiting step in T4
prohead initiation. The prohead portal proteins do not
undergo proteolysis (as opposed to other prohead pro-
teins which do) and they form the site at which the tail is
attached and through which DNA will eventually pass.
The g20 gene is now widely used as a marker to study the
diversity and population dynamics of both marine and
freshwater cyanophage [19,20,33-38]. Despite such wide
scale exploitation of the g20 gene sequence, there have
been no previous studies on cyanophage g20 gene expres-
sion.
Sequence information from cyanophage g20 was used to
develop a set of probes designed for use in the SMART iso-
thermal nucleic acid amplification technology. We have
previously reported that the assay discriminated between
similar g20 target DNA sequences from two different
marine cyanophage strains [4]. Earlier trials also showed
the assay, as well as detecting DNA targets, could generate
signals from specific RNA (using E. coli as a model target
organism and a high copy number ribosomal RNA as the
target sequence) [1]. The assay conditions are identical,
regardless of whether an RNA or DNA target is to be
detected.
Here we report that we can detect cyanophage strain S-
PM2 g20 mRNA from infected Synechococcus sp. WH7803
using a technology based on isothermal nucleic acid
amplification. In addition, the SMART assay was used to
monitor g20 expression and the subsequent increase in
cyanophage DNA in the infected culture. This is the first
use of the assay in looking at gene expression, and in
detecting viral nucleic acid in an infected host. It is also
the first study looking at cyanophage g20 gene expression.
Results and discussion
Detection of S-PM2 g20 mRNA from infected host cells
Different sets of SMART probes were designed to detect
the coding and non-coding strands of DNA in the S-PM2
g20 target, (Table 1). Probes for the coding strand could
generate signal from both DNA and RNA, those for the
non-coding strand from DNA only.
A preliminary experiment was performed to determine
whether SMART could detect viral RNA from an infected
culture. In order to detect S-PM2 g20 mRNA from infected
host cells, RNA and DNA were extracted from infected
Synechococcus sp. WH7803 approximately 24 hours prior
to lysis, when viral RNA was predicted to be detectable.
Nucleic acid was also extracted from an uninfected cul-
ture, for use in controls.
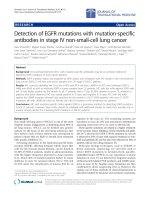
Probes designed against the coding strand (to detect DNA
+ RNA) of g20 generated a SMART assay signal from both
DNA and RNA extracted from infected host cells from
flask 2 (24 hours prior to culture lysis) (Fig. 2a). Low,
Table 1: Oligonucleotide probe sequences used in this study.
Cyanophage target
S-PM2 g20 coding strand S-PM2 g20 non-coding strand
Extension probe TGACCATCGTAAACAAGCTT
GTTTCTGTATTCGAAAT
AACAATACTTGCGTGATGTAAT
GTCACGTTTTCGAAAT
Template probe TCGTCTTCCGGTCTCTCCTCT
CAAGCCTCAGCGCTCTCTCTC
CCTATAGTGAGTCGTATTAATT
TCGAAhACGTGACATTACATCA
CGCAAGTATTGTTx
TCGTCTTCCGGTCTCTCCTCTCA
AGCCTCAGCGCTCTCTCTCCCT
ATAGTGAGTCGTATTAATTTCGA
AhACAGAAACAAGCTTGTTTACG
ATGGTCAAx
Facilitator 1 TGCTTTTTATCATCACGAATC
TCTCCTGTTx
ATGTTGGTAATCTACCAAAGGTA
AAGGCAGx
Facilitator 2 CTGCCTTTACCTTTGGTAGA
TTACCAACAx
ACAGGAGAGATTCGTGATGATAA
AAAGCATx
All sequences are written (5' → 3').
S-PM2 GenBank accession number AF016384
.
h Indicates position of hexaethylene glycol linker molecule.
x Indicates position of phosphorylation to prevent extension.
Oligonucleotides used for further amplification and detection of the RNA signal are described in Hall et al. [4].
Virology Journal 2007, 4:52 />Page 4 of 8
(page number not for citation purposes)
background signals were produced from flask 3 (unin-
fected control). Probes designed against the non-coding
strand (to detect DNA but not RNA) of g20 generated a
signal from DNA extracted from infected host cells in flask
2 (24 hours prior to culture lysis) (Fig. 2b). Probes for the
non-coding strand only produced a very weak signal from
the RNA extractions from flask 2 (Fig. 2b). This result con-
firmed that the coding strand probes were able to detect
cyanophage strain S-PM2 g20 mRNA from infected Syne-
chococcus sp. WH7803 host cells (Fig. 2a).
Studying g20 gene expression during the cyanophage
infection cycle
Further experiments were set up to determine whether the
SMART assay could monitor S-PM2 g20 expression during
the cyanophage infection cycle. Samples collected over a
time series were used to detect changes in the levels of g20
mRNA and DNA following infection of Synechococcus by
cyanophage S-PM2 (Fig. 3). Results from a preliminary
experiment had indicated when the intracellular viral
RNA and DNA was likely to peak (i.e. after the 4-hour
time point: data not shown), hence the collection of sam-
ples increased in intensity from the 4-hour (240 minute)
time point. Since the focus was g20 expression, the major-
ity of samples were taken for RNA analysis, but some sam-
ples were also analysed for viral DNA, to determine how
the sets of data would relate to each other. SMART assays
[1,4] were used to detect g20 target mRNA and DNA.
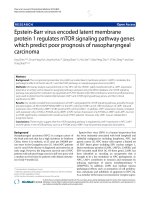
Cyanophage S-PM2 g20 expression was only detected at a
low level up to the 240-minute post-infection (i.e. after
addition of cyanophages to the host culture) time point.
Despite variation in the data, S-PM2 g20 mRNA concen-
tration increased sharply at 240-minutes post-infection,
with maximum g20 mRNA detected at 260-minutes post
infection (Fig. 3a). At 10 – 11 hours post-infection, g20
mRNA had dropped back to lower concentrations. g20
DNA started to increase 6-hours post-infection, to a max-
imum level 10-hours post-infection (Fig. 3b).
Detection of g20 nucleic acid during infection of Synechococ-cus sp. WH7803 by cyanophage strain S-PM2Figure 3
Detection of g20 nucleic acid during infection of Synechococ-
cus sp. WH7803 by cyanophage strain S-PM2. Level of cyano-
phage g20 mRNA (a) and g20 DNA (b) detected from either
total RNA (a), or DNA (b), extracted from duplicate samples
of infected host cells measured at specific time points (0 –
720 minutes post-infection). Graphs show the amount of
RNA signal (fmol) generated from each target as determined
by ELOSA.
(a)
(b)
0
20
40
60
80
100
120
0
2
4
0
3
6
0
480
6
0
0
720
Time (minutes)
fmol RNA signal (minus background)
0
50
100
150
200
250
300
350
0
240
360
4
8
0
600
7
2
0
Time (minutes)
fmol RNA signal (minus background)
Specific detection of cyanophage S-PM2 g20 target RNA or DNA extracted from infected host Synechococcus sp. WH7803Figure 2
Specific detection of cyanophage S-PM2 g20 target RNA or
DNA extracted from infected host Synechococcus sp.
WH7803. Graphs show signals generated from probes tar-
geting either the coding strand (a) (to detect DNA + RNA)
or non-coding strand (b) (to detect DNA but not RNA).
RNA and DNA was extracted from infected cultures grown
in flask 2 (24 hours prior to culture lysis). Results are com-
pared to signals generated by both sets of probes using
nucleic acid extracted from the uninfected control culture
(flask 3). Graphs show the amount of RNA signal (fmol) gen-
erated from each target as determined by ELOSA.
(a) (b)
Detec tion of DNA a nd RNA
0
100
200
300
400
500
600
700
800
900
1000
Inf ecte d
Flask 2
Uninf e ct ed
Flas k 3
Inf ected
Flask 2
Uni nf ec ted
Flas k 3
RNA extractions DNA extractions
fmol RNA signal
Detection of DNA only
0
100
200
300
400
500
600
700
800
900
1000
Inf ected
Flas k 2
Uninf e ct ed
Flas k 3
Inf ected
Flask 2
Uninf e ct ed
Flas k 3
RNA ex trac tions DNA ex trac tions
fmol RNA signal
Virology Journal 2007, 4:52 />Page 5 of 8
(page number not for citation purposes)
Data obtained using the SMART assay fit with what is
already known about the kinetics of cyanophage infec-
tion. In cyanophage strain S-PM2 the onset of lysis occurs
after a 9 hour latent period in infected Synechococcus sp.
WH7803 cells [39]. Maximum g20 expression was
observed at 4 hours 20 minutes after infection (Fig. 3a),
which is just under half way through the S-PM2 latent
period. If compared to phage T4 infection, which has a
latent period of 25 minutes [40], this would characterise
S-PM2 g20 mRNA as a mid to late transcript. However,
recent work by Clokie et al [30] demonstrated that S-PM2
only has 2 (early and late) classes of transcripts rather than
the 3 (early, mid and late) observed in T4. In T4, late
mRNA is known to direct the synthesis of phage T4 struc-
tural proteins as well as proteins that help with phage
assembly and are involved in cell lysis. S-PM2, structural
genes g18 and g23 were characterised as late transcripts
[30] and their expression increased to maximum levels
between 4 – 6 hours; this is consistent with S-PM2 g20
(another structural gene) expression data in figure 3 here.
Evidence from electron microscopy and other studies on
T4 suggests that the prohead and mature head contain
960 copies of gp23, the major capsid protein, compared
with only 12 copies of gp20. Indeed, gp20 is the least
abundant of the prohead proteins compared to the others
that have copy numbers of between 55 (gp24) and 576
(gp22) [32]. If expression levels are similar in cyanophage
S-PM2, it is encouraging that the SMART assay has the nec-
essary sensitivity for detecting g20 gene expression. There-
fore, it is likely that the assay would be highly suitable for
future expression studies.
The increase in signal from S-PM2 g20 DNA (Fig. 3) is
consistent with the continuous replication of cyanophage
DNA for eventual packaging into proheads during the
infection cycle [41]. The peak of g20 DNA within the host
cells 10 hours post-infection is consistent with previous
observations that the onset of Synechococcus cell lysis
occurs from 9 hours post-infection with the burst period
continuing to 12 – 15 hours post-infection [39].
Conclusion
The SMART assay successfully differentiated between
infected and non-infected host cultures and detected gene
expression. SMART is a simple and sensitive assay, which
may be a suitable alternative to more conventional tech-
niques such as Northern analysis and RT-PCR for a range
of applications. Also, since is it relatively simple to adapt
the assay for the detection of other target sequences, it
would be possible to use a set of different specific probes
to simultaneously study the expression of different virus
and host genes, or assay for different viruses. The equip-
ment used is relatively simple and start up costs low, so for
many applications (where there is interest in a relatively
small number of genes) it could be developed as a simple
alternative to the use of microarrays.
Interest in isothermal nucleic acid amplification is cur-
rently increasing. One possible future application of these
techniques includes in situ work, for example for use in
the identification and quantification of infected cells. The
repeated rounds of high temperatures involved in thermal
cycling can create problems with in situ PCR, due to cellu-
lar damage. In addition, isothermal amplification tech-
niques are potentially more robust, and have lower energy
requirements than methods involving thermal cycling.
These are significant benefits for certain applications, such
as developing assays for use in remote areas, or for auton-
omous systems with applications which might include
environmental monitoring and assessing public health
risks.
The SMART assay, based on isothermal nucleic acid
amplification, allows the detection of specific sequences
of DNA or RNA. It was shown to be suitable for differen-
tiating between virus-infected and non-infected host cul-
tures and for the detection of gene expression: the first
reported use of this technology for such applications.
Methods
Cyanophages, host strain and media
Technical details concerning host strain Synechococcus sp.
WH7803, growth media, culturing, cyanophage strain S-
PM2 stock preparation and propagation have been
described previously [4,21,39].
Reagents
Oligonucleotide probes synthesised by phosphoramidite
chemistry using a model 380A synthesiser (Applied Bio-
systems, Foster City, CA, USA) and purified using stand-
ard HPLC or FPLC techniques were obtained from Oswel
Research products (Southampton, UK).
Probe design
The sequences of cyanophage-specific probes are listed in
table 1. Probes for the S-PM2 g20 coding strand are iden-
tical to those used previously [4]. A further set of probes
was designed to detect the non-coding strand of g20. The
sequences of targets, probes, and RNA signals were
designed to minimise potential secondary structure, and
their melting temperatures were determined, as described
previously [4]. The template probes include a hexaethyl-
ene glycol (HEG) linker molecule to reduce non-specific
background signal. Sequences of probes for the amplifica-
tion of signal RNA, capture and detection of SMART sig-
nal, and of synthetic product for ELOSA standard curve
have all been published previously [1,4].
Virology Journal 2007, 4:52 />Page 6 of 8
(page number not for citation purposes)
Sampling infected host 24 hours prior to lysis
An exponentially growing culture of Synechococcus sp.
WH7803 was split into 3 × 100 mL aliquots in sterile glass
conical flasks and incubated at 25°C under constant illu-
mination (5 to 36 microeinsteins m
-2
s
-1
). At time zero,
cyanophage strain S-PM2 was added to flask 1 at a multi-
plicity of infection of approximately 0.1 (= 1 mL of fresh
lysate); 24 hours later, the same volume of cyanophage
lysate was added to flask 2; flask 3 remained uninfected as
a control. Flask 1 lysed (indicated by clearing of the cul-
ture) 3 days after initial infection, therefore, we predicted
that virus mRNA would be detectable in flask 2 at this
time point (24-hours prior to culture lysis). RNA and
DNA were extracted from the cultures sampled at this time
point as described below.
Sampling to follow g20 gene expression during the
cyanophage infection cycle
A 1 L culture of exponentially growing Synechococcus sp.
WH7803 host cells was infected with cyanophage strain S-
PM2 at a MOI of approximately 1 and incubated for 12
hours at 25°C under constant illumination. Duplicate 4
mL and 2 mL aliquots of infected cells (for RNA and DNA
extraction respectively) were pelleted, snap frozen in liq-
uid N
2
then stored at -80°C at various time intervals over
the 12 hour period. Frozen cell pellets were defrosted at
37°C and DNA and RNA were extracted as described
below.
Extraction of viral nucleic acid from infected host cells
RNA was extracted from 4 mL of pelleted cells using a Qia-
gen RNeasy
®
Mini kit according to the manufacturer's
instructions (Qiagen, West Sussex, UK). The protocol
included a DNase treatment step. RNA was eluted in a
final volume of 50 µL RNase-free sterile water. DNA was
extracted from 2 mL of pelleted cells using a Qiagen
DNeasy™ Tissue kit according to the manufacturer's
instructions (Qiagen, West Sussex, UK). DNA was eluted
in a final volume of 100 µL RNase-free sterile water.
SMART assays [1,4] were conducted on 5 µL target nucleic
acid, as described below.
The SMART assay: isothermal amplification from specific
target
Use of the SMART assay for the specific detection of cyan-
ophage DNA has been described previously [4]. Target
DNA was added to a mixture containing 2 µL 10× tran-
scription buffer (Ambion, Austin, TX, USA), extension
probe (5 fmol), template probe (1 fmol), facilitator
probes 1 and 2 (100 fmol each) and ultra-pure, sterile,
RNase-free water to a final volume of 15 µL. Samples were
mixed, heated at 90°C for 3 min on a PTC-200™ thermal
cycler (MJ Research, Waltham, MA, USA), ramped down
to 41°C (0.1°C/s) and held at this temperature for 1 h. A
5 µL volume of solution containing dNTPs (5 µM each),
NTPs (2 mM each) (both from Amersham Biosciences,
Aylesbury UK), 4 U Bst (3' to 5'exo
-
) DNA polymerase
(New England Biolabs, Beverly, MA, USA) and 240 U T7
RNA polymerase (Ambion) was then added, and the reac-
tion was incubated at 41°C for an additional 2 h.
To amplify the RNA signal further, the samples were
brought to room temperature before the addition of 20
fmol RNA amplification probe, followed by a mixture
containing 4.5 µL 10× transcription buffer, dNTPs (50 µM
each dNTP), NTPs (2 mM each NTP), 4 U Bst (3' to 5'exo
-
) DNA polymerase, 160 U T7 RNA polymerase, and ultra-
pure, sterile, RNAse-free water to give a final volume of 17
µL. The samples were mixed and then incubated at 37°C
for 2 h. The samples could be stored at -20°C before the
signals were quantified.
The SMART assay: capture and detection of the assay
signal
The RNA signal was assayed by an Enzyme Linked Oli-
goSorbent Assay (ELOSA). The RNA sequence includes
regions for capture, via a biotinylated probe, and detec-
tion using a further probe linked to alkaline phosphatase
(Fig. 1b). Biotinylated capture probe (0.9 pmol) and alka-
line phosphatase-labelled probe (6 pmol) were added to
each well of a streptavidin-coated Combiplate (Thermo
Life Sciences, Hampshire, UK), in hybridisation buffer [50
mM Tris-HCl, pH 8.0, 1 M NaCl, 20 mM EDTA and 1%
(w/v) BSA]. An aliquot (5–20 µL) of the sample to be
quantified was then added, bringing the total volume to
150 µL per well. Samples were incubated at room temper-
ature on a platform shaker at 300 rpm for 1 h. Unbound
material was removed from wells by washing 4 times with
200 µL wash buffer [1× TBS/0.1% Tween-20], then once
with 200 µL alkaline phosphatase substrate buffer (SCIL
Diagnostics, Martinsried, Germany). Substrate (4-Nitro-
phenyl phosphate, Boehringer-Mannheim UK, Sussex,
UK), at 5 mg/mL in substrate buffer, was then added (180
µL/well) and alkaline phosphatase activity was measured
using a plate reader (Labsystems integrated EIA Manage-
ment system, Thermo Life Sciences) pre-warmed at 37°C,
reading absorbance at 405 nm every 2 minutes for 30
minutes. Rates of alkaline phosphatase activity for each
sample were compared to a standard curve, generated
using dilutions of a synthetic DNA oligonucleotide with
the same sequence as the RNA product. This allowed the
amount of RNA produced in each extension/transcription
reaction to be calculated.
Competing interests
SW is a former employee (1997–2001), and shareholder,
of Cytocell Ltd. Patents for the SMART technology were
held by Cytocell Ltd. However, since Cytocell Ltd has
ceased to trade, there are no competing interests.
Virology Journal 2007, 4:52 />Page 7 of 8
(page number not for citation purposes)
Authors' contributions
SW participated in the design and co-ordination of the
study, designed the specific probes, participated in inter-
pretation of data and drafted the manuscript. MH gener-
ated and processed the samples, performed the SMART
assays, and participated in interpretation of data. WW
conceived the study, participated in its design and co-ordi-
nation, in the interpretation of data, and helped to draft
the manuscript. All authors read and approved the final
manuscript.
Acknowledgements
This study was partly funded by a Natural Environmental Research Council
(NERC) CONNECT B grant, GR3/CO058, awarded jointly to W.H.W. and
Cytocell Ltd.: CONNECT B is a scheme designed to encourage collabora-
tion between academia and industry. The work described in this paper is
the subject of various patents and patent applications (including EP-B-
0,666.927; AU 672367; and WO 99/37806) originally held by Cytocell Ltd.
UK. We gratefully acknowledge Cytocell Ltd. for allowing us to use the
cyanophage infection system as a testing ground for their technology. Par-
ticular thanks go to Anthony Weston, who participated in the design of the
study and Peter Marsh (both formerly of Cytocell Ltd., UK) for their advice
and support during the development phase of the SMART assay.
References
1. Wharam SD, Marsh P, Lloyd JS, Ray TD, Mock GA, Assenberg R,
McPhee JE, Brown P, Weston A, Cardy DLN: Specific detection of
DNA and RNA targets using a novel isothermal nucleic acid
amplification assay based on the formation of a three-way
junction structure. Nucleic Acids Research 2001, 29:e54.
2. Levi K, Bailey C, Bennett A, Marsh P, Cardy DL, Towner KJ: Evalua-
tion of an Isothermal Signal Amplification Method for Rapid
Detection of Methicillin-Resistant Staphylococcus aureus
from Patient-Screening Swabs. Journal of Clinical Microbiology
2003, 41:3187-3191.
3. Brown DFJ, Edwards DI, Hawkey PM, Morrison D, Ridgway GL,
Towner KJ, Wren MWD, on behalf of the Joint Working Party of the
British Society for Antimicrobial Chemotherapy HISaICNA: Guide-
lines for the laboratory diagnosis and susceptibility testing of
methicillin-resistant Staphylococcus aureus (MRSA). Journal
of Antimicrobial Chemotherapy 2005, 56:1000-1018.
4. Hall MJ, Wharam SD, Weston A, Cardy DLN, Wilson WH: Use of
signal-mediated amplification of RNA technology (SMART)
to detect marine cyanophage DNA. Biotechniques 2002,
32:604-611.
5. Suttle CA: Cyanophages and their role in the ecology of
cyanobacteria. In The ecology of cyanobacteria: Their diversity in time
and space Edited by: Whitton BA, Potts M. Boston: Kluwer Academic
Publishers, Boston; 2000:563-589.
6. Suttle CA, Chan AM: Marine Cyanophages Infecting Oceanic
and Coastal Strains of Synechococcus – Abundance, Morphol-
ogy, Cross-Infectivity and Growth-Characteristics. Marine
Ecology-Progress Series 1993, 92:99-109.
7. Suttle CA, Chan AM: Dynamics and Distribution of Cyano-
phages and Their Effect On Marine Synechococcus spp.
Applied and Environmental Microbiology 1994, 60:3167-3174.
8. Waterbury JB, Valois FW: Resistance to Cooccurring Phages
Enables Marine Synechococcus Communities to Coexist
With Cyanophages Abundant in Seawater. Applied and Environ-
mental Microbiology 1993, 59:3393-3399.
9. Wilson WH, Joint IR, Carr NG, Mann NH: Isolation and molecu-
lar characterization of five marine cyanophages propagated
on Synechococcus sp strain WH7803. Applied and Environmental
Microbiology 1993, 59:3736-3743.
10. Waterbury JB, Watson SW, Valois FW, Franks DG: Biological and
ecological characterisation of the marine unicellular cyano-
bacterium Synechococcus. In Photosynthetic picoplankton Volume
214. Edited by: Platt T, Li WKW. Canadian Bulletin of Fisheries and
Aquatic Sciences; 1986:71-120.
11. Hennes KP, Suttle CA, Chan AM: Fluorescently Labeled Virus
Probes Show That Natural Virus Populations Can Control
the Structure of Marine Microbial Communities. Applied and
Environmental Microbiology 1995, 61:3623-3627.
12. Fuhrman JA: Marine viruses and their biogeochemical and eco-
logical effects. Nature 1999, 399:541-548.
13. Hewson I, Govil SR, Capone DG, Carpenter EJ, Fuhrman JA: Evi-
dence of Trichodesmium viral lysis and potential significance
for biogeochemical cycling in the oligotrophic ocean. Aquatic
Microbial Ecology 2004, 36:1-8.
14. Wilhelm SW, Suttle CA: Viruses and Nutrient Cycles in the Sea
– Viruses play critical roles in the structure and function of
aquatic food webs. Bioscience 1999, 49:781-788.
15. Wilson WH, Fuller NJ, Joint IR, Mann NH: Analysis of cyanophage
diversity and population structure in a south-north transect
of the Atlantic Ocean. In Marine Cyanobacteria Issue 19 Edited by:
Charpy L, Larkum AWD. Monaco: Bulletin de l'Institut Oceano-
graphique; 1999:209-216.
16. Wilson WH, Fuller NJ, Joint IR, Mann NH: Analysis of cyanophage
diversity in the marine environment using denaturing gradi-
ent gel electrophoresis. In Microbial Biosystems: New Frontiers Pro-
ceedings of the 8th International Symposium on Microbial Ecology. Atlantic
Canada Society for Microbial Ecology Edited by: Bell CR, Brylinsky M,
Johnson-Green P. Halifax, Canada; 2000:565-570.
17. McDaniel L, Houchin LA, Williamson SJ, Paul JH: Plankton blooms
– Lysogeny in marine Synechococcus. Nature 2002, 415:496-496.
18. Ortmann AC, Lawrence JE, Suttle CA: Lysogeny and lytic viral
production during a bloom of the cyanobacterium Synechoc-
occus spp. Microbial Ecology 2002, 43:225-231.
19. Zhong Y, Chen F, Wilhelm SW, Poorvin L, Hodson RE: Phyloge-
netic diversity of marine cyanophage isolates and natural
virus communities as revealed by sequences of viral capsid
assembly protein gene g20. Applied and Environmental Microbiology
2002, 68:1576-1584.
20. Muhling M, Fuller NJ, Millard A, Somerfield PJ, Marie D, Wilson WH,
Scanlan DJ, Post AF, Joint I, Mann NH: Genetic diversity of marine
Synechococcus and co-occurring cyanophage communities:
evidence for viral control of phytoplankton. Environmental
Microbiology 2005, 7:499-508.
21. Fuller NJ, Wilson WH, Joint IR, Mann NH: Occurrence of a
sequence in marine cyanophages similar to that of T4 g20
and its application to PCR-based detection and quantifica-
tion techniques. Applied and Environmental Microbiology 1998,
64:2051-2060.
22. Hambly E, Tetart F, Desplats C, Wilson WH, Krisch HM, Mann NH:
A conserved genetic module that encodes the major virion
components in both the coliphage T4 and the marine cyano-
phage S-PM2. Proceedings of the National Academy of Sciences of the
United States of America 2001, 98:11411-11416.
23. Chen F, Lu JR: Genomic sequence and evolution of marine
cyanophage P60: a new insight on lytic and lysogenic phages.
Applied and Environmental Microbiology 2002, 68:2589-2594.
24. Mann NH, Clokie MRJ, Millard A, Cook A, Wilson WH, Wheatley PJ,
Letarov A, Krisch HM: The genome of S-PM2, a "photosyn-
thetic" T4-type bacteriophage that infects marine Synechoc-
occus strains. Journal of Bacteriology 2005, 187:3188-3200.
25. Sullivan MB, Coleman ML, Weigele P, Rohwer F, Chisholm SW:
Three Prochlorococcus cyanophage genomes: Signature
features and ecological interpretations. Plos Biology 2005,
3:790-806.
26. Lindell D, Sullivan MB, Johnson ZI, Tolonen AC, Rohwer F, Chisholm
SW: Transfer of photosynthesis genes to and from Prochlo-
rococcus viruses. Proceedings of the National Academy of Sciences of
the United States of America 2004, 101:11013-11018.
27. Mann NH, Cook A, Millard A, Bailey S, Clokie M: Marine ecosys-
tems: Bacterial photosynthesis genes in a virus. Nature 2003,
424:741-741.
28. Sullivan MB, Lindell D, Lee JA, Thompson LR, Bielawski JP, Chisholm
SW: Prevalence and evolution of core photosystem II genes
in marine cyanobacterial viruses and their hosts. Plos Biology
2006, 4:1344-1357.
29. Lindell D, Jaffe JD, Johnson ZI, Church GM, Chisholm SW: Photo-
synthesis genes in marine viruses yield proteins during host
infection. Nature 2005, 438:86-89.
30. Clokie MRJ, Shan JY, Bailey S, Jia Y, Krisch HM, West S, Mann NH:
Transcription of a 'photosynthetic' T4-type phage during
Publish with Bio Med Central and every
scientist can read your work free of charge
"BioMed Central will be the most significant development for
disseminating the results of biomedical research in our lifetime."
Sir Paul Nurse, Cancer Research UK
Your research papers will be:
available free of charge to the entire biomedical community
peer reviewed and published immediately upon acceptance
cited in PubMed and archived on PubMed Central
yours — you keep the copyright
Submit your manuscript here:
/>BioMedcentral
Virology Journal 2007, 4:52 />Page 8 of 8
(page number not for citation purposes)
infection of a marine cyanobacterium. Environmental Microbiol-
ogy 2006, 8:827-835.
31. Clokie MRJ, Mann NH: Marine cyanophages and light. Environ-
mental Microbiology 2006, 8:2074-2082.
32. Black LW, Showe MK, Steven AC: Morphogenesis of the T4
Head. In Molecular Biology of Bacteriophage T4 Edited by: Karam JD,
Drake JW, Kreuzer KN, Mosig G, Hall DH, Eiserling FA, Black LW,
Spicer EK, Kutter E, Carlson K, Miller ES. Washington DC: American
Society for Microbiology; 1994:218-258.
33. Dorigo U, Jacquet S, Humbert JF: Cyanophage Diversity, Inferred
from g20 Gene Analyses, in the Largest Natural Lake in
France, Lake Bourget. Applied and Environmental Microbiology
2004, 70:1017-1022.
34. Marston MF, Sallee JL: Genetic Diversity and Temporal Varia-
tion in the Cyanophage Community Infecting Marine Syne-
chococcus Species in Rhode Island's Coastal Waters. Applied
and Environmental Microbiology 2003, 69:4639-4647.
35. Sandaa RA, Larsen A: Seasonal Variations in Virus-Host Popu-
lations in Norwegian Coastal Waters: Focusing on the Cyan-
ophage Community Infecting Marine Synechococcus spp.
Applied and Environmental Microbiology 2006, 72:4610-4618.
36. Short CM, Suttle CA: Nearly Identical Bacteriophage Struc-
tural Gene Sequences Are Widely Distributed in both
Marine and Freshwater Environments. Applied and Environmen-
tal Microbiology 2005, 71:480-486.
37. Wang K, Chen F: Genetic diversity and population dynamics of
cyanophage communities in the Chesapeake Bay. Aquatic
Microbial Ecology 2004, 34:105-116.
38. Wilhelm SW, Carberry MJ, Eldridge ML, Poorvin L, Saxton MA, Dob-
lin MA: Marine and Freshwater Cyanophages in a Laurentian
Great Lake: Evidence from Infectivity Assays and Molecular
Analyses of g20 Genes. Applied and Environmental Microbiology
2006, 72:4957-4963.
39. Wilson WH, Carr NG, Mann NH: The effect of phosphate status
on the kinetics of cyanophage infection in the oceanic cyano-
bacterium Synechococcus sp WH7803. Journal of Phycology 1996,
32:506-516.
40. Mathews CK: An overview of the T4 developmental program.
In Molecular Biology of Bacteriophage T4 Edited by: Karam JD, Drake
JW, Kreuzer KN, Mosig G, Hall DH, Eiserling FA, Black LW, Spicer
EK, Kutter E, Carlson K, Miller ES. Washington DC: American Society
for Microbiology; 1994:1-8.
41. Black LW: DNA packaging in dsDNA Bacteriophages. In The
Bacteriophages Edited by: Calendar R. New York: Plenum Press;
1988:321-373.