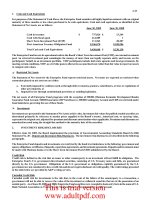
STATE OF CALIFORNIA SCHEDULE 4B PROGRAM: NONCONTRACT COMPUTATION OF MEDI-CAL INPATIENT ROUTINE SERVICE COST _part2 pptx
Bạn đang xem bản rút gọn của tài liệu. Xem và tải ngay bản đầy đủ của tài liệu tại đây (57.14 KB, 11 trang )
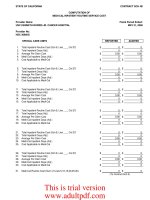
STATE OF CALIFORNIA DESIG PUB HOSP SCH 6
Provider Name: Fiscal Period Ended:
SAN FRANCISCO GENERAL HOSPITAL JUNE 30, 2009
Provider No:
HSC00228W
ANCILLARY CHARGES
37.00 Operating Room $ 15,322,515 $ 2,947,284 $ 18,269,799
39.00 Delivery Room and Labor Room 1,597,863 (1,596,070) 1,793
40.00 Anesthesiology 11,192,897 2,435,045 13,627,942
41.00 Radiology - Diagnostic 13,318,217 462,707 13,780,924
43.00 Radioisotope 0
44.00 Laboratory 19,463,335 2,355,875 21,819,210
44.01 Laboratory Pathology 1,111,037 71,374 1,182,411
46.00 Whole Blood 1,549,612 444,250 1,993,862
49.00 Respiratory Therapy 2,728,726 538,596 3,267,322
50.00 Physical Therapy 2,067,788 1,083,916 3,151,704
51.00 Occupational Therapy 1,045,026 (442,844) 602,182
53.00 Electrocardiology 2,320,068 696,167 3,016,235
54.00 Electroencephalography 0
55.00 Medical Supplies Charged to Patients 21,082,150 4,440,029 25,522,179
55.01 Implantable Devices 63,025 110,879 173,904
56.00 Drugs Charged to Patients 38,694,153 5,635,508 44,329,661
57.00 Renal Dialysis 705,059 (58,703) 646,356
59.00 Other Ancillary Services 173,365 8,893 182,258
59.01 0
59.02 0
59.03
0
59.04 0
59.05 0
59.06 0
59.07 0
59.08 0
59.09 0
59.10 0
60.00 Clinic 5,515 0 5,515
61.00 Emergency 6,931,462 887,389 7,818,851
61.01 Psych Emergency 0
62.00 Observation Beds 0
63.60 Adult Medical Center FQHC I 0
63.61 Women's Health Center FQHC II 0
63.62 Family Health Center FQHC III 0
63.63 Children's Health Center FQHC IV 0
63.64 Urgent Care FQHC V 0
64.00 Home Program Dialysis 0
TOTAL MEDI-CAL ANCILLARY CHARGES $ 139,371,813 $ 20,020,295 $ 159,392,108
(To Desig Pub Hosp Sch 5)
AUDITEDADJUSTMENTSREPORTED
(Adjs 22, 26)
ADJUSTMENTS TO MEDI-CAL CHARGES
This is trial version
www.adultpdf.com
STATE OF CALIFORNIA DESIG PUB HOSP SCH 7
Provider Name: Fiscal Period Ended:
SAN FRANCISCO GENERAL HOSPITAL JUNE 30, 2009
Provider No:
HSC00228W
PROFESSIONAL
SERVICE
COST CENTERS
60.00 Clinic $ 0 $ 0 0.000000 $ $ 0
60.01 Adult Medical Center 0 0 0.000000 0
60.02 Women's Health Center 0 0 0.000000 0
60.03 Family Health Center 0 0 0.000000 0
60.04 Children's Health Center 0 0 0.000000 0
0 0 0.000000 0
0 0 0.000000 0
0 0 0.000000 0
0 0 0.000000 0
0 0 0.000000 0
0 0 0.000000 0
0 0 0.000000 0
0 0 0.000000 0
0 0 0.000000 0
0 0 0.000000 0
0 0 0.000000 0
0 0 0.000000 0
0 0 0.000000 0
0 0 0.000000 0
0 0 0.000000 0
0 0 0.000000 0
0 0 0.000000 0
0 0 0.000000 0
0 0 0.000000 0
0 0 0.000000 0
0 0 0.000000 0
0 0 0.000000 0
0 0 0.000000 0
0 0 0.000000 0
0 0 0.000000 0
0 0 0.000000 0
0 0 0.000000 0
0 0 0.000000 0
0 0 0.000000 0
0 0 0.000000 0
0 0 0.000000 0
0 0 0.000000 0
0 0 0.000000 0
0 0 0.000000 0
TOTAL $ 0 $ 0 $ 0 $ 0
(To Desig Pub Hosp Sch 3)
HBP TOTAL CHARGES
TO ALL PATIENTS
RATIO OF
REMUNERATION
MEDI-CAL
COSTCHARGES
COMPUTATION OF PROFESSIONAL
COMPONENT OF HOSPITAL BASED
REMUNERATION
(Adj )(Adj ) (Adj )
PHYSICIAN'S REMUNERATION
TO CHARGES
MEDI-CAL
This is trial version
www.adultpdf.com
STATE OF CALIFORNIA DPNF SCH 1
Provider Name: Fiscal Period Ended:
SAN FRANCISCO GENERAL HOSPITAL JUNE 30, 2009
Provider No:
LTC55660F
REPORTED AUDITED DIFFERENCE
COMPUTATION OF DISTINCT PART (DP)
NURSING FACILITY PER DIEM
1. Distinct Part Ancillary Cost (DPNF Sch 3) $ 0 $ 0 $ 0
2. Distinct Part Routine Cost (DPNF Sch 2) $ 20,673,166 $ 20,235,317 $ (437,849)
3. Total Distinct Part Facility Cost (Lines 1 & 2) $ 20,673,166 $ 20,235,317 $ (437,849)
4. Total Distinct Part Patient Days (Adj ) 31,641 31,641 0
5. Average DP Per Diem Cost (Line 3 / Line 4) $ 653.37 $ 639.53 $ (13.84)
DPNF OVERPAYMENT AND OVERBILLINGS
6. Medi-Cal Overpayments (Adj ) $ 0 $ 0 $ 0
7. Medi-Cal Credit Balances (Adj ) $ 0 $ 0 $ 0
8. MEDI-CAL SETTLEMENT Due Provider (State) $ 0 $ 0 $ 0
(To Summary of Findings)
GENERAL INFORMATION
9. Total Available Distinct Part Beds (C/R, W/S S-3) (Adj) 89 89 0
10. Total Licensed Capacity (All levels) (Adj 29) 477 598 121
11. Total Medi-Cal DP Patient Days (Adj 30 ) 0 14,113 14,113
CAPITAL RELATED COST
12. Direct Capital Related Cost N/A $ 48,338 N/A
13. Indirect Capital Related Cost (DPNF Sch 5) N/A $ 2,230,042 N/A
14. Total Capital Related Cost (Lines 12 & 13) N/A $ 2,278,380 N/A
TOTAL SALARY & BENEFITS
15. Direct Salary & Benefits Expenses N/A $ 8,560,771 N/A
16. Allocated Salary & Benefits (DPNF Sch 5) N/A $ 3,939,048 N/A
17. Total Salary & Benefits Expenses (Lines 15 & 16) N/A $ 12,499,819 N/A
COMPUTATION OF
DISTINCT PART NURSING FACILITY PER DIEM
This is trial version
www.adultpdf.com
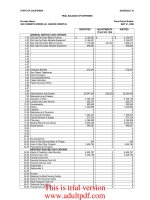
STATE OF CALIFORNIA DPNF SCH 2
Provider Name: Fiscal Period Ended:
SAN FRANCISCO GENERAL HOSPITAL JUNE 30, 2009
Provider No:
LTC55660F
COST CENTER
COL. DIRECT AND ALLOCATED EXPENSE
0.00 Distinct Part $ 11,401,801 $ 11,400,867 $ (934)
1.00 Old Cap Rel Cost - Buildings and Fixtures 0 0
1.01 Old Cap Rel Cost - Building 2 0 0
1.02 Old Cap Rel Cost - Building 3 0 0
1.03 Old Cap Rel Cost - Building 5 4,305 4,305 0
1.05 Old Cap Rel Cost - Building 10 0 0
1.06 Old Cap Rel Cost - Building 20 0 0
1.07 Old Cap Rel Cost - Building 30 0 0
1.09 Old Cap Rel Cost - MRI Building 0 0
1.10 Old Cap Rel Cost - Building 80 0 0
1.11 Old Cap Rel Cost - Building 90 0 0
1.13 Old Cap Rel Cost - Land Improvements 0 0
2.00 Old Cap Rel Cost - Moveable Equipment 0 0
3.00 New Cap Rel Cost - Buildings and Fixtures 0 0
3.01 New Cap Rel Cost - Building 2 0 0
3.02 New Cap Rel Cost - Building 3 0 0
3.03 New Cap Rel Cost - Building 5 27,855 27,855 0
3.04 New Cap Rel Cost - Building 9 0 0
3.05 New Cap Rel Cost - Building 10 0 0
3.06 New Cap Rel Cost - Building 20 0 0
3.07 New Cap Rel Cost - Building 30 0 0
3.08 New Cap Rel Cost - Building 40 0 0
3.09 New Cap Rel Cost - MRI Building 0 0
3.10 New Cap Rel Cost - Building 80 0 0
3.11 New Cap Rel Cost - Building 90 0 0
3.12 New Cap Rel Cost - Building 100 0 0
3.13 New Cap Rel Costs - Land Imp 615 616 1
3.14 New Cap Rel Costs - MHRF 415,512 415,512 0
4.00 New Cap Rel Costs - Moveable Equipment 0 0
4.01 New Cap Rel Costs - Moveable Equipment 0 0
5.00 Employee Benefits 297,213 297,213 (0)
6.00 Administrative and General 2,506,511 2,200,869 (305,642)
7.00 Maintenance and Repairs 946,090 926,406 (19,684)
8.00 Operation of Plant 856,915 839,098 (17,817)
9.00 Laundry and Linen Service 156,882 153,614 (3,268)
10.00 Housekeeping 847,647 829,978 (17,669)
10.01 Housekeeping 0 0 0
11.00 Dietary 1,506,589 1,475,411 (31,178)
12.00 Cafeteria 60,710 59,457 (1,253)
14.00 Nursing Administration 1,209,549 1,184,375 (25,174)
15.00 Central Services and Supply 6,992 9,775 2,783
16.00 Pharmacy 1,910 1,977 67
17.00 Medical Records and Library 266,354 254,963 (11,391)
18.00 Social Service 159,716 153,027 (6,689)
22.00 Intern and Res Services - Salary and Fringes 0 0
TOTAL DIRECT AND
101.00 ALLOCATED EXPENSES $ 20,673,166 $ 20,235,317 $ (437,849)
* From Hospital Audit Report Sch 8, Part I, line 34. (To DPNF Sch 1)
REPORTED * AUDITED *
SUMMARY OF DISTINCT PART FACILITY EXPENSES
DIFFERENCE
This is trial version
www.adultpdf.com
STATE OF CALIFORNIA DPNF SCH 3
Provider Name: Fiscal Period Ended:
SAN FRANCISCO GENERAL HOSPITAL JUNE 30, 2009
Provider No:
LTC55660F RATIO
COST TO
CHARGES
ANCILLARY COST CENTERS (From DPNF Sch 4)
49.00 Respiratory Therapy $ 5,914,642 $ 21,779,813 0.271565 $ 0 $ 0
55.00
Med Supply Charged to Patients 4,151,690 58,257,007 0.071265 0 0
56.00 Drugs Charged to Patients 6,037,873 8,387,370 0.719877 0 0
0.000000 0 0
0.000000 0 0
0.000000 0 0
0.000000 0 0
0.000000 0 0
0.000000 0 0
0.000000 0 0
0.000000 0 0
0.000000 0 0
0.000000 0 0
0.000000 0 0
0.000000 0 0
0.000000 0 0
0.000000 0 0
0.000000 0 0
0.000000 0 0
0.000000 0 0
0.000000 0 0
0.000000 0 0
0.000000 0 0
0.000000 0 0
0.000000 0 0
0.000000 0 0
0.000000 0 0
0.000000 0 0
0.000000 0 0
0.000000 0 0
0.000000 0 0
0.000000 0 0
0.000000 0 0
0.000000 0 0
0.000000 0 0
0.000000 0 0
0.000000 0 0
0.000000 0 0
0.000000 0 0
0.000000 0 0
0.000000 0 0
0.000000 0 0
101.00 TOTAL $ 16,104,205 $ 88,424,190 $ 0 $ 0
(To DPNF Sch 1)
* From Acute care Schedule 8, Column 27.
** Total Distinct Part Ancillary Charges included in the rate.
*** Total Distinct Part Ancillary Costs included in the rate.
TOTAL
DP ANCILLARY
CHARGES **
TOTAL
ANCILLARY
COST***
TOTAL
ANCILLARY
COST *
SCHEDULE OF TOTAL DISTINCT PART ANCILLARY COSTS
TOTAL ANCILLARY
CHARGES
This is trial version
www.adultpdf.com
STATE OF CALIFORNIA DPNF SCH 4
Provider Name: Fiscal Period Ended:
SAN FRANCISCO GENERAL HOSPITAL JUNE 30, 2009
Provider No:
LTC55660F
ANCILLARY CHARGES
49.00 Respiratory Therapy $ $ $ 0
55.00 Med Supply Charged to Patients 0
56.00 Drugs Charged to Patients 0
0
0
0
0
0
0
0
0
0
0
0
0
0
0
0
0
0
0
0
0
0
0
0
0
0
0
0
0
0
0
0
0
0
0
0
0
0
0
0
TOTAL DP ANCILLARY CHARGES $ 0 $ 0 $ 0
(To DPNF Sch 3)
ADJUSTMENTS TO TOTAL
DISTINCT PART ANCILLARY CHARGES
REPORTED ADJUSTMENTS AUDITED
(Adj )
This is trial version
www.adultpdf.com
STATE OF CALIFORNIA DPNF SCH 5
Provider Name: Fiscal Period Ended:
SAN FRANCISCO GENERAL HOSPITAL JUNE 30, 2009
Provider No:
LTC55660F
RELATED * EMP BENEFITS *
COL. COST CENTER (COL 1) (COL 2)
1.00 Old Cap Rel Cost - Buildings and Fixtures $ 0 $ N/A
1.01 Old Cap Rel Cost - Building 2 0 N/A
1.02 Old Cap Rel Cost - Building 3 0 N/A
1.03 Old Cap Rel Cost - Building 5 4,305 N/A
1.05 Old Cap Rel Cost - Building 10 0 N/A
1.06 Old Cap Rel Cost - Building 20 0 N/A
1.07 Old Cap Rel Cost - Building 30 0 N/A
1.09 Old Cap Rel Cost - MRI Building 0 N/A
1.10 Old Cap Rel Cost - Building 80 0 N/A
1.11 Old Cap Rel Cost - Building 90 0 N/A
1.13 Old Cap Rel Cost - Land Improvements 0 N/A
2.00 Old Cap Rel Cost - Moveable Equipment 0 N/A
3.00 New Cap Rel Cost - Buildings and Fixtures 0 N/A
3.01 New Cap Rel Cost - Building 2 0 N/A
3.02 New Cap Rel Cost - Building 3 0 N/A
3.03 New Cap Rel Cost - Building 5 186,449 N/A
3.04 New Cap Rel Cost - Building 9 0 N/A
3.05 New Cap Rel Cost - Building 10 0 N/A
3.06 New Cap Rel Cost - Building 20 0 N/A
3.07 New Cap Rel Cost - Building 30 0 N/A
3.08 New Cap Rel Cost - Building 40 0 N/A
3.09 New Cap Rel Cost - MRI Building 0 N/A
3.10 New Cap Rel Cost - Building 80 0 N/A
3.11 New Cap Rel Cost - Building 90 0 N/A
3.12 New Cap Rel Cost - Building 100 0 N/A
3.13 New Cap Rel Costs - Land Imp 9,298 N/A
3.14 New Cap Rel Costs - MHRF 30,495 N/A
4.00 New Cap Rel Costs - Moveable Equipment 0 N/A
4.01 New Cap Rel Costs - Moveable Equipment 0 N/A
5.00 Employee Benefits 3,195 297,062
6.00 Administrative and General 771,145 834,986
7.00 Maintenance and Repairs 125,064 168,827
8.00 Operation of Plant 155,243 196,179
9.00 Laundry and Linen Service 14,677 35,524
10.00 Housekeeping 59,394 502,831
10.01 Housekeeping 0 0
11.00 Dietary 610,864 795,700
12.00 Cafeteria 33,869 43,312
14.00 Nursing Administration 152,136 780,169
15.00 Central Services and Supply 1,678 4,903
16.00 Pharmacy 297 1,108
17.00 Medical Records and Library 30,818 139,223
18.00 Social Service 41,113 139,223
22.00 Intern and Res Services - Salary and Fringes 0 0
101 TOTAL ALLOCATED INDIRECT EXPENSES $ 2,230,042 $ 3,939,048
* These amounts include Skilled Nursing Facility (To DPNF SCH 1)
expenses, line 34.
AUDITED CAP AUDITED SAL &
ALLOCATION OF INDIRECT EXPENSES
DISTINCT PART NURSING FACILITY
This is trial version
www.adultpdf.com
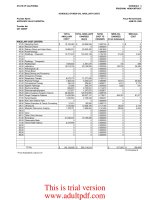
STATE OF CALIFORNIA COMPUTATION OF COST ALLOCATION (W/S B) SCHEDULE 8
Provider Name: Fiscal Period Ended: JUNE 30, 2009
SAN FRANCISCO GENERAL HOSPITAL
NET EXP FOR OLD CAP OLD CAP OLD CAP OLD CAP OLD CAP OLD CAP OLD CAP OLD CAP OLD CAP OLD CAP OLD CAP
TRIAL BALANCE COST ALLOC BLDG & COSTS COSTS COSTS COSTS COSTS COSTS COSTS COSTS COSTS COSTS
EXPENSES (From Sch 10) FIXTURES BLDG 2 BLDG 3 BLDG 5 BLDG 10 BLDG 20 BLDG 30 BLDG MRI BLDG 80 BLDG 90 LAND IM
0.00 1.00 1.01 1.02 1.03 1.05 1.06 1.07 1.09 1.10 1.11 1.13
GENERAL SERVICE COST CENTER
1.00
Old Cap Rel Cost - Buildings and Fixtures
0
1.01
Old Cap Rel Cost - Building 2
56,715
0
1.02
Old Cap Rel Cost - Building 3
0
0
0
1.03
Old Cap Rel Cost - Building 5
287,858
0
0
0
1.05
Old Cap Rel Cost - Building 10
448
0
0
0
0
1.06
Old Cap Rel Cost - Building 20
0
0
0
0
0
0
1.07Old Cap Rel Cost - Building 30 0000000
1.09
Old Cap Rel Cost - MRI Building
0
0
0
0
0
0
0
0
1.10
Old Cap Rel Cost - Building 80
0
0
0
0
0
0
0
0
0
1.11
Old Cap Rel Cost - Building 90
0
0
0
0
0
0
0
0
0
0
1.13
Old Cap Rel Cost - Land Improvements
0
0
0
0
0
0
0
0
0
0
0
2.00
Old Cap Rel Cost - Moveable Equipment
0
0
0
0
0
0
0
0
0
0
0
0
3.00
New Cap Rel Cost - Buildings and Fixtures
6,319
0
0
0
0
0
0
0
0
0
0
0
3.01
New Cap Rel Cost - Building 2
21,223
0
0
0
0
0
0
0
0
0
0
0
3.02
New Cap Rel Cost - Building 3
15,587
0
0
0
0
0
0
0
0
0
0
0
3.03
New Cap Rel Cost - Building 5
1,862,470
0
0
0
0
0
0
0
0
0
0
0
3.04
New Cap Rel Cost - Building 9
7,617
0
0
0
0
0
0
0
0
0
0
0
3.05
New Cap Rel Cost - Building 10
21,950
0
0
0
0
0
0
0
0
0
0
0
3.06
New Cap Rel Cost - Building 20
61,016
0
0
0
0
0
0
0
0
0
0
0
3.07
New Cap Rel Cost - Building 30
12,374
0
0
0
0
0
0
0
0
0
0
0
3.08
New Cap Rel Cost - Building 40
390
0
0
0
0
0
0
0
0
0
0
0
3.09
New Cap Rel Cost - MRI Building
0
0
0
0
0
0
0
0
0
0
0
0
3.10
New Cap Rel Cost - Building 80
13,692
0
0
0
0
0
0
0
0
0
0
0
3.11
New Cap Rel Cost - Building 90
25,675
0
0
0
0
0
0
0
0
0
0
0
3.12
New Cap Rel Cost - Building 100
129,031
0
0
0
0
0
0
0
0
0
0
0
3.13
New Cap Rel Costs - Land Imp
17,581
0
0
0
0
0
0
0
0
0
0
0
3.14
New Cap Rel Costs - MHRF
1,083,165
0
0
0
0
0
0
0
0
0
0
0
4.00 New Cap Rel Costs - Moveable Equipment 3,119,047 00000000000
4.01
New Cap Rel Costs - Moveable Equipment
0
0
0
0
0
0
0
0
0
0
0
0
5.00 Employee Benefits 8,968,395 00000000000
6.00
Administrative and General
85,091,361
0
3,395
0
86,301
167
0
0
0
0
0
0
7.00
Maintenance and Repairs
17,309,415
0
0
0
484
0
0
0
0
0
0
0
8.00
Operation of Plant
12,933,989
0
20,326
0
7,332
120
0
0
0
0
0
0
9.00 Laundry and Linen Service 2,202,501 0 32,281 0 307 3 0 00000
10.00 Housekeeping 12,976,153 0 712 0 4,932 0 0 00000
10.01 Housekeeping 0 00000000000
11.00 Dietary 5,103,379 0 0 0 9,436 0 0 00000
12.00 Cafeteria 930,280 0 0 0 3,550 0 0 00000
14.00 Nursing Administration 12,922,527 0 0 0 2,969 0 0 00000
15.00 Central Services and Supply 2,980,684 0 0 0 4,456 0 0 00000
16.00
Pharmacy
16,482,898
0
0
0
2,048
0
0
0
0
0
0
0
17.00
Medical Records and Library
6,882,411
0
0
0
4,805
0
0
0
0
0
0
0
18.00 Social Service 4,750,593 0 0 0 1,208 0 0 00000
22.00 Intern and Res Services - Salary and Fringes 23,660,682 0 0 0 4,674 0 0 00000
INPATIENT ROUTINE COST CENTER
25.00
Adults and Pediatrics
77,180,294
0
0
0
58,353
0
0
0
0
0
0
0
26.00 Intensive Care Unit 13,148,827 0 0 0 3,867 0 0 00000
27.00 Coronary Care Unit 10,046,756 0 0 0 2,285 0 0 00000
28.00 Subprovider I 0 00000000000
29.00
Subprovider II
0
0
0
0
0
0
0
0
0
0
0
0
30.00
NICU
1,289,344
0
0
0
2,991
0
0
0
0
0
0
0
33.00 Nursery 4,669,700 0 0 0 208 0 0 00000
34.00 Medicare Certified Nursing Facility 11,400,867 0 0 0 4,305 0 0 00000
35.00 Distinct Part Nursing Facility 0 00000000000
36.00 000000000000
36.01 Subacute Care Unit 0 00000000000
36.02 Transitional Care Unit 0 00000000000
This is trial version
www.adultpdf.com
STATE OF CALIFORNIA COMPUTATION OF COST ALLOCATION (W/S B) SCHEDULE 8
Provider Name: Fiscal Period Ended: JUNE 30, 2009
SAN FRANCISCO GENERAL HOSPITAL
NET EXP FOR OLD CAP OLD CAP OLD CAP OLD CAP OLD CAP OLD CAP OLD CAP OLD CAP OLD CAP OLD CAP OLD CAP
TRIAL BALANCE COST ALLOC BLDG & COSTS COSTS COSTS COSTS COSTS COSTS COSTS COSTS COSTS COSTS
EXPENSES (From Sch 10) FIXTURES BLDG 2 BLDG 3 BLDG 5 BLDG 10 BLDG 20 BLDG 30 BLDG MRI BLDG 80 BLDG 90 LAND IM
0.00 1.00 1.01 1.02 1.03 1.05 1.06 1.07 1.09 1.10 1.11 1.13
ANCILLARY COST CENTERS
37.00 Operating Room 26,579,132 0 0 0 10,910 0 0 00000
39.00
Delivery Room and Labor Room
4,872,312
0
0
0
2,532
0
0
0
0
0
0
0
40.00
Anesthesiology
5,065,914
0
0
0
2,626
0
0
0
0
0
0
0
41.00 Radiology - Diagnostic 21,981,929 0 0 0 15,059 0 0 00000
43.00
Radioisotope
0
0
0
0
0
0
0
0
0
0
0
0
44.00 Laboratory 22,023,732 0 0 0 7,994 0 0 00000
44.01 Laboratory Pathology 1,514,413 0 0 0 73 0 0 00000
46.00
Whole Blood
3,118,600
0
0
0
0
0
0
0
0
0
0
0
49.00
Respiratory Therapy
4,542,991
0
0
0
890
0
0
0
0
0
0
0
50.00
Physical Therapy
5,410,441
0
0
0
3,009
0
0
0
0
0
0
0
51.00 Occupational Therapy 788,281 0 0 0 335 0 0 00000
53.00 Electrocardiology 3,307,680 0 0 0 3,498 0 0 00000
54.00 Electroencephalography 156,431 0 0 0 91 0 0 00000
55.00
Medical Supplies Charged to Patients
2,531,288
0
0
0
100
0
0
0
0
0
0
0
55.01
Implantable Devices
4,306,295
0
0
0
0
0
0
0
0
0
0
0
56.00 Drugs Charged to Patients 16,005,805 0 0 0 1,029 0 0 00000
57.00 Renal Dialysis 2,730,310 0 0 0 78 0 0 00000
59.00 Other Ancillary Services 2,019,371 0 0 0 3,743 0 0 00000
59.01 000000000000
59.02 000000000000
59.03 000000000000
59.04 000000000000
59.05
0
0
0
0
0
0
0
0
0
0
0
0
59.06
0
0
0
0
0
0
0
0
0
0
0
0
59.07 000000000000
59.08 000000000000
59.09 000000000000
59.10 000000000000
60.00 Clinic 8,061,135 0 0 0 7,174 2 0 00000
61.00
Emergency
21,613,232
0
0
0
5,293
0
0
0
0
0
0
0
61.01
Psych Emergency
6,446,708
0
0
0
880
0
0
0
0
0
0
0
62.00Observation Beds 000000000000
63.60 Adult Medical Center FQHC I 19,433,777 0 0 0 2,654 0 0 00000
63.61 Women's Health Center FQHC II 7,174,882 0 0 0 3,855 0 0 00000
63.62 Family Health Center FQHC III 6,948,684 0 0 0 285 0 0 00000
63.63 Children's Health Center FQHC IV 4,406,573 0 0 0 4,286 0 0 00000
63.64
Urgent Care FQHC V
2,491,741
0
0
0
737
0
0
0
0
0
0
0
64.00
Home Program Dialysis
463,760
0
0
0
0
0
0
0
0
0
0
0
NONREIMBURSABLE COST CENTERS
96.00 Gift, Flower, Coffee Shop and Canteen 0 00000000000
96.01 Other Than Hospital 30,964,446 0 0 0 6,214 157 0 00000
98.00 000000000000
99.00 000000000000
99.01
0
0
0
0
0
0
0
0
0
0
0
0
99.02
0
0
0
0
0
0
0
0
0
0
0
0
99.03 000000000000
99.04 000000000000
99.05 000000000000
99.06 000000000000
99.07 000000000000
99.08
0
0
0
0
0
0
0
0
0
0
0
0
99.09
0
0
0
0
0
0
0
0
0
0
0
0
99.10 000000000000
TOTAL 572,633,077
0 56,715 0 287,858 448 0 0 0 0 0 0
This is trial version
www.adultpdf.com
STATE OF CALIFORNIA
Provider Name:
SAN FRANCISCO GENERAL HOSPITAL
TRIAL BALANCE
EXPENSES
GENERAL SERVICE COST CENTER
1.00
Old Cap Rel Cost - Buildings and Fixtures
1.01
Old Cap Rel Cost - Building 2
1.02
Old Cap Rel Cost - Building 3
1.03
Old Cap Rel Cost - Building 5
1.05
Old Cap Rel Cost - Building 10
1.06
Old Cap Rel Cost - Building 20
1.07 Old Cap Rel Cost - Building 30
1.09
Old Cap Rel Cost - MRI Building
1.10
Old Cap Rel Cost - Building 80
1.11
Old Cap Rel Cost - Building 90
1.13
Old Cap Rel Cost - Land Improvements
2.00
Old Cap Rel Cost - Moveable Equipment
3.00
New Cap Rel Cost - Buildings and Fixtures
3.01
New Cap Rel Cost - Building 2
3.02
New Cap Rel Cost - Building 3
3.03
New Cap Rel Cost - Building 5
3.04
New Cap Rel Cost - Building 9
3.05
New Cap Rel Cost - Building 10
3.06
New Cap Rel Cost - Building 20
3.07
New Cap Rel Cost - Building 30
3.08
New Cap Rel Cost - Building 40
3.09
New Cap Rel Cost - MRI Building
3.10
New Cap Rel Cost - Building 80
3.11
New Cap Rel Cost - Building 90
3.12
New Cap Rel Cost - Building 100
3.13
New Cap Rel Costs - Land Imp
3.14
New Cap Rel Costs - MHRF
4.00 New Cap Rel Costs - Moveable Equipment
4.01
New Cap Rel Costs - Moveable Equipment
5.00 Employee Benefits
6.00
Administrative and General
7.00
Maintenance and Repairs
8.00
Operation of Plant
9.00 Laundry and Linen Service
10.00 Housekeeping
10.01 Housekeeping
11.00 Dietary
12.00 Cafeteria
14.00 Nursing Administration
15.00 Central Services and Supply
16.00
Pharmacy
17.00
Medical Records and Library
18.00 Social Service
22.00 Intern and Res Services - Salary and Fringes
INPATIENT ROUTINE COST CENTER
25.00
Adults and Pediatrics
26.00 Intensive Care Unit
27.00 Coronary Care Unit
28.00 Subprovider I
29.00
Subprovider II
30.00
NICU
33.00 Nursery
34.00 Medicare Certified Nursing Facility
35.00 Distinct Part Nursing Facility
36.00
36.01 Subacute Care Unit
36.02 Transitional Care Unit
COMPUTATION OF COST ALLOCATION (W/S B) SCHEDULE 8.1
Fiscal Period Ended: JUNE 30, 2009
OLD CAP NEW CAP NEW CAP NEW CAP NEW CAP NEW CAP NEW CAP NEW CAP NEW CAP NEW CAP NEW CAP NEW CAP
COSTS COSTS COSTS COSTS COSTS COSTS COSTS COSTS COSTS COSTS COSTS COSTS
MVBLE EQ BLDG & FIX BLDG 2 BLDG 3 BLDG 5 BLDG 9 BLDG 10 BLDG 20 BLDG 30 BLDG 40 BLDG MRI BLDG 80
2.00 3.00 3.01 3.02 3.03 3.04 3.05 3.06 3.07 3.08 3.09 3.10
0
0
0
0
0
0
0
0
0
0
0
0
0
0
0
0
0
0
0
0
0
0
0
0
0
0
0
0
0
0
0
0
0
0
0
0
0
0
0
0
0
0
0
0
0
0
0
0
0
0
0
0
0
0
0
0
0
0
0
0
0
0
0
0
0
0
0
0
0
0
0
0
0
0
0
0
0
0
0
0
0
0
0
0
0
0
0
0
0
0
0
0
0
0
0
0
0
0
0
0
0
0
0
0
0
0
0
0
0
0
0
0
0
0
000000000000
0
0
0
0
0
0
0
0
0
0
0
0
000001,168000000
0
378
1,271
387
558,375
732
8,178
38,602
2,505
28
0
1,329
0
0
0
0
3,134
0
0
0
0
0
0
0
0
392
7,606
400
47,436
1,459
5,895
10,247
733
2
0
166
0 0 12,080 0 1,988 0 125 0 0 0 0 0
0 0 267 0 31,913 4 0 43 412 2 0 20
000000000000
000061,0530000000
000022,9720000000
000019,21000063000
000028,8330000000
0
0
0
0
13,249
0
0
0
0
0
0
0
0
0
0
0
31,089
0
0
0
3,762
0
0
0
00007,8190000000
000030,2390000000
0
806
0
0
377,547
0
0
0
0
0
0
0
000025,0230000000
000014,7810000000
000000000000
0
0
0
0
0
0
0
0
0
0
0
0
0
0
0
0
19,352
0
0
0
0
0
0
0
00001,3480000000
000027,8550000000
000000000000
000000000000
000000000000
000000000000
This is trial version
www.adultpdf.com
STATE OF CALIFORNIA
Provider Name:
SAN FRANCISCO GENERAL HOSPITAL
TRIAL BALANCE
EXPENSES
ANCILLARY COST CENTERS
37.00 Operating Room
39.00
Delivery Room and Labor Room
40.00
Anesthesiology
41.00 Radiology - Diagnostic
43.00
Radioisotope
44.00 Laboratory
44.01 Laboratory Pathology
46.00
Whole Blood
49.00
Respiratory Therapy
50.00
Physical Therapy
51.00 Occupational Therapy
53.00 Electrocardiology
54.00 Electroencephalography
55.00
Medical Supplies Charged to Patients
55.01
Implantable Devices
56.00 Drugs Charged to Patients
57.00 Renal Dialysis
59.00 Other Ancillary Services
59.01
59.02
59.03
59.04
59.05
59.06
59.07
59.08
59.09
59.10
60.00 Clinic
61.00
Emergency
61.01
Psych Emergency
62.00 Observation Beds
63.60 Adult Medical Center FQHC I
63.61 Women's Health Center FQHC II
63.62 Family Health Center FQHC III
63.63 Children's Health Center FQHC IV
63.64
Urgent Care FQHC V
64.00
Home Program Dialysis
NONREIMBURSABLE COST CENTERS
96.00 Gift, Flower, Coffee Shop and Canteen
96.01 Other Than Hospital
98.00
99.00
99.01
99.02
99.03
99.04
99.05
99.06
99.07
99.08
99.09
99.10
TOTAL
COMPUTATION OF COST ALLOCATION (W/S B) SCHEDULE 8.1
Fiscal Period Ended: JUNE 30, 2009
OLD CAP NEW CAP NEW CAP NEW CAP NEW CAP NEW CAP NEW CAP NEW CAP NEW CAP NEW CAP NEW CAP NEW CAP
COSTS COSTS COSTS COSTS COSTS COSTS COSTS COSTS COSTS COSTS COSTS COSTS
MVBLE EQ BLDG & FIX BLDG 2 BLDG 3 BLDG 5 BLDG 9 BLDG 10 BLDG 20 BLDG 30 BLDG 40 BLDG MRI BLDG 80
2.00 3.00 3.01 3.02 3.03 3.04 3.05 3.06 3.07 3.08 3.09 3.10
000070,5920000000
0
0
0
0
16,380
0
0
0
0
0
0
0
0
0
0
0
16,990
0
0
0
0
0
0
0
000097,4340000000
0
0
0
0
0
0
0
0
0
0
0
0
01260051,7200000000
0004,0884710000000
0
0
0
0
0
0
0
0
0
0
0
0
0
0
0
0
5,759
0
0
0
0
0
0
0
0
0
0
0
19,466
91
0
0
0
0
0
0
00002,1660000000
000022,6340000000
00005880000000
0
0
0
0
649
0
0
0
0
0
0
0
0
0
0
0
0
0
0
0
0
0
0
0
00006,6580000000
00005070000000
000024,2200000000
000000000000
000000000000
000000000000
000000000000
0
0
0
0
0
0
0
0
0
0
0
0
0
0
0
0
0
0
0
0
0
0
0
0
000000000000
000000000000
000000000000
000000000000
000046,4171,5398300003,582
0
0
0
0
34,245
0
0
0
0
0
0
0
0
0
0
0
5,692
0
0
0
0
0
0
0
000000000000
000017,1740000004,026
000024,944003740000
00001,8460000003,591
000027,7320011,751000978
0
0
0
0
4,766
0
0
0
0
0
0
0
0
0
0
0
0
0
0
0
0
0
0
0
000000000000
0 4,618 0 10,712 40,205 2,624 7,668 0 4,899 359 0 0
000000000000
000000000000
0
0
0
0
0
0
0
0
0
0
0
0
0
0
0
0
0
0
0
0
0
0
0
0
000000000000
000000000000
000000000000
000000000000
000000000000
0
0
0
0
0
0
0
0
0
0
0
0
0
0
0
0
0
0
0
0
0
0
0
0
000000000000
0
6,319 21,223 15,587 1,862,470 7,617 21,950 61,016 12,374 390 0 13,692
This is trial version
www.adultpdf.com