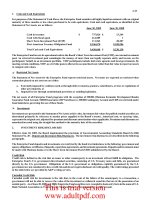
STATE OF CALIFORNIA SCHEDULE 4B PROGRAM: NONCONTRACT COMPUTATION OF MEDI-CAL INPATIENT ROUTINE SERVICE COST _part3 pptx
Bạn đang xem bản rút gọn của tài liệu. Xem và tải ngay bản đầy đủ của tài liệu tại đây (66.61 KB, 11 trang )
STATE OF CALIFORNIA
Provider Name:
SAN FRANCISCO GENERAL HOSPITAL
TRIAL BALANCE
EXPENSES
GENERAL SERVICE COST CENTER
1.00
Old Cap Rel Cost - Buildings and Fixtures
1.01
Old Cap Rel Cost - Building 2
1.02
Old Cap Rel Cost - Building 3
1.03
Old Cap Rel Cost - Building 5
1.05
Old Cap Rel Cost - Building 10
1.06
Old Cap Rel Cost - Building 20
1.07 Old Cap Rel Cost - Building 30
1.09
Old Cap Rel Cost - MRI Building
1.10
Old Cap Rel Cost - Building 80
1.11
Old Cap Rel Cost - Building 90
1.13
Old Cap Rel Cost - Land Improvements
2.00
Old Cap Rel Cost - Moveable Equipment
3.00
New Cap Rel Cost - Buildings and Fixtures
3.01
New Cap Rel Cost - Building 2
3.02
New Cap Rel Cost - Building 3
3.03
New Cap Rel Cost - Building 5
3.04
New Cap Rel Cost - Building 9
3.05
New Cap Rel Cost - Building 10
3.06
New Cap Rel Cost - Building 20
3.07
New Cap Rel Cost - Building 30
3.08
New Cap Rel Cost - Building 40
3.09
New Cap Rel Cost - MRI Building
3.10
New Cap Rel Cost - Building 80
3.11
New Cap Rel Cost - Building 90
3.12
New Cap Rel Cost - Building 100
3.13
New Cap Rel Costs - Land Imp
3.14
New Cap Rel Costs - MHRF
4.00 New Cap Rel Costs - Moveable Equipment
4.01
New Cap Rel Costs - Moveable Equipment
5.00 Employee Benefits
6.00
Administrative and General
7.00
Maintenance and Repairs
8.00
Operation of Plant
9.00 Laundry and Linen Service
10.00 Housekeeping
10.01 Housekeeping
11.00 Dietary
12.00 Cafeteria
14.00 Nursing Administration
15.00 Central Services and Supply
16.00
Pharmacy
17.00
Medical Records and Library
18.00 Social Service
22.00 Intern and Res Services - Salary and Fringes
INPATIENT ROUTINE COST CENTER
25.00
Adults and Pediatrics
26.00 Intensive Care Unit
27.00 Coronary Care Unit
28.00 Subprovider I
29.00
Subprovider II
30.00
NICU
33.00 Nursery
34.00 Medicare Certified Nursing Facility
35.00 Distinct Part Nursing Facility
36.00
36.01 Subacute Care Unit
36.02 Transitional Care Unit
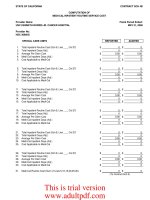
COMPUTATION OF COST ALLOCATION (W/S B) SCHEDULE 8.2
Fiscal Period Ended: JUNE 30, 2009
NEW CAP NEW CAP NEW CAP NEW CAP NEW CAP NEW CAP ADMINIS- OPERATIONS LAUNDRY &
COSTS COSTS COSTS COSTS COSTS COSTS EMPLOYEE ACCUM- TRATIVE & MAINT & OF LINEN
BLDG 90 BLDG 100 LAND IM MHRF LA
MVBLE EQUIP
MVBLE EQUIP
BENEFITS COST GENERAL REPAIRS PLANT SERVICE
3.11 3.12 3.13 3.14 4.00 4.01 5.00 6.00 7.00 8.00 9.00
0
0
0
0
0
0
0000
0
0
0
0
0
0 0 71 0 3,306 0
532
26,713
3,794
50,143
849,603
0
1,118,220
87,842,015
0
0
15
1,446
57,307
0
85,824
17,457,626
3,163,245
2,471
6,834
1,062
31,164
59,898
0
94,858
13,232,390
2,397,651
1,599,073
0 0 300 0 0 0 16,248 2,265,833 410,559 450,973 408,471
977 0 212 13,456 0 0 297,427 13,326,530 2,414,709 318,887 288,834 3,173
000000000000
0 0 264 0 75,348 0 109,853 5,359,334 971,088 397,632 360,157 0
0 0 99 0 22,233 0 32,414 1,011,548 183,288 149,610 135,511 0
0 0 87 0 34,811 0 320,354 13,300,020 2,409,905 130,415 118,125 0
0 0 125 0 8,478 0 56,955 3,079,531 557,998 187,784 170,087 0
0
0
57
0
62,013
0
337,916
16,898,181
3,061,876
86,289
78,157
0
0
0
347
0
10,472
0
147,012
7,079,899
1,282,847
521,544
472,392
0
0 0 34 0 0 0 98,250 4,857,905 880,231 50,925 46,125 0
0 0 131 0 14,635 0 389,617 24,099,976 4,366,810 196,940 178,379 0
0
0
1,751
0
125,255
0
1,979,361
79,723,366
14,445,524
2,635,226
2,386,872
1,875,800
0 0 108 0 101,885 0 292,592 13,572,302 2,459,242 162,970 147,611 186,930
0 0 64 0 12,093 0 240,638 10,316,616 1,869,326 96,269 87,197 65,388
000000000000
0
0
0
0
0
0
0
0
0
0
0
0
0
0
84
0
35,613
0
32,828
1,380,211
250,088
126,034
114,156
11,300
0 0 6 0 125,071 0 115,290 4,911,624 889,965 8,782 7,954 39,685
0 0 616 415,512 0 0 297,213 12,146,368 2,200,869 926,406 839,098 153,614
000000000000
000000000000
000000000000
000000000000
This is trial version
www.adultpdf.com
STATE OF CALIFORNIA
Provider Name:
SAN FRANCISCO GENERAL HOSPITAL
TRIAL BALANCE
EXPENSES
ANCILLARY COST CENTERS
37.00 Operating Room
39.00
Delivery Room and Labor Room
40.00
Anesthesiology
41.00 Radiology - Diagnostic
43.00
Radioisotope
44.00 Laboratory
44.01 Laboratory Pathology
46.00
Whole Blood
49.00
Respiratory Therapy
50.00
Physical Therapy
51.00 Occupational Therapy
53.00 Electrocardiology
54.00 Electroencephalography
55.00
Medical Supplies Charged to Patients
55.01
Implantable Devices
56.00 Drugs Charged to Patients
57.00 Renal Dialysis
59.00 Other Ancillary Services
59.01
59.02
59.03
59.04
59.05
59.06
59.07
59.08
59.09
59.10
60.00 Clinic
61.00
Emergency
61.01
Psych Emergency
62.00 Observation Beds
63.60 Adult Medical Center FQHC I
63.61 Women's Health Center FQHC II
63.62 Family Health Center FQHC III
63.63 Children's Health Center FQHC IV
63.64
Urgent Care FQHC V
64.00
Home Program Dialysis
NONREIMBURSABLE COST CENTERS
96.00 Gift, Flower, Coffee Shop and Canteen
96.01 Other Than Hospital
98.00
99.00
99.01
99.02
99.03
99.04
99.05
99.06
99.07
99.08
99.09
99.10
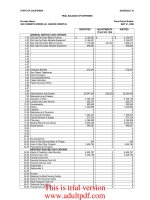
TOTAL
COMPUTATION OF COST ALLOCATION (W/S B) SCHEDULE 8.2
Fiscal Period Ended: JUNE 30, 2009
NEW CAP NEW CAP NEW CAP NEW CAP NEW CAP NEW CAP ADMINIS- OPERATIONS LAUNDRY &
COSTS COSTS COSTS COSTS COSTS COSTS EMPLOYEE ACCUM- TRATIVE & MAINT & OF LINEN
BLDG 90 BLDG 100 LAND IM MHRF LA
MVBLE EQUIP
MVBLE EQUIP
BENEFITS COST GENERAL REPAIRS PLANT SERVICE
3.11 3.12 3.13 3.14 4.00 4.01 5.00 6.00 7.00 8.00 9.00
0 0 305 0 558,242 0 384,265 27,603,446 5,001,623 459,755 416,426 457,630
0
0
71
0
13,980
0
121,946
5,027,221
910,910
106,682
96,628
28,446
0
0
74
0
116,390
0
90,042
5,292,035
958,893
110,651
100,223
0
0 0 422 0 310,735 0 321,297 22,726,875 4,118,010 634,572 574,768 112,267
0
0
0
0
0
0
0
0
0
0
0
0
104 11,293 346 0 112,293 0 0 22,207,609 4,023,921 520,935 471,840 0
0 0 318 0 8,839 0 4,371 1,532,572 277,695 478,360 433,278 7,857
0
0
0
0
0
0
0
3,118,600
565,077
0
0
0
0
0
25
0
113,211
0
0
4,662,876
844,893
37,506
33,971
0
0
0
90
0
0
0
119,916
5,553,013
1,006,182
135,170
122,431
20,946
0 0 9 0 0 0 19,159 809,950 146,759 14,106 12,777 0
0 0 98 0 127,951 0 14,487 3,476,348 629,899 147,410 133,518 2,665
0 0 3 0 0 0 4,104 161,217 29,212 3,831 3,470 0
0
0
3
0
0
0
0
2,532,040
458,794
4,224
3,826
0
0
0
0
0
0
0
0
4,306,295
780,282
0
0
0
681 0 47 3,517 944 0 0 16,018,681 2,902,515 70,060 63,458 0
0 4,544 43 0 20,045 0 0 2,755,528 499,290 64,992 58,867 3,330
0 0 105 0 9,292 0 26,176 2,082,908 377,414 157,744 142,878 0
000000000000
000000000000
000000000000
000000000000
0
0
0
0
0
0
0
0
0
0
0
0
0
0
0
0
0
0
0
0
0
0
0
0
000000000000
000000000000
000000000000
000000000000
0 0 529 0 38,502 0 160,368 8,319,330 1,507,426 796,422 721,365 81,224
0
0
148
0
59,412
0
532,033
22,244,362
4,030,581
223,031
202,011
357,623
0
0
25
0
0
0
128,396
6,581,701
1,192,575
37,074
33,580
79,476
000000000000
4,048 0 432 0 0 0 198,035 19,660,146 3,562,332 508,950 460,985 0
0 0 108 0 2,369 0 135,804 7,342,337 1,330,399 162,459 147,149 0
1,380 0 376 0 0 0 110,332 7,066,493 1,280,418 565,749 512,431 0
0 0 182 0 0 0 79,542 4,531,045 821,006 274,446 248,581 0
0
0
0
0
0
0
73,844
2,571,088
465,870
141,300
127,983
0
0
0
0
0
0
0
0
463,760
84,031
0
0
0
000000000000
15,483 79,647 4,597 567,925 28,822 0 385,952 32,124,328 5,820,787 6,919,682 6,267,546 48,482
000000000000
000000000000
0
0
0
0
0
0
0
0
0
0
0
0
0
0
0
0
0
0
0
0
0
0
0
0
000000000000
000000000000
000000000000
000000000000
000000000000
0
0
0
0
0
0
0
0
0
0
0
0
0
0
0
0
0
0
0
0
0
0
0
0
000000000000
25,675
129,031 17,581 1,083,165 3,119,047 0 8,972,940 572,633,077 87,842,015 20,620,872 17,229,114 3,535,836
This is trial version
www.adultpdf.com
STATE OF CALIFORNIA
Provider Name:
SAN FRANCISCO GENERAL HOSPITAL
TRIAL BALANCE
EXPENSES
GENERAL SERVICE COST CENTER
1.00 Old Cap Rel Cost - Buildings and Fixtures
1.01 Old Cap Rel Cost - Building 2
1.02 Old Cap Rel Cost - Building 3
1.03 Old Cap Rel Cost - Building 5
1.05 Old Cap Rel Cost - Building 10
1.06 Old Cap Rel Cost - Building 20
1.07 Old Cap Rel Cost - Building 30
1.09 Old Cap Rel Cost - MRI Building
1.10 Old Cap Rel Cost - Building 80
1.11 Old Cap Rel Cost - Building 90
1.13 Old Cap Rel Cost - Land Improvements
2.00 Old Cap Rel Cost - Moveable Equipment
3.00 New Cap Rel Cost - Buildings and Fixtures
3.01 New Cap Rel Cost - Building 2
3.02 New Cap Rel Cost - Building 3
3.03 New Cap Rel Cost - Building 5
3.04 New Cap Rel Cost - Building 9
3.05 New Cap Rel Cost - Building 10
3.06 New Cap Rel Cost - Building 20
3.07 New Cap Rel Cost - Building 30
3.08 New Cap Rel Cost - Building 40
3.09 New Cap Rel Cost - MRI Building
3.10 New Cap Rel Cost - Building 80
3.11 New Cap Rel Cost - Building 90
3.12 New Cap Rel Cost - Building 100
3.13 New Cap Rel Costs - Land Imp
3.14 New Cap Rel Costs - MHRF
4.00 New Cap Rel Costs - Moveable Equipment
4.01 New Cap Rel Costs - Moveable Equipment
5.00 Employee Benefits
6.00 Administrative and General
7.00 Maintenance and Repairs
8.00 Operation of Plant
9.00 Laundry and Linen Service
10.00 Housekeeping
10.01 Housekeeping
11.00 Dietary
12.00 Cafeteria
14.00 Nursing Administration
15.00 Central Services and Supply
16.00 Pharmacy
17.00 Medical Records and Library
18.00 Social Service
22.00 Intern and Res Services - Salary and Fringes
INPATIENT ROUTINE COST CENTER
25.00 Adults and Pediatrics
26.00 Intensive Care Unit
27.00 Coronary Care Unit
28.00 Subprovider I
29.00 Subprovider II
30.00 NICU
33.00 Nursery
34.00 Medicare Certified Nursing Facility
35.00 Distinct Part Nursing Facility
36.00
36.01 Subacute Care Unit
36.02 Transitional Care Unit
COMPUTATION OF COST ALLOCATION (W/S B) SCHEDULE 8.3
Fiscal Period Ended: JUNE 30, 2009
POST
CENTRAL MED REC I&R SERV I&R SERV STEP-DOWN TOTAL
NURSING SERVICES & & SOCIAL SALARY & OTHER ADJUSTMENT COST
HOUSEKEEP DIETARY CAFETERIA ADMIN SUPPLY PHARMACY LIBRARY SERVICES BENEFITS PROGRAM
10.00 10.01 11.00 12.00 14.00 15.00 16.00 17.00 18.00 22.00 26.00 27.00
0
356,243 0
134,038 0 0
116,841 0 0 73,533
168,238 0 0 13,896 0
77,307 0 0 53,862 0 1,754
467,258 0 0 44,567 0 9,324 0
45,624 0 0 21,262 0 26,521 0 0
176,441 0 0 137,167 0 1,523000
2,360,931 0 3,870,166 386,201 6,722,342 98,005 30,231 2,575,026 1,545,510 5,742,041 124,397,241
146,007 0 37,080 40,688 954,129 50,658 24,178 269,687 161,864 0 18,213,346
86,249 0 23,356 32,062 753,767 11,408 10,666 191,045 114,664 0 13,658,014
0000000000 0
0000000000 0
112,916 0 0 4,270 99,773 3,583 360 29,498 17,704 0 2,149,895
7,868 0 0 14,984 350,430 6,293 1,266 103,595 62,177 0 6,404,622
829,978 0 1,475,411 59,457 1,184,375 9,775 1,977 254,963 153,027 0 20,235,317
0000000000 0
0000000000 0
0000000000 0
0000000000 0
This is trial version
www.adultpdf.com
STATE OF CALIFORNIA
Provider Name:
SAN FRANCISCO GENERAL HOSPITAL
TRIAL BALANCE
EXPENSES
ANCILLARY COST CENTERS
37.00 Operating Room
39.00
Delivery Room and Labor Room
40.00
Anesthesiology
41.00 Radiology - Diagnostic
43.00
Radioisotope
44.00 Laboratory
44.01 Laboratory Pathology
46.00
Whole Blood
49.00
Respiratory Therapy
50.00
Physical Therapy
51.00 Occupational Therapy
53.00 Electrocardiology
54.00 Electroencephalography
55.00
Medical Supplies Charged to Patients
55.01
Implantable Devices
56.00 Drugs Charged to Patients
57.00 Renal Dialysis
59.00 Other Ancillary Services
59.01
59.02
59.03
59.04
59.05
59.06
59.07
59.08
59.09
59.10
60.00 Clinic
61.00
Emergency
61.01
Psych Emergency
62.00 Observation Beds
63.60 Adult Medical Center FQHC I
63.61 Women's Health Center FQHC II
63.62 Family Health Center FQHC III
63.63 Children's Health Center FQHC IV
63.64
Urgent Care FQHC V
64.00
Home Program Dialysis
NONREIMBURSABLE COST CENTERS
96.00 Gift, Flower, Coffee Shop and Canteen
96.01 Other Than Hospital
98.00
99.00
99.01
99.02
99.03
99.04
99.05
99.06
99.07
99.08
99.09
99.10
TOTAL
COMPUTATION OF COST ALLOCATION (W/S B) SCHEDULE 8.3
Fiscal Period Ended: JUNE 30, 2009
POST
CENTRAL MED REC I&R SERV I&R SERV STEP-DOWN TOTAL
NURSING SERVICES & & SOCIAL SALARY & OTHER ADJUSTMENT COST
HOUSEKEEP DIETARY CAFETERIA ADMIN SUPPLY PHARMACY LIBRARY SERVICES BENEFITS PROGRAM
10.00 10.01 11.00 12.00 14.00 15.00 16.00 17.00 18.00 22.00 26.00 27.00
411,900 0 0 70,191 1,127,058 1,768,905 33,231 537,939 322,866 1,953,310 40,164,281
95,578
0
0
17,258
391,907
18,073
9,163
32,087
19,258
0
6,753,212
99,133
0
0
21,335
0
60,623
396,107
386,775
232,139
1,245,473
8,903,388
568,521 0 0 63,323 39,517 217,722 5,657 734,324 440,735 1,108,311 31,344,601
0
0
0
0
0
0
0
0
0
0
0
466,712 0 0 102,148 0 13,540 137 860,976 516,751 0 29,184,568
428,569 0 0 11,967 0 9,727 0 80,627 48,391 1,062,757 4,371,801
0
0
0
0
0
0
0
34,685
20,818
0
3,739,180
33,602
0
0
28,270
0
32,621
0
150,546
90,357
0
5,914,642
121,100
0
0
22,290
0
8,272
6
59,278
35,578
0
7,084,268
12,638 0 0 3,355 0 8,925 0 24,875 14,930 0 1,048,315
132,066 0 0 9,401 29,066 143,574 110,508 88,031 52,836 0 4,955,322
3,432 0 0 2,486 0 53 212 597 358 0 204,869
3,784
0
0
0
0
504,651
0
402,684
241,687
0
4,151,690
0
0
0
0
0
858,525
0
57,975
34,796
0
6,037,873
62,768 0 0 0 0 72,579 14,952,467 1,352,051 811,490 0 36,306,068
58,227 0 0 19,797 0 53,523 134 68,298 40,992 0 3,622,976
141,325 0 0 6,922 90,628 19,316 1,596 36,378 21,834 0 3,078,942
0000000000 0
0000000000 0
0000000000 0
0000000000 0
0
0
0
0
0
0
0
0
0
0
0
0
0
0
0
0
0
0
0
0
0
0
0000000000 0
0000000000 0
0000000000 0
0000000000 0
713,524 0 0 51,210 387,334 30,993 73,985 132,240 79,369 11,641,769 24,536,192
199,816
0
290,216
87,946
1,485,489
67,882
19,504
688,870
413,454
739,374
31,050,160
33,215
0
370,543
20,215
325,609
997
5,748
115,959
69,598
0
8,866,289
0000000000 0
455,975 0 0 63,236 453,632 20,509 3,227,087 294,817 176,947 1,509,535 30,394,153
145,549 0 0 22,456 378,027 12,792 418,221 90,638 54,400 1,176,642 11,281,068
506,862 0 0 34,774 194,157 8,675 84,346 96,326 57,814 1,381,384 11,789,429
245,880 0 0 12,226 218,651 2,987 75,441 68,640 41,197 1,000,934 7,541,033
126,592
0
0
10,966
199,056
2,965
671
47,735
28,650
595,705
4,318,580
0
0
0
0
0
0
0
10,667
6,403
0
564,861
0000000000 0
6,199,427 0 1,377,680 50,275 763,891 20,258 774,525 0 0 0 60,366,883
0000000000 0
0000000000 0
0
0
0
0
0
0
0
0
0
0
0
0
0
0
0
0
0
0
0
0
0
0
0000000000 0
0000000000 0
0000000000 0
0000000000 0
0000000000 0
0
0
0
0
0
0
0
0
0
0
0
0
0
0
0
0
0
0
0
0
0
0
0000000000 0
16,352,133
0 7,444,454 1,613,995 16,148,839 4,177,534 20,257,425 9,877,830 5,928,593 29,157,236 0 572,633,077
This is trial version
www.adultpdf.com
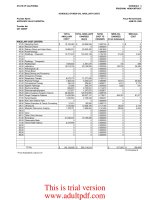
STATE OF CALIFORNIA STATISTICS FOR COST ALLOCATION (W/S B-1) Fiscal Period Ended: JUNE 30, 2009 SCHEDULE 9
Provider Name:
SAN FRANCISCO GENERAL HOSPITAL OLD CAP OLD CAP OLD CAP OLD CAP OLD CAP OLD CAP OLD CAP OLD CAP OLD CAP OLD CAP OLD CAP OLD CAP
BLDG & FIX BLDG 2 BLDG 3 BLDG 5 BLDG 10 BLDG 20 BLDG 30 MRI BLDG BLDG 80 BLDG 90 LAND IMP MVBLE EQP
(SQ FT) (SQ FT) (SQ FT) (SQ FT) (SQ FT) (SQ FT) (SQ FT) (SQ FT) (SQ FT) (SQ FT) (SQ FT) (SQ FT)
1.00 1.01 1.02 1.03 1.05 1.06 1.07 1.09 1.10 1.11 1.13 2.00
GENERAL SERVICE COST CENTERS
1.00 Old Cap Rel Cost - Buildings and Fixtures
1.01 Old Cap Rel Cost - Building 2
1.02 Old Cap Rel Cost - Building 3
1.03 Old Cap Rel Cost - Building 5
1.05 Old Cap Rel Cost - Building 10
1.06 Old Cap Rel Cost - Building 20
1.07 Old Cap Rel Cost - Building 30
1.09 Old Cap Rel Cost - MRI Building
1.10 Old Cap Rel Cost - Building 80
1.11 Old Cap Rel Cost - Building 90
1.13 Old Cap Rel Cost - Land Improvements
2.00 Old Cap Rel Cost - Moveable Equipment
3.00 New Cap Rel Cost - Buildings and Fixtures
3.01 New Cap Rel Cost - Building 2
3.02 New Cap Rel Cost - Building 3
3.03 New Cap Rel Cost - Building 5
3.04 New Cap Rel Cost - Building 9
3.05 New Cap Rel Cost - Building 10
3.06 New Cap Rel Cost - Building 20
3.07 New Cap Rel Cost - Building 30
3.08 New Cap Rel Cost - Building 40
3.09 New Cap Rel Cost - MRI Building
3.10 New Cap Rel Cost - Building 80
3.11 New Cap Rel Cost - Building 90
3.12 New Cap Rel Cost - Building 100
3.13 New Cap Rel Costs - Land Imp
3.14 New Cap Rel Costs - MHRF
4.00 New Cap Rel Costs - Moveable Equipment
4.01 New Cap Rel Costs - Moveable Equipment
5.00 Employee Benefits 5,453
6.00 Administrative and General 4,209 2,345 2,291 185,100 20,912 812 290,645
7.00 Maintenance and Repairs 1,039 1,171
8.00 Operation of Plant 4,362 14,038 2,366 15,725 15,074 3,768 81,391
9.00 Laundry and Linen Service 22,295 659 320 22,954
10.00 Housekeeping 492 10,579 1,490 16,231
10.01 Housekeeping
11.00 Dietary 20,239 20,239
12.00 Cafeteria 7,615 7,615
14.00 Nursing Administration 6,368 6,638
15.00 Central Services and Supply 9,558 9,558
16.00 Pharmacy 4,392 4,392
17.00 Medical Records and Library 10,306 26,546
18.00 Social Service 2,592 2,592
22.00 Intern and Res Services - Salary and Fringes 10,024 10,024
INPATIENT ROUTINE COST CENTER
25.00 Adults and Pediatrics 8,974 125,156 134,130
26.00 Intensive Care Unit 8,295 8,295
27.00 Coronary Care Unit 4,900 4,900
28.00 Subprovider I
29.00 Subprovider II
30.00 NICU 6,415 6,415
33.00 Nursery 447 447
34.00 Medicare Certified Nursing Facility 9,234 47,153
35.00 Distinct Part Nursing Facility
36.00
36.01 Subacute Care Unit
36.02 Transitional Care Unit
This is trial version
www.adultpdf.com
STATE OF CALIFORNIA STATISTICS FOR COST ALLOCATION (W/S B-1) Fiscal Period Ended: JUNE 30, 2009 SCHEDULE 9
Provider Name:
SAN FRANCISCO GENERAL HOSPITAL OLD CAP OLD CAP OLD CAP OLD CAP OLD CAP OLD CAP OLD CAP OLD CAP OLD CAP OLD CAP OLD CAP OLD CAP
BLDG & FIX BLDG 2 BLDG 3 BLDG 5 BLDG 10 BLDG 20 BLDG 30 MRI BLDG BLDG 80 BLDG 90 LAND IMP MVBLE EQP
(SQ FT) (SQ FT) (SQ FT) (SQ FT) (SQ FT) (SQ FT) (SQ FT) (SQ FT) (SQ FT) (SQ FT) (SQ FT) (SQ FT)
1.00 1.01 1.02 1.03 1.05 1.06 1.07 1.09 1.10 1.11 1.13 2.00
ANCILLARY COST CENTERS
37.00
Operating Room
23,401
23,401
39.00
Delivery Room and Labor Room
5,430
5,430
40.00
Anesthesiology
5,632
5,632
41.00
Radiology - Diagnostic
32,299
32,299
43.00
Radioisotope
44.00
Laboratory
1,408
17,145
159
26,515
44.01
Laboratory Pathology
24,192
156
24,348
46.00
Whole Blood
49.00
Respiratory Therapy
1,909
1,909
50.00
Physical Therapy
6,453
6,880
51.00
Occupational Therapy
718
718
53.00
Electrocardiology
7,503
7,503
54.00
Electroencephalography
195
195
55.00
Medical Supplies Charged to Patients
215
215
55.01
Implantable Devices
56.00
Drugs Charged to Patients
2,207
1,038
3,566
57.00
Renal Dialysis
168
3,308
59.00
Other Ancillary Services
8,029
8,029
59.01
59.02
59.03
59.04
59.05
59.06
59.07
59.08
59.09
59.10
60.00
Clinic
15,387
213
40,537
61.00
Emergency
11,352
11,352
61.01
Psych Emergency
1,887
1,887
62.00
Observation Beds
63.60
Adult Medical Center FQHC I
5,693
6,174
33,097
63.61
Women's Health Center FQHC II
8,269
8,269
63.62
Family Health Center FQHC III
612
2,104
28,796
63.63
Children's Health Center FQHC IV
9,193
13,969
63.64
Urgent Care FQHC V
1,580
64.00
Home Program Dialysis
NONREIMBURSABLE COST CENTERS
96.00
Gift, Flower, Coffee Shop and Canteen
96.01
Other Than Hospital
51,435
63,391
13,328
19,609
23,613
352,204
98.00
99.00
99.01
99.02
99.03
99.04
99.05
99.06
99.07
99.08
99.09
99.10
TOTAL 70,388 39,170 92,240 617,404 56,128000039,1581,346,848 0
COST TO BE ALLOCATED
0
56,715
0
287,858
448
0
0
0
0
0
0
0
UNIT COST MULTIPLIER - SCH 8
0.000000
1.447919
0.000000
0.466239
0.007982
0.000000
0.000000
0.000000
0.000000
0.000000
0.000000
0.000000
This is trial version
www.adultpdf.com
STATE OF CALIFORNIA
Provider Name:
SAN FRANCISCO GENERAL HOSPITAL
GENERAL SERVICE COST CENTERS
1.00 Old Cap Rel Cost - Buildings and Fixtures
1.01 Old Cap Rel Cost - Building 2
1.02 Old Cap Rel Cost - Building 3
1.03 Old Cap Rel Cost - Building 5
1.05 Old Cap Rel Cost - Building 10
1.06 Old Cap Rel Cost - Building 20
1.07 Old Cap Rel Cost - Building 30
1.09 Old Cap Rel Cost - MRI Building
1.10 Old Cap Rel Cost - Building 80
1.11 Old Cap Rel Cost - Building 90
1.13 Old Cap Rel Cost - Land Improvements
2.00 Old Cap Rel Cost - Moveable Equipment
3.00 New Cap Rel Cost - Buildings and Fixtures
3.01 New Cap Rel Cost - Building 2
3.02 New Cap Rel Cost - Building 3
3.03 New Cap Rel Cost - Building 5
3.04 New Cap Rel Cost - Building 9
3.05 New Cap Rel Cost - Building 10
3.06 New Cap Rel Cost - Building 20
3.07 New Cap Rel Cost - Building 30
3.08 New Cap Rel Cost - Building 40
3.09 New Cap Rel Cost - MRI Building
3.10 New Cap Rel Cost - Building 80
3.11 New Cap Rel Cost - Building 90
3.12 New Cap Rel Cost - Building 100
3.13 New Cap Rel Costs - Land Imp
3.14 New Cap Rel Costs - MHRF
4.00 New Cap Rel Costs - Moveable Equipment
4.01 New Cap Rel Costs - Moveable Equipment
5.00 Employee Benefits
6.00 Administrative and General
7.00 Maintenance and Repairs
8.00 Operation of Plant
9.00 Laundry and Linen Service
10.00 Housekeeping
10.01 Housekeeping
11.00 Dietary
12.00 Cafeteria
14.00 Nursing Administration
15.00 Central Services and Supply
16.00 Pharmacy
17.00 Medical Records and Library
18.00 Social Service
22.00 Intern and Res Services - Salary and Fringes
INPATIENT ROUTINE COST CENTER
25.00 Adults and Pediatrics
26.00 Intensive Care Unit
27.00 Coronary Care Unit
28.00 Subprovider I
29.00 Subprovider II
30.00 NICU
33.00 Nursery
34.00 Medicare Certified Nursing Facility
35.00 Distinct Part Nursing Facility
36.00
36.01 Subacute Care Unit
36.02 Transitional Care Unit
STATISTICS FOR COST ALLOCATION (W/S B-1) Fiscal Period Ended: JUNE 30, 2009 SCHEDULE 9.1
NEW CAP NEW CAP NEW CAP NEW CAP NEW CAP NEW CAP NEW CAP NEW CAP NEW CAP NEW CAP NEW CAP NEW CAP
BLDG FIXT BLDG 2 BLDG 3 BLDG 5 BLDG 9 BLDG 10 BLDG 20 BLDG 30 BLDG 40 BLDG MRI BLDG 80 BLDG 90
(SQ FT) (SQ FT) (SQ FT) (SQ FT) (SQ FT) (SQ FT) (SQ FT) (SQ FT) (SQ FT) (SQ FT) (SQ FT) (SQ FT)
3.00 3.01 3.02 3.03 3.04 3.05 3.06 3.07 3.08 3.09 3.10 3.11
5,453
4,209 2,345 2,291 185,100 3,418 20,912 28,100 10,813 3,124 6,487 812
1,039
4,362 14,038 2,366 15,725 6,812 15,074 7,459 3,166 243 812 3,768
22,295 659 320
492 10,579 19 31 1,779 195 98 1,490
20,239
7,615
6,368 270
9,558
4,392
10,306 16,240
2,592
10,024
8,974 125,156
8,295
4,900
6,415
447
9,234
This is trial version
www.adultpdf.com
STATE OF CALIFORNIA
Provider Name:
SAN FRANCISCO GENERAL HOSPITAL
ANCILLARY COST CENTERS
37.00
Operating Room
39.00
Delivery Room and Labor Room
40.00
Anesthesiology
41.00
Radiology - Diagnostic
43.00
Radioisotope
44.00
Laboratory
44.01
Laboratory Pathology
46.00
Whole Blood
49.00
Respiratory Therapy
50.00
Physical Therapy
51.00
Occupational Therapy
53.00
Electrocardiology
54.00
Electroencephalography
55.00
Medical Supplies Charged to Patients
55.01
Implantable Devices
56.00
Drugs Charged to Patients
57.00
Renal Dialysis
59.00
Other Ancillary Services
59.01
59.02
59.03
59.04
59.05
59.06
59.07
59.08
59.09
59.10
60.00
Clinic
61.00
Emergency
61.01
Psych Emergency
62.00
Observation Beds
63.60
Adult Medical Center FQHC I
63.61
Women's Health Center FQHC II
63.62
Family Health Center FQHC III
63.63
Children's Health Center FQHC IV
63.64
Urgent Care FQHC V
64.00
Home Program Dialysis
NONREIMBURSABLE COST CENTERS
96.00
Gift, Flower, Coffee Shop and Canteen
96.01
Other Than Hospital
98.00
99.00
99.01
99.02
99.03
99.04
99.05
99.06
99.07
99.08
99.09
99.10
TOTAL
COST TO BE ALLOCATED
UNIT COST MULTIPLIER - SCH 8
STATISTICS FOR COST ALLOCATION (W/S B-1) Fiscal Period Ended: JUNE 30, 2009 SCHEDULE 9.1
NEW CAP NEW CAP NEW CAP NEW CAP NEW CAP NEW CAP NEW CAP NEW CAP NEW CAP NEW CAP NEW CAP NEW CAP
BLDG FIXT BLDG 2 BLDG 3 BLDG 5 BLDG 9 BLDG 10 BLDG 20 BLDG 30 BLDG 40 BLDG MRI BLDG 80 BLDG 90
(SQ FT) (SQ FT) (SQ FT) (SQ FT) (SQ FT) (SQ FT) (SQ FT) (SQ FT) (SQ FT) (SQ FT) (SQ FT) (SQ FT)
3.00 3.01 3.02 3.03 3.04 3.05 3.06 3.07 3.08 3.09 3.10 3.11
23,401
5,430
5,632
32,299
1,408
17,145
159
24,192
156
1,909
6,453
427
718
7,503
195
215
2,207
1,038
168
8,029
15,387
7,183
213
17,482
11,352
1,887
5,693
19,650
6,174
8,269
272
612
17,526
2,104
9,193
8,554
4,776
1,580
51,435
63,391
13,328
12,248
19,609
21,148
40,570
23,613
70,388 39,170 92,240 617,404 35,560 56,128 44,416 53,416 44,132 0 66,831 39,158
6,319
21,223
15,587
1,862,470
7,617
21,950
61,016
12,374
390
0
13,692
25,675
0.089774
0.541818
0.168983
3.016615
0.214201
0.391070
1.373739
0.231653
0.008837
0.000000
0.204875
0.655677
This is trial version
www.adultpdf.com
STATE OF CALIFORNIA
Provider Name:
SAN FRANCISCO GENERAL HOSPITAL
GENERAL SERVICE COST CENTERS
1.00 Old Cap Rel Cost - Buildings and Fixtures
1.01 Old Cap Rel Cost - Building 2
1.02 Old Cap Rel Cost - Building 3
1.03 Old Cap Rel Cost - Building 5
1.05 Old Cap Rel Cost - Building 10
1.06 Old Cap Rel Cost - Building 20
1.07 Old Cap Rel Cost - Building 30
1.09 Old Cap Rel Cost - MRI Building
1.10 Old Cap Rel Cost - Building 80
1.11 Old Cap Rel Cost - Building 90
1.13 Old Cap Rel Cost - Land Improvements
2.00 Old Cap Rel Cost - Moveable Equipment
3.00 New Cap Rel Cost - Buildings and Fixtures
3.01 New Cap Rel Cost - Building 2
3.02 New Cap Rel Cost - Building 3
3.03 New Cap Rel Cost - Building 5
3.04 New Cap Rel Cost - Building 9
3.05 New Cap Rel Cost - Building 10
3.06 New Cap Rel Cost - Building 20
3.07 New Cap Rel Cost - Building 30
3.08 New Cap Rel Cost - Building 40
3.09 New Cap Rel Cost - MRI Building
3.10 New Cap Rel Cost - Building 80
3.11 New Cap Rel Cost - Building 90
3.12 New Cap Rel Cost - Building 100
3.13 New Cap Rel Costs - Land Imp
3.14 New Cap Rel Costs - MHRF
4.00 New Cap Rel Costs - Moveable Equipment
4.01 New Cap Rel Costs - Moveable Equipment
5.00 Employee Benefits
6.00 Administrative and General
7.00 Maintenance and Repairs
8.00 Operation of Plant
9.00 Laundry and Linen Service
10.00 Housekeeping
10.01 Housekeeping
11.00 Dietary
12.00 Cafeteria
14.00 Nursing Administration
15.00 Central Services and Supply
16.00 Pharmacy
17.00 Medical Records and Library
18.00 Social Service
22.00 Intern and Res Services - Salary and Fringes
INPATIENT ROUTINE COST CENTER
25.00 Adults and Pediatrics
26.00 Intensive Care Unit
27.00 Coronary Care Unit
28.00 Subprovider I
29.00 Subprovider II
30.00 NICU
33.00 Nursery
34.00 Medicare Certified Nursing Facility
35.00 Distinct Part Nursing Facility
36.00
36.01 Subacute Care Unit
36.02 Transitional Care Unit
STATISTICS FOR COST ALLOCATION (W/S/ B-1) Fiscal Period Ended: JUNE 30, 2009 SCHEDULE 9.2
NEW CAP NEW CAP NEW CAP NEW CAP NEW CAP EMP BENEFIT ADM & GEN MAINT & OPER LAUNDRY HOUSEKEEP
BLDG 100 LAND IMPRO MHRF MVBLE EQP MVBLE EQP (GROSS (ACCUM REPAIRS PLANT & LINEN
(SQ FT) (SQ FT) (SQ FT) (SQ FT) (SQ FT) SALARIES) COST) (SQ FT) (SQ FT) (LB LNDRY) (SQ FT)
3.12 3.13 3.14 4.00 4.01 5.00 7.00 8.00 9.00 10.00
(Adj 12 )
5,453 3,021
18,458 290,645 4,576 776,475 32,208,664 87,842,015
1,171 132 52,374 2,472,039 17,457,626
4,722 81,391 2,844 54,742 2,732,253 13,232,390 81,391
22,954 467,997 2,265,833 22,954 22,954
16,231 1,228 8,566,943 13,326,530 16,231 16,231 4,354
0
20,239 68,863 3,164,140 5,359,334 20,239 20,239 20,239
7,615 20,319 933,644 1,011,548 7,615 7,615 7,615
6,638 31,815 9,227,320 13,300,020 6,638 6,638 6,638
9,558 7,748 1,640,518 3,079,531 9,558 9,558 9,558
4,392 56,675 9,733,165 16,898,181 4,392 4,392 4,392
26,546 9,571 4,234,474 7,079,899 26,546 26,546 26,546
2,592 2,829,951 4,857,905 2,592 2,592 2,592
10,024 13,375 11,222,330 24,099,976 10,024 10,024 10,024
134,130 114,474 57,012,532 79,723,366 134,130 134,130 2,574,293 134,130
8,295 93,115 8,427,670 13,572,302 8,295 8,295 256,537 8,295
4,900 11,052 6,931,208 10,316,616 4,900 4,900 89,736 4,900
0
0
6,415 32,548 945,558 1,380,211 6,415 6,415 15,508 6,415
447 114,306 3,320,750 4,911,624 447 447 54,463 447
47,153 37,919 8,560,771 12,146,368 47,153 47,153 210,815 47,153
0
0
0
0
This is trial version
www.adultpdf.com
STATE OF CALIFORNIA
Provider Name:
SAN FRANCISCO GENERAL HOSPITAL
ANCILLARY COST CENTERS
37.00
Operating Room
39.00
Delivery Room and Labor Room
40.00
Anesthesiology
41.00
Radiology - Diagnostic
43.00
Radioisotope
44.00
Laboratory
44.01
Laboratory Pathology
46.00
Whole Blood
49.00
Respiratory Therapy
50.00
Physical Therapy
51.00
Occupational Therapy
53.00
Electrocardiology
54.00
Electroencephalography
55.00
Medical Supplies Charged to Patients
55.01
Implantable Devices
56.00
Drugs Charged to Patients
57.00
Renal Dialysis
59.00
Other Ancillary Services
59.01
59.02
59.03
59.04
59.05
59.06
59.07
59.08
59.09
59.10
60.00
Clinic
61.00
Emergency
61.01
Psych Emergency
62.00
Observation Beds
63.60
Adult Medical Center FQHC I
63.61
Women's Health Center FQHC II
63.62
Family Health Center FQHC III
63.63
Children's Health Center FQHC IV
63.64
Urgent Care FQHC V
64.00
Home Program Dialysis
NONREIMBURSABLE COST CENTERS
96.00
Gift, Flower, Coffee Shop and Canteen
96.01
Other Than Hospital
98.00
99.00
99.01
99.02
99.03
99.04
99.05
99.06
99.07
99.08
99.09
99.10
TOTAL
COST TO BE ALLOCATED
UNIT COST MULTIPLIER - SCH 8
STATISTICS FOR COST ALLOCATION (W/S/ B-1) Fiscal Period Ended: JUNE 30, 2009 SCHEDULE 9.2
NEW CAP NEW CAP NEW CAP NEW CAP NEW CAP EMP BENEFIT ADM & GEN MAINT & OPER LAUNDRY HOUSEKEEP
BLDG 100 LAND IMPRO MHRF MVBLE EQP MVBLE EQP (GROSS (ACCUM REPAIRS PLANT & LINEN
(SQ FT) (SQ FT) (SQ FT) (SQ FT) (SQ FT) SALARIES) COST) (SQ FT) (SQ FT) (LB LNDRY) (SQ FT)
3.12 3.13 3.14 4.00 4.01 5.00 7.00 8.00 9.00 10.00
(Adj 12 )
23,401
510,192
11,068,178
27,603,446
23,401
23,401
628,038
23,401
5,430
12,777
3,512,462
5,027,221
5,430
5,430
39,039
5,430
5,632
106,372
2,593,514
5,292,035
5,632
5,632
5,632
32,299
283,989
9,254,471
22,726,875
32,299
32,299
154,072
32,299
0
7,803
26,515
102,628
22,207,609
26,515
26,515
26,515
24,348
8,078
125,914
1,532,572
24,348
24,348
10,783
24,348
3,118,600
1,909
103,467
4,662,876
1,909
1,909
1,909
6,880
3,454,001
5,553,013
6,880
6,880
28,746
6,880
718
551,845
809,950
718
718
718
7,503
116,938
417,287
3,476,348
7,503
7,503
3,657
7,503
195
118,221
161,217
195
195
195
215
2,532,040
215
215
215
4,306,295
3,566
321
863
16,018,681
3,566
3,566
3,566
3,140
3,308
18,320
2,755,528
3,308
3,308
4,570
3,308
8,029
8,492
753,970
2,082,908
8,029
8,029
8,029
0
0
0
0
0
0
0
0
0
0
40,537
35,188
4,619,164
8,319,330
40,537
40,537
111,469
40,537
11,352
54,298
15,324,409
22,244,362
11,352
11,352
490,792
11,352
1,887
3,698,256
6,581,701
1,887
1,887
109,071
1,887
0
33,097
5,704,114
19,660,146
25,905
25,905
25,905
8,269
2,165
3,911,643
7,342,337
8,269
8,269
8,269
28,796
3,177,945
7,066,493
28,796
28,796
28,796
13,969
2,291,101
4,531,045
13,969
13,969
13,969
2,126,958
2,571,088
7,192
7,192
7,192
463,760
0
0
55,034
352,204
51,828
26,341
11,116,783
32,124,328
352,204
352,204
66,535
352,204
0
0
0
0
0
0
0
0
0
0
0
0
89,157 1,346,848 98,848 2,850,581 0 258,452,163 484,791,062 1,049,579 968,188 4,852,478 929,003
129,031
17,581
1,083,165
3,119,047
0
8,972,940
87,842,015
20,620,872
17,229,114
3,535,836
16,352,133
1.447234
0.013053
10.957885
1.094179
0.000000
0.034718
0.181196
19.646803
17.795216
0.728666
17.601808
This is trial version
www.adultpdf.com
STATE OF CALIFORNIA
Provider Name:
SAN FRANCISCO GENERAL HOSPITAL
GENERAL SERVICE COST CENTERS
1.00 Old Cap Rel Cost - Buildings and Fixtures
1.01 Old Cap Rel Cost - Building 2
1.02 Old Cap Rel Cost - Building 3
1.03 Old Cap Rel Cost - Building 5
1.05 Old Cap Rel Cost - Building 10
1.06 Old Cap Rel Cost - Building 20
1.07 Old Cap Rel Cost - Building 30
1.09 Old Cap Rel Cost - MRI Building
1.10 Old Cap Rel Cost - Building 80
1.11 Old Cap Rel Cost - Building 90
1.13 Old Cap Rel Cost - Land Improvements
2.00 Old Cap Rel Cost - Moveable Equipment
3.00 New Cap Rel Cost - Buildings and Fixtures
3.01 New Cap Rel Cost - Building 2
3.02 New Cap Rel Cost - Building 3
3.03 New Cap Rel Cost - Building 5
3.04 New Cap Rel Cost - Building 9
3.05 New Cap Rel Cost - Building 10
3.06 New Cap Rel Cost - Building 20
3.07 New Cap Rel Cost - Building 30
3.08 New Cap Rel Cost - Building 40
3.09 New Cap Rel Cost - MRI Building
3.10 New Cap Rel Cost - Building 80
3.11 New Cap Rel Cost - Building 90
3.12 New Cap Rel Cost - Building 100
3.13 New Cap Rel Costs - Land Imp
3.14 New Cap Rel Costs - MHRF
4.00 New Cap Rel Costs - Moveable Equipment
4.01 New Cap Rel Costs - Moveable Equipment
5.00 Employee Benefits
6.00 Administrative and General
7.00 Maintenance and Repairs
8.00 Operation of Plant
9.00 Laundry and Linen Service
10.00 Housekeeping
10.01 Housekeeping
11.00 Dietary
12.00 Cafeteria
14.00 Nursing Administration
15.00 Central Services and Supply
16.00 Pharmacy
17.00 Medical Records and Library
18.00 Social Service
22.00 Intern and Res Services - Salary and Fringes
INPATIENT ROUTINE COST CENTER
25.00 Adults and Pediatrics
26.00 Intensive Care Unit
27.00 Coronary Care Unit
28.00 Subprovider I
29.00 Subprovider II
30.00 NICU
33.00 Nursery
34.00 Medicare Certified Nursing Facility
35.00 Distinct Part Nursing Facility
36.00
36.01 Subacute Care Unit
36.02 Transitional Care Unit
STATISTICS FOR COST ALLOCATION (W/S B-1) Fiscal Period Ended: JUNE 30, 2009 SCHEDULE 9.3
HOUSEKEEP DIETARY CAFETERIA NURSING ADM CTRL SERV PHARMACY MED REC SOC SERV I&R-SAL
(MEALS (NURSING SUPPLIES (COSTS (GROSS (GROSS & FRINGES
(SQ FT) SERVED) (FTE) FTE) (COST REQ) REQUIS) CHARGES) CHARGES) (ASG TIME)
10.01 11.00 12.00 14.00 15.00 16.00 17.00 18.00 22.00
(Adj 13) (Adj 14) (Adjs 15, 16) (Adj 17) (Adj 18) (Adj 18) (Adj 19)
20,239
7,615
6,638 11,091
9,558 2,096
4,392 8,124 8,796
26,546 6,722 46,769
2,592 3,207 133,029
10,024 20,689 7,640
134,130 253,521 58,251 41,167 491,586 33,632 372,533,933 372,533,933 22,941
8,295 2,429 6,137 5,843 254,096 26,898 39,016,135 39,016,135
4,900 1,530 4,836 4,616 57,223 11,866 27,638,860 27,638,860
6,415 644 611 17,973 401 4,267,520 4,267,520
447 2,260 2,146 31,565 1,408 14,987,302 14,987,302
47,153 96,649 8,968 7,253 49,033 2,199 36,885,977 36,885,977
This is trial version
www.adultpdf.com