REPORT NO. 2011-059 DECEMBER 2010 UNIVERSITY OF SOUTH FLORIDA POLYTECHNIC A REGIONAL CAMPUS OF THE UNIVERSITY OF SOUTH FLORIDA Financial Audit_part1 potx
Bạn đang xem bản rút gọn của tài liệu. Xem và tải ngay bản đầy đủ của tài liệu tại đây (272.38 KB, 7 trang )
REPORT NO. 2011-059
D
ECEMBER 2010
UNIVERSITY OF SOUTH FLORIDA
POLYTECHNIC
A REGIONAL CAMPUS OF THE UNIVERSITY OF SOUTH FLORIDA
Financial Audit
For the Fiscal Year Ended
June 30, 2010
This is trial version
www.adultpdf.com
BOARD OF TRUSTEES AND PRESIDENT
During the audit period, the President of the University of South Florida was Dr. Judy L. Genshaft. The University of
South Florida Polytechnic Vice President and Campus Executive Officer was Dr. Marshall Goodman. The Board
members of the University of South Florida Polytechnic and the Board of the Trustee members of the University of
South Florida who served during the audit period are listed below:
Polytechnic Campus Board Members
Gene Engle, Chair
Michael E. Carter
Mark Kaylor from 10-27-09 (1)
Ron Morrow
Carole F. Philipson
University Board of Trustee Members
John B. Ramil, Vice Chair to 6-23-10, Chair from 6-24-10
Rhea F. Law, Chair to 6-23-10
Harold W. Mullis, Jr., from 1-06-10, Vice Chair from 6-24-10
Lee E. Arnold, Jr.
Dr. Laurence G. Branch (2)
Margarita R. Cancio, M.D.
Gene Engle
Sonja Garcia to 1-05-10 (3)
Cesar Hernandez from 5-04-10 (4)
Brian D. Lamb from 1-06-10
Kiran C. Patel, M.D., to 1-05-10 (3)
Debbie Nye Sembler
Byron E. Shinn from 3-09-10
Juan Soltero to 5-03-10 (4)
Robert L. Soran to 1-05-10
Jan E. Smith to 8-24-09 (5)
Sherrill Tomasino (6)
Jordan B. Zimmerman from 3-09-10
Notes: (1) Position remained vacant from July 1, 2009, to October 26, 2009.
(2) Faculty Senate chair.
(3) Positions remained vacant from January 6, 2010, to March 8, 2010.
(4) Student body president.
(5) Position remained vacant from August 25, 2009, to December 9, 2009.
(6) Board member resigned her position on December 10, 2009, to complete
J
an E. Smith's term. Her position was vacant from December 10, 2009,
to January 5, 2010, until Brian D. Lamb was appointed to the Board.
The Auditor General conducts audits of governmental entities to provide the Legislature, Florida’s citizens, public entity
management, and other stakeholders unbiased, timely, and relevant information for use in promoting government accountability
and stewardship and improving government operations.
The audit team leader was Rachel Sellers, CPA, and the audit was supervised by Karen J. Collington, CPA. Please address inquiries
regarding this report to James R. Stultz, CPA, Audit Manager, by e-mail at
or by telephone at
(850) 922-2263.
This report and other reports prepared by the Auditor General can be obtained on our Web site at www.myflorida.com/audgen
;
by telephone at (850) 487-9175; or by mail at G74 Claude Pepper Building, 111 West Madison Street, Tallahassee, Florida
32399-1450.
This is trial version
www.adultpdf.com
DECEMBER 2010 REPORT NO. 2011-059
UNIVERSITY OF SOUTH FLORIDA POLYTECHNIC
A REGIONAL CAMPUS OF THE UNIVERSITY OF SOUTH FLORIDA
TABLE OF CONTENTS
PAGE
NO.
EXECUTIVE SUMMARY i
INDEPENDENT AUDITOR’S REPORT ON FINANCIAL STATEMENTS 1
MANAGEMENT’S DISCUSSION AND ANALYSIS 3
BASIC FINANCIAL STATEMENTS
Statement of Net Assets 12
Statement of Revenues, Expenses, and Changes in Net Assets 14
Statement of Cash Flows 15
Notes to Financial Statements 17
OTHER REQUIRED SUPPLEMENTARY INFORMATION
Schedule of Funding Progress – Other Postemployment Benefits Plan 32
INDEPENDENT AUDITOR’S REPORT ON INTERNAL CONTROL OVER
FINANCIAL REPORTING AND ON COMPLIANCE AND OTHER MATTERS
BASED ON AN AUDIT OF THE FINANCIAL STATEMENTS PERFORMED
IN ACCORDANCE WITH
GOVERNMENT AUDITING STANDARDS
33
Internal Control Over Financial Reporting 33
Compliance and Other Matters 34
This is trial version
www.adultpdf.com
DECEMBER 2010 REPORT NO. 2011-059
2
As discussed in note 2 to the financial statements, the Regional Campus discontinued reporting bonds and revenue
certificates payable for State University System Capital Improvement Trust Fund Revenue Bonds on the Regional
Campus’s statement of net assets during the 2009-10 fiscal year. This change affects the comparability of amounts
reported for the 2009-10 fiscal year with amounts reported for the 2008-09 fiscal year.
In accordance with Government Auditing Standards, we have also issued our report on our consideration of the Regional
Campus’s internal control over financial reporting and on our tests of its compliance with certain provisions of laws,
rules, regulations, contracts, and grant agreements and other matters included under the heading INDEPENDENT
AUDITOR’S REPORT ON INTERNAL CONTROL OVER FINANCIAL REPORTING AND ON
COMPLIANCE AND OTHER MATTERS BASED ON AN AUDIT OF THE FINANCIAL
STATEMENTS PERFORMED IN ACCORDANCE WITH
GOVERNMENT AUDITING STANDARDS
.
The purpose of that report is to describe the scope of our testing of internal control over financial reporting and
compliance and results of that testing, and not to provide an opinion on the internal control over financial reporting
or on compliance. That report is an integral part of an audit performed in accordance with Government Auditing
Standards and should be considered in assessing the results of our audit.
Accounting principles generally accepted in the United States of America require that MANAGEMENT’S
DISCUSSION AND ANALYSIS on pages 3 through 11 and OTHER REQUIRED SUPPLEMENTARY
INFORMATION on page 32 be presented to supplement the basic financial statements. Such information,
although not a required part of the basic financial statements, is required by the Governmental Accounting Standards
Board who considers it to be an essential part of financial reporting for placing the basic financial statements in an
appropriate operational, economic, or historical context. We have applied certain limited procedures to the required
supplementary information in accordance with auditing standards generally accepted in the United States of America,
which consisted of inquiries of management about the methods of preparing the information and comparing the
information for consistency with management’s responses to our inquiries, the basic financial statements, and other
knowledge we obtained during our audit of the basic financial statements. We do not express an opinion or provide
any assurance on the information because the limited procedures do not provide us with sufficient evidence to
express an opinion or provide any assurance.
Respectfully submitted,
David W. Martin, CPA
December 6, 2010
This is trial version
www.adultpdf.com
DECEMBER 2010 REPORT NO. 2011-059
4
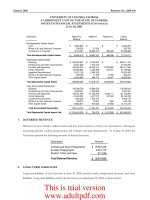
The following summarizes the Regional Campus’s assets, liabilities, and net assets at June 30:
Condensed Statement of Net Assets at June 30
(In Thousands)
2010 2009
Assets
Current Assets 41,181$ 26,328$
Capital Assets, Net 35,899 34,321
Other Noncurrent Assets 297 1,003
Total Assets
77,377 61,652
Liabilities
Current Liabilities 1,119 582
Noncurrent Liabilities 1,120 1,333
Total Liabilities
2,239 1,915
Net Assets
Invested in Capital Assets,
Net of Related Debt 35,899 34,035
Restricted 27,311 18,488
Unrestricted 11,928 7,214
Total Net Assets
75,138$ 59,737$
Assets are what the Regional Campus owns and are measured in current value, except for property and equipment,
which are recorded at historical cost less accumulated depreciation. Liabilities are generally considered to be financial
obligations of the Regional Campus and may also consist of payments received for services not yet provided (deferred
revenue). Both assets and liabilities are classified as either current or noncurrent. This classification is made based on
when an asset is expected to be converted to cash or a liability is expected to be paid off. If either of these situations
is expected to take place within the upcoming year, then the asset or liability is considered to be current.
The Regional Campus’s assets totaled $77.4 million at June 30, 2010. This balance reflects a $15.7 million, or
25.5 percent, increase over the 2008-09 fiscal year. This increase is attributable to an increase in current assets of
$14.9 million primarily from additional construction funding due from the State, an increase in capital assets of
$1.6 million due primarily to construction in process on new buildings, and a decrease in other noncurrent assets of
$0.7 million due primarily to a decrease in investments and cash utilized in the construction fund.
Total liabilities increased by $0.3 million, which was primarily due to an increase in current liabilities of $0.5 million
from construction contracts payable and salaries and wages payable, offset by a reduction in bonds payable (prior
period adjustment, see note 2 to the financial statements).
This combination of changes in both total assets of $15.7 million and total liabilities of $0.3 million resulted in a net
increase in total net assets of $15.4 million. This increase in total net assets is attributable to increases in capital assets,
net of related debt of $1.9 million, increases in capital projects and other restricted net assets of $8.8 million, and
increases in unrestricted net assets of $4.7 million.
Net assets are reported in three major categories. The first category, invested in capital assets, net of related debt,
provides the Regional Campus’s equity in property, plant, and equipment owned by the Regional Campus. Restricted
net assets are another category, which may be further broken down into nonexpendable and expendable. Restricted
nonexpendable net assets represent funds that have been donated to the Regional Campus which are required to be
invested in perpetuity. These net assets are primarily maintained within the University of South Florida Foundation,
This is trial version
www.adultpdf.com
DECEMBER 2010 REPORT NO. 2011-059
5
Inc., a component unit of the University of South Florida, and are reported in the component unit column of the
University of South Florida’s financial statements. Restricted expendable net assets are available for use by the
Regional Campus, but must be spent for purposes as determined by donors or external entities that have placed time
or purpose restrictions on the use of the assets. The final category is unrestricted net assets. Unrestricted net assets
are available to the Regional Campus for any lawful purpose of the Regional Campus. The following graph illustrates
the comparative change in net assets by category for the 2009-10 and 2008-09 fiscal years.
Net Assets at June 30
(In Thousands)
T
HE STATEMENT OF REVENUES, EXPENSES, AND CHANGES IN NET ASSETS
The statement of revenues, expenses, and changes in net assets presents the Regional Campus’s revenue and expense
activity, categorized as operating and nonoperating. Revenues and expenses are recognized when earned or incurred,
regardless of when cash is received or paid.
$35,899
$27,311
$11,928
$34,035
$18,488
$7,214
$0
$20,000
$40,000
Invested in Capital
Assets, Net of Related
Debt
Restricted Unrestricted
2010
2009
This is trial version
www.adultpdf.com
DECEMBER 2010 REPORT NO. 2011-059
6
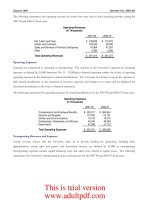
The following summarizes the Regional Campus’s activity for the 2009-10 and 2008-09 fiscal years:
Condensed Statement of Revenues, Expenses,
and Changes in Net Assets
(In Thousands)
2009-10 2008-09
Operating Revenues 4,802$ 4,737$
Operating Expenses 15,967 14,104
Operating Loss
(11,165) (9,367)
Net Nonoperating Revenues 15,888 10,020
Income Before Other Revenues,
Expenses, Gains, or Losses
4,723 653
Other Revenues, Expenses, Gains, or Losses 10,193 33,926
Net Increase In Net Assets
14,916 34,579
Net Assets, Beginning of Year 59,737 25,009
Adjustments to Beginning Net Assets (1) 485 149
Net Assets, Beginning of Year, as Restated
60,222 25,158
Net Assets, End of Year
75,138$ 59,737$
Note: (1)
Campus's beginning net assets for the 2009-10 fiscal year was
increased to correct an error in reporting bonds and revenue
certificates payable.
As discussed in note 2 to the financial statements, the Regional
Operating Revenues
GASB Statement No. 35 categorizes revenues as either operating or nonoperating. Operating revenues generally
result from exchange transactions where each of the parties to the transaction either give up or receive something of
equal or similar value.
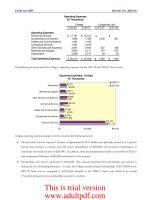
The following summarizes the operating revenues by source that were used to fund operating activities during the
2009-10 and 2008-09 fiscal years:
Operating Revenues
(In Thousands)
2009-10 2008-09
Net Tuition and Fees 4,421$ 3,895$
Grants and Contracts 356 801
Sales and Services of Auxiliary Enterprises 24 38
Interest on Loans and Notes Receivable 1 3
Total Operating Revenues
4,802$ 4,737$
Total operating revenues increased by $0.07 million with the change being attributable to two factors. Student tuition
and fees (after tuition scholarship allowance) increased by $0.5 million mainly due to an increase in the tuition rates
beginning in Fall 2009. Grants and contracts revenue decreased $0.4 million primarily from reduced expenditures in
Federal grants projects and reduced revenues in nongovernmental funds.
This is trial version
www.adultpdf.com