Process Engineering for Pollution Control and Waste Minimization_4 docx
Bạn đang xem bản rút gọn của tài liệu. Xem và tải ngay bản đầy đủ của tài liệu tại đây (864.97 KB, 26 trang )
Booth (1), on the other hand, believes that permits issued on an individual
basis rather than by country would be more effective:
Permits could be domestically distributed annually on a per person basis
equal in amount to existing emissions initially, and then reduced by 3.6
percent of the initial amount each year over a phase-in period of
approximately 25 years to arrive at a 90 percent total reduction. Individ-
uals who don’t need the full allocation for their own energy consumption
could sell their surplus permits at the going market price. Such a system
would tend to redistribute income away from industries and high-income
families who are heavy consumers of energy to low-income families
who tend to consume less energy. Because of the potential to sell surplus
permits, the public resistance to a permit system would be less than to a
carbon tax. The rising price of permits over time would provide the
incentive needed for increased energy conservation and to shift to
non-fossil fuel energy sources. As in the case of acid rain control, a
marketable permit system for carbon emissions control results in control
being achieved at the lowest possible cost (1). p. 23
Either of the above strategies would constitute impetus for increases in
efficiency and other conservation measures. Both taxes and tradable permits
minimize overall abatement costs by allocating the cutbacks to the countries
where marginal costs of emissions reductions are the lowest. A major difference
between the two strategies is that, with tradable permits, it is possible to specify
the exact cutback in emissions (4). Cline (4) believes the best strategy to be
reliance on nationally set carbon or greenhouse gas taxes during an initial
phase-in period and then, in a subsequent phase, to set the taxes at an inter-
nationally agreed rate while each individual nation would continue to collect
them. If such taxes failed to achieve satisfactory progress toward global emis-
sion targets, it would then be appropriate to shift to an international system of
tradable permits.
5.3 Elimination of Subsidies
5.3.1 International Subsidies
For some years, the World Bank (33) has been drawing attention to the fact that
electricity is sold in developing countries at, on average, only 40% of the cost of
its production. A recent study pointed out:
Such subsidies waste capital and energy resources on a very large scale.
Subsidizing the price of electricity is both economically and environ-
mentally inefficient. Low prices give rise to excessive demands and, by
undermining the revenue base, reduce the ability of utilities to provide
Copyright 2002 by Marcel Dekker, Inc. All Rights Reserved.
and maintain supplies. Developing countries use about 20 percent more
electricity than they would if consumers paid the true marginal cost of
supply. Underpricing electricity also discourages investment in new,
cleaner technologies and more energy efficient processes (16). p. 12
Shah and Larsen (1991, as cited in Ref. 4) estimated that nine large
developing and Eastern European countries (China, Poland, Mexico, Czecho-
slovakia, India, Egypt, Argentina, South Africa, and Venezuela) spend a combined
$40 billion annually in subsidization of fossil fuels (with China’s* $15.7 billion
the largest). The former Soviet Union spends more than twice this amount—$89.6
billion annually—on fossil fuel subsidies. The removal of these subsidies would
eliminate an estimated 157 million tons of carbon annually from the developing
group and 233 million tons from the former Soviet Union alone. These cutbacks
would represent about 8% of global carbon emissions (or about 6% if deforesta-
tion emissions are included).
Prices that cover production costs and externalities are likely to encourage
efficiency, mitigate harmful environmental effects, and create an awareness
conducive to conservation. Subsidized energy prices, on the other hand, are one
of the principal barriers to raising energy efficiency in developing countries,
where it is only 50–65% of what would be considered best practice in the
developed world. Studies indicate that with the present state of technology a
saving of 20–25% of energy consumed would be achieved economically in many
developing countries with existing capital stock. If investments were made in
new, more energy-efficient capital equipment, a saving in the range of 30–60%
would be possible (9).
5.3.2 U.S. Subsidies
According to Ackerman (30), two studies have attempted to measure federal
energy subsidies. The Department of Energy’s Energy Information Administra-
tion identifies subsidies worth $5–$13 billion annually, while the Alliance to Save
Energy, an energy conservation advocacy group, estimates energy subsidies at
$23–$40 billion annually (in 1992 dollars). Ackerman also states that several
provisions of the tax code are, effectively, subsidies to the oil and gas industry
and that, depending on one’s view of a local tax controversy, the total subsidy to
oil and gas production alone might be as much as $255 million, almost 5% of
sales in 1990.
*China accounts for 11% of global carbon emissions, excluding emissions from deforestation. Seventy
percent of China’s energy comes from coal (4).
Copyright 2002 by Marcel Dekker, Inc. All Rights Reserved.
5.4 Increases in Energy Efficiency
Primary energy is defined as the energy recovered directly from the Earth in the
form of coal, crude oil, natural gas, collected biomass, hydraulic power, or heat
produced in a nuclear reactor from processed uranium. Generally, primary energy
is not used directly but is converted into secondary energy (9). The process of
energy conversion and transformation results in part of the energy being wasted
as heat. Energy efficiency considerations focus on the following factors:
The efficiency of original extraction and transportation
The primary energy conversion efficiency of central power plants, refiner-
ies, coal gasification plants, etc.
The secondary energy conversion efficiency into storage facilities, distribu-
tion systems and transport networks (e.g., of electricity grids)
Efficiency of final energy conversion into useful forms such as light and
motion (9)
For the world as a whole, the overall efficiency with which fuel energy is
currently used is only around 3–3.5% (17). According to Orr (32), a Department
of Energy study showed that U.S. energy consumption could be reduced by 50%
with present technologies with a net positive economic impact. The United States
did indeed reduce the energy intensity of its domestic product by 23% between
1973 and 1985 (18).
5.4.1 The Industrial Sector
The industrial sector in the more advanced industrial countries is the most
efficient energy user. It is easier to be efficient when operating on a larger scale
and when energy is an explicit element of operating costs. Profit margins mandate
careful cost analysis, and in industries where energy costs comprise a significant
portion of total costs, managers are more alert to opportunities for savings (9).
According to the Office of Technology Assessment (1991, as cited in Ref. 2) four
sectors—paper, chemicals, petroleum, and primary metals—account for three-
fourths of the energy used in manufacturing. More than half the energy consumed
by industry in the leading industrial countries is as fuel for process heat, and over
one-fifth (gross) is in the form of electricity for furnaces, electrolytic processes,
and electric motors. Most process heat is delivered in the form of steam, with an
overall efficiency variously estimated to be between 15% and 25%. The biggest
users of process heat are the steel, petroleum, chemicals, and paper and pulp
industries (9).
Potential for improvements does exist. In general, sensors and controls,
advanced heat-recovery systems, and friction-reducing technologies can decrease
energy consumption (5). Many efficiency measures are specific to each industry.
For instance, the World Energy Council (9) offers several options for improving
Copyright 2002 by Marcel Dekker, Inc. All Rights Reserved.
efficiency in the chemical industry, including the use of biotechnology and
catalysts (Table 1).
In the paper industry, automated process control, greater process speeds,
and high-pressure rollers can boost efficiencies significantly (5). According to
Carlsmith et al. (1990, as cited in Ref. 4), electric arc furnaces using scrap are
much more energy efficient for steel production than are traditional techniques
and could increase their share of output from 36% to 60%. According to Cline
(4), these authors also estimate that by 2010, direct reduction or smelting of ore
for making iron would reduce energy requirements in steelmaking by 42% with
a net cost savings. Even greater opportunities exist for improving energy effi-
ciency in developing countries: for example, China and India use four times as
much energy as Japan does to produce a ton of steel (5).
In aluminum production, energy efficiency can be increased by improved
design of electrolytic reduction cells, recycling, and direct casting. Other exam-
ples of improvements in industrial processes include low-pressure oxidation in
industrial solvents, changes in paper-drying techniques (as well as paper recycl-
ing), and shifting from the wet to the dry process in cement making (4).
Co-generation, the simultaneous production of both electricity and steam or
hot water, represents a great opportunity for improving energy efficiency in that
the net energy yield from the primary fuel is increased from 30–35% to 80–90%.
In 1900, half the United States’ electricity was generated at plants that also
provided industrial steam or district heating. However, as power plants became
larger, dirtier, and less acceptable as neighbors, they were forced to move away
from their customers. Waste heat from the turbine generators became an unwanted
pollutant to be disposed of in the environment. In addition, long transmission
lines, which are unsightly and lose up to 20% of the electricity they carry, became
necessary. By the 1970s, co-generation had fallen to less than 5% of our power
TABLE 1 Options for Improving Efficiency in Chemical Industry
Options Benefits
Biotechnology Speed reaction times
Reduce necessary temperatures
and pressures
Catalysts Improve yields and reaction times
Reduce necessary temperatures
and pressures
Separation and concentration Improve product purity
Waste heat management Reduce necessary temperatures
and pressures
Copyright 2002 by Marcel Dekker, Inc. All Rights Reserved.
supply, but interest in this technology is being renewed, and the capacity for
co-generation has more than doubled since the 1980s.
5.4.2 Buildings
In developed countries, buildings are the largest or second-largest consumers of
energy. In the United States, buildings account for about 75% of all electricity
consumption (19) and about 35% of total primary energy consumption (3); most
of this is for heating and cooling. Electricity generation alone produces more than
25% of energy-related carbon dioxide emissions (20). Building improvements
could therefore have a major impact on overall energy consumption and carbon
emissions.
In a “typical” North American house, the average efficiency of insulation
is about 12% compared with the ideal. As a result, the overall energy efficiency
of air cooling systems has been estimated to be barely 5%, and the overall energy
efficiency for space heating is less than 1%. These figures do not take into account
avoidable losses through heating or cooling unoccupied rooms (9).
Building design is one of the simplest yet most effective ways to take
advantage of solar energy. Buildings can incorporate either passive or active solar
technologies. Passive solar heating and cooling function with few or no mechan-
ical devices; primarily they involve designing the form of landscape and building
in relation to each other and to sun, earth, and air movement (19). In general,
passive technologies use a building’s structure to capture sunlight and store heat,
reducing the requirements for conventional heating and lighting. Heating can be
cut substantially by the use of one or several technologies in the building’s design
(Table 2). When included in a building’s initial design, these methods can save
up to 70% of heating costs (21). Orr (32) points out that it is cheaper and less
risky by far to weatherize houses than it is to maintain a military presence in the
Persian Gulf at a cost of $1 billion or more each month.*
Cooling needs also may be reduced by passive means; one strategy is the
reduction of internal heat gains. Another passive strategy for reducing cooling
needs is by reduction of external heat gains. Several technologies that can be used
to reduce internal and external heat gains are listed in Table 2. Also, it is important
*Nearly one-quarter of all jet fuel in the world, about 42 million tons per year, is used for military
purposes. The Pentagon is considered to be the largest consumer of oil in the United States and perhaps
in the world. One B-52 bomber consumes about 228 liters of fuel per minute; one F-15 jet, at peak
thrust, consumes 908 liters of fuel per minute. It has been estimated that the energy the Pentagon uses
up annually would be sufficient to run the entire U.S. urban mass transit system for almost 14 years.
Further, it has been estimated that total military-related carbon emissions could be as high as 10% of
emissions worldwide, and that between 10% and 30% of all global environmental destruction can be
attributed to military-related activities (28).
Copyright 2002 by Marcel Dekker, Inc. All Rights Reserved.
to trade in old, wasteful for newer, more efficient ones; the payback period may
be as little as two to three years (3).
One measure proposed in several developed countries is to require all
houses to be subject to an energy efficiency survey that would lead to an energy
efficiency rating which would have to be disclosed to prospective buyers when
the house is sold (9).
5.4.3 Lighting
About 40–50% of the energy consumed in a typical house is used for heating and
cooling, with an additional 5–10% used for lighting. Lighting is the least efficient
common use of energy: about 95% of the energy used in an average lighting
system dissipates as heat (19). Incandescent bulbs have an efficiency of about 4%
in converting electricity to visible radiant energy. In contrast, the efficiencies of
fluorescent lights is typically around 20%, and can be as high as 35% (9).
According to Lovins and Lovins (1991, as cited in Ref. 4), a 15-W compact
fluorescent bulb emits the same amount of light as a 75-W incandescent bulb and
lasts 13 times as long. Further, over its lifetime, it can save enough coal-fired
TABLE 2 Technologies for Increasing a Building’s Energy Efficiency
Area for improving
energy efficiency Technology
Heating Heat-circulation systems using natural convective
forces
Heat pumps
Solar-thermal collectors
Insulated windows and shutters
Special window glazings
Heat-storing masses built into structure
Building orientation
Draft proofing
Superinsulation of structure
Cooling Fluorescent lighting over incandescent
Lower-wattage bulbs
Landscaping that provides maximum shade
Window shades
Reflective or tinted window coatings
Insulated windows
Light-colored roofs
Ventilation by natural convection
Ground absorption of heat
Copyright 2002 by Marcel Dekker, Inc. All Rights Reserved.
electricity to reduce carbon emissions by 1 ton with a net savings. The National
Academy of Science (1991, as cited in Ref. 4) contends that the replacement of
an average of just 2.5 heavily used interior incandescent bulbs and one exterior
bulb by compact fluorescent lights would reduce average household lighting
energy requirements by 50%. Why, then, do we continue to use incandescents?
Lack of awareness
Easy commercial availability or promotion
High first cost
High replacement cost in the event of breakage
Cost and inconvenience of retrofitting new lighting systems to existing
domestic buildings, where rewiring and new sockets, holders, and appli-
ances may be needed (9)
5.4.4 Government’s Role
MacNeill (31) contends that, in order to make steady gains in energy efficiency,
governments must institute politically difficult changes in at least three areas:
1. Countries must consider “conservation pricing,” i.e., taxing energy
during periods of low real prices to encourage increases in efficiency.
2. Stricter regulations should demand steady improvement in the effi-
ciency of appliances and technologies, and in building design, auto-
mobiles, and transportation systems. [In the United States, efficiency
standards for appliances were adopted in 1986. For refrigerators, the
biggest users of electricity in most households, the energy efficiency of
new models almost tripled from 1973 to 1993 (22).]
3. Institutional innovation will be necessary to break utility-supply
monopolies and to reorganize the energy sector so that energy services
can be sold on a competitive, least-cost basis.
In addition, governments should excise policies that retard the development of
new and renewable energy resources, particularly those that serve as substitutes
for fuelwood.
5.4.5 Caution
As a final word on the issue of efficiency, it is worthwhile to quote Cline (4):
In reaching the overall conclusion that some 20 percent to 25 percent of
carbon emissions in the United States might be eliminated at zero cost
by a move to “best practices,” it is important that there not be a
misguided inference that dealing with the greenhouse problem will be
cheap over the longer term. . . . Serious action to curb global warming
would involve emissions restraints over a period of two to three centu-
Copyright 2002 by Marcel Dekker, Inc. All Rights Reserved.
ries. . . . Whether the first step is low-cost (or even no-cost) is significant
but of limited help in gauging the eventual costs.
The central point is that a one-time gain from elimination of
inefficiencies would shift the entire curve of baseline emissions down-
ward but still leave future emissions far above present levels. Consider
the period through the year 2100 . . . a central baseline estimate calls for
approximately 20 GtC of global carbon emissions by that year . . . an
aggressive program to limit global warming would mean restricting
emissions to approximately 4 GtC annually. Suppose the engineering
approach is correct that, 20 percent of emissions can be eliminated for
free. Such gains would still leave emissions at 16 GtC in the year 2100,
far above the 4-GtC ceiling needed to substantially curb the greenhouse
effect. The remaining cutbacks would have to be achieved through more
costly industrial reductions in energy availability beyond those achiev-
able through costless efficiency gains. In short, the “best practices”
school provides a basis for expecting that addressing the global warming
problem may be less costly than otherwise might be thought, but it by
no means warrants the conclusion that action will be costless over the
longer term (4).
5.5 Energy Conservation in Transportation
Transport activities account for about 30% of the energy used by final consumers,
and about 20% of the gross energy produced (9). About 98% of the total comes
from petroleum products refined into liquid fuels, and the remaining 2% is
provided by natural gas and electricity (3). Movement of people takes about 70%
of the total, and movement of freight about 30%. Within this sector, road transport
accounts for the largest proportion, over 80% in industrialized countries, with air
transport next, at 13% (9). According to the United Nations Fund for Population
Activities (29), the world car fleet increased by seven times between 1950 and
1980 while human population only doubled during that period. Fifteen percent of
the world’s oil is consumed by automobiles and light trucks in the United States
alone (Office of Technology Assessment, 1991, as cited in Ref. 4).
About 75% of all freight in the United States is carried by trains, barges,
ships, and pipelines, but because they are very efficient, they use only 12% of all
transportation fuel (3). The rapid increase in road transport in recent years is a
major contributor to the rise in oil demand. Further, motor vehicles are believed
to be responsible for 14% of all CO
2
derived from fossil fuel combustion (9),
along with their contribution to acid rain and other forms of air pollution such
as O
3
.
The Reagan administration relaxed automobile efficiency standards that had
already been met by Chrysler. If the regulations had been left in place, the amount
Copyright 2002 by Marcel Dekker, Inc. All Rights Reserved.
of gasoline saved in a decade or so would have been equivalent to the entire
amount of oil estimated to underlie the Arctic National Wildlife Refuge (23).
Gasoline prices in Europe and Japan are double or triple the U.S. price
because governments there impose levies that force consumers to consider and
internalize the full costs of their behavior (5). The gradual imposition of a
significantly higher gasoline tax, until the cost of gasoline in the United States is
comparable to that in Europe, would create a powerful incentive for people to
drive smaller, more fuel-efficient cars and use energy-efficient alternative forms
of transportation. Highways and bridges would last longer, and emissions would
be reduced, attenuating global warming and acid rain. This would, of course,
necessitate improvement of public transportation to accommodate people who
could no longer afford to drive to work; some of the gas-tax funds could be set
aside for this. In the United States, mass transport accounts for only 6% of all
passenger travel; in Germany the figure is over 15% and in Japan it is 47% (9).
Another possibility for internalization of the many hidden costs of driving
would be the implementation of an insurance program based on the average
number of miles a driver travels. This would link a portion of drivers’ insurance
programs to the number of miles they drive and collect payments at the gas pump
(12). Ledbetter and Ross (11) provide the details of such an arrangement:
The price of gasoline at the pump could include a charge for basic,
driving-related automobile insurance that would be organized by state govern-
ments and auctioned in blocks to private insurance companies. All registered
drivers in the state could automatically belong. Supplementary insurance above
that provided by the base insurance purchased at the pump could be indepen-
dently arranged, as we presently do for all our insurance. For example, owners of
expensive cars, or people who desire higher levels of liability coverage, could
purchase supplemental insurance. Drivers with especially bad driving records
could be required to purchase supplemental liability insurance. Below are some
of the advantages of such an arrangement.
Insurance costs become much more closely tied to the amount of driving
alone. The more miles a person drives, the more insurance he or she pays.
Since accident exposure is closely correlated with miles driven, the
proposed system would be more fair than the present system, in which
people who drive substantially less than the average miles per year are
given only small discounts, and people who drive substantially more than
the average don’t pay any additional premium.
If insurance were part of the cost of gasoline, a person could not drive
without paying for insurance. Uninsured motorists would be brought into
the system, substantially lowering the cost of driving for insured motor-
ists: in California for example, uninsured motorists increase premiums
for insured motorists by about $150 per year.
Copyright 2002 by Marcel Dekker, Inc. All Rights Reserved.
The apparent cost of gasoline at the pump would rise substantially, roughly
50 cents to a dollar per gallon. Such a price rise would encourage the
purchase of more fuel-efficient vehicles and help slow the growth in
vehicle miles of travel. For consumers, the increase in the price of fuel
would be offset by a decrease in the annual insurance premium motorists
would pay directly to insurance companies, resulting in no net increase
in driving costs.
Unlike a gasoline tax, this system would not be regressive: many low-
income persons drive substantially less miles per year than their higher-
income counterparts. They would, therefore, see a substantial drop in the
money they pay for auto insurance (11).
5.5.1 Efficiency Issues in Transportation
The efficiency of a motor vehicle is a function of several factors (Table 3).
Typically, about 80% of the fuel used in a representative vehicle traveling over a
mix of urban, rural, and highway routes is unproductive energy spent in overcom-
ing internal friction in auxiliary items and in thermodynamic losses in the engine
(9). Improvements in vehicle design and alternative fuels can have a major impact
in improving efficiency and reducing emissions. However, much of the forward
momentum achieved in the decade prior to 1985 has slowed in response to
downward oil price movements and apparent consumer preferences (9).
The inherent efficiency of the internal combustion engine began to ap-
proach its limits in the 1960s. Engines built since then range from 34% efficiency
for spark-ignition automobile-type engines under optimum load/speed conditions
to about 42% for large marine-type and direct-injection diesels. The difference is
attributable to the higher compression ratios, lower throttle losses and improved
direction injection achievable in large diesels.
In practice, however, optimum load/speed conditions are never achieved.
The energy efficiency of a vehicle operating in traffic, with variable speeds and
TABLE 3 Factors Affecting a Motor Vehicle’s Fuel Efficiency
Factor Components
Design Weight
Efficiency
Frictional losses
Aerodynamics
Use Effectiveness of use in transporting
materials and people
Typical operational cycle Length of journey
Traffic conditions
Copyright 2002 by Marcel Dekker, Inc. All Rights Reserved.
loads, is at least 30% lower. Short journeys, when the engine is cold at start-up
and never warms up sufficiently for optimal fuel combustion, create suboptimal
fuel use and high emissions. Stop/start conditions in heavy traffic also cause
relatively high fuel use and emissions (9).
Engine efficiency is further reduced, often by an additional 30% or so,
by the carrying of oil pumps, air pumps, fuel pumps, electrical systems, heat-
ing, air conditioning, and other related equipment. Friction and viscosity losses
in the vehicle’s drive train—e.g., in automatic transmissions, which alone can
reduce engine efficiency by 10–15%, cut efficiency still further. As a result, the
average thermodynamic efficiency of the motor vehicle is only between 10%
and 17%.
Nevertheless, significant improvements in automobile fuel economy have
been achieved in recent years. The biggest gains have been made by cutting down
on excess weight in the body, improving aerodynamics, and improving tires. Still,
the “payload efficiency” of a medium-sized car is only about 10%, while that of
fully loaded commercial aircraft is around 30–35%. Heavy-duty trucks, freight
trains, and ships also achieve greater payload efficiencies than cars (9).
Raising the average fuel efficiency of the U.S. car and light truck fleet by
1 mpg would cut oil consumption about 295,000 bbl per day. In one year, this
would equal the total amount the Interior Department hopes to extract from the
Arctic National Wildlife Refuge in Alaska (3). Increased fuel efficiency can
be supplemented by savings from transportation management, including in-
creased mass transit, carpooling, and improved maintenance (including proper
tire inflation) (4).
5.6 Increased Exploitation of Natural Gas
Increased exploitation of natural gas in preference to coal or oil as an interim
measure has the potential to slow global warming as non-hydrocarbon primary
energy sources are developed and put into place. Natural gas provides about
one-fifth of global commercial energy and is our most efficient “traditional”
energy source. Only about 10% of its energy content is lost in shipping and
processing, since it moves by pipelines and usually needs very little refining.
Ordinary gas-burning furnaces are about 75% efficient, and high-economy fur-
naces can be as much as 95% efficient (3). It generates fewer pollutants than any
other traditional fuel and less CO
2
as well: 42% less than coal and 30% less than
oil (5).
According to Gibbons et al. (5), some analysts feel that the most promising
future option for electric power generation is the aeroderivative turbine, which is
based on jet engine designs and burns natural gas. With additional refinement,
this technology could raise conversion efficiency from its present 33% to more
than 45%.
Copyright 2002 by Marcel Dekker, Inc. All Rights Reserved.
North America has a pipeline network for delivering natural gas to market.
However, most countries cannot afford a pipeline network, and much of the
natural gas that comes out of the ground in conjunction with oil pumping is
simply burned (flared off), a terrible waste of a valuable resource (3).
Natural gas is quite easy to ship through pipelines as long as it is going
from one place to another on the same continent. The problem is that much of
the gas is in Russia or the Middle East, while the markets are in Europe, Japan,
or North America. One way of shipping gas across oceans is to liquefy it by
cooling it below its condensation point (–140˚C). Liquefied natural gas (LNG)
has only 1/600 the volume of the gaseous form, and is therefore economical to
transport by tanker ship. However, if a very large LNG tanker had an accident
and blew up, it would release as much energy as several Hiroshima-sized atomic
bombs (3).
5.7 Increased Exploitation of Passive Technologies
Because most paved surfaces, and the surfaces of most buildings, tend to retain
and release more heat than is true of vegetated areas, and because heating and air
conditioning equipment releases/generates a great deal of heat, urban areas
typically are several degrees warmer than vegetated areas. For example, an early
study of this subject showed downtown St. Louis to be 13˚F warmer in the winter
and 9˚F warmer in June than the large, tree-canopied Forest Park, 5 miles away.
Tree cover can moderate this “heat island effect,” helping to control micro-
climate in three different ways:
1. Absorption and reflection of solar radiation. A tree in full leaf intercepts
between 60% and 90% of the radiation that strikes it, depending on the
density of its canopy. Clusters of trees spaced closely together can
therefore reduce ambient summer temperature significantly. Placed
directly adjacent to buildings on the east, west, and south sides, they
can reduce incoming solar radiation in the summer and, if deciduous,
allow most of it to pass through in the winter, when a deciduous tree
intercepts only 25–50%.
2. Creation of a “still zone” under the canopy. Around the edges of a tree
canopy is a band of air turbulence where the cooler air within and the
warmer outside air meet and mix. This turbulent zone appears to form
a containing frame for the still, cool air beneath the canopy.
3. Release of cooling water vapor from their leaf surfaces through evap-
oration and transpiration (19).
A study of a mobile home in Florida showed that well-placed plantings
could reduce cooling costs by more than 50% (Hutchinson et al., 1983, as cited
in Ref. 19). Calculations of electrical energy saved by tree planting suggest that
Copyright 2002 by Marcel Dekker, Inc. All Rights Reserved.
this is one of the most cost-effective means of reducing the heat island effect and
thus electrical energy consumption (19). According to McPherson (1990, as cited
in Ref. 19), about 97% of the total carbon conserved annually by a tree is in
reduced power-plant emissions resulting from reduction in electrical energy use
rather than in carbon dioxide absorbed.
6 POLLUTION PREVENTION VIA CHOOSING
REPLACEMENTS FOR FOSSIL FUELS
6.1 Introduction
Despite potentially significant technological improvements in efficiency and
decreases in environmental impact, some of the inefficiencies and pollutants
associated with traditional energy sources cannot be avoided. Uneven distribution
of resources can increase transportation costs, which can amount to 25% or more
of the cost of crude oil, for example (9). Indeed, about 75% of the original energy
in crude oil is lost during distillation into liquid fuels, transportation of that fuel
to market, storage, marketing, and combustion in vehicles (3). For this reason,
alternative energy sources such as solar, geothermal, and wind should receive
much more attention.
In the United States, “renewable” energy sources account for about 7.5%
of total consumption. The vast majority of this energy comes from two sources
that have reached commercial maturity: hydroelectric power and biofuels (24).
Currently, biofuels, primarily wood, account for about 4% of the U.S. energy
supply. More than 6% of all homes burn wood as their principal heating fuel. The
paper and pulp industry burns wood scraps to provide heat and electricity to run
its operations. Wood and other biofuels are also used to generate a small amount
of electricity by utilities (6).
Worldwide, potentially sustainable or renewable energy resources, includ-
ing solar, biomass, hydroelectric, and other, less developed types of power
production, currently provide less than 3% of total energy use (3). As of 1990,
traditional biomass (e.g., fuelwood, crop residues, and dung) accounted for 60%
of total available renewable energy, and large-scale hydropower for another 30%
(9). About half of all wood harvested in the world annually is used for fuelwood;
many countries use fuelwood (including charcoal) for more than 75% of their
nonmuscle energy. About 40% of the world’s total population depend on firewood
and charcoal as their primary energy source. In some African countries, such as
Rwanda and Sudan, firewood demand is already 10 times the sustainable yield of
remaining forests (3). These figures illustrate the enormity of the potential for
environmentally benign energy sources such as solar to replace not only fossil
fuels but also traditional renewables which also cause environmental harm.
Copyright 2002 by Marcel Dekker, Inc. All Rights Reserved.
6.2 Biomass
As recently as 1850, wood supplied 90% of the fuel used in the United States.
Wood now provides less than 1% of energy in the United States, but in many of
the world’s poorer countries, wood and other biomass fuels provide up to 95%
of all energy consumed. Approximately half of all wood harvested annually is for
fuel. About 40% of the world’s population depend on firewood and charcoal as
their primary energy source; however, about three-fourths of these lack an
adequate, affordable supply (3).
In wood-burning power plants, pollution-control equipment is easier to
install and maintain than in individual home units. Wood burning contributes less
to acid precipitation than does coal, as wood contains little sulfur and burns at
lower temperatures than coal, resulting in the production of fewer nitrogen oxides.
However, unless trees cut for fuel are replaced with seedlings, wood burning
results in a net increase in atmospheric CO
2
.
Inefficient and incomplete burning of wood in stoves and fireplaces pro-
duces smoke laden with fine ash and soot and hazardous amounts of carbon
monoxide and hydrocarbons. The U.S. Environmental Protection Agency (EPA)
ranks wood burners high on a list of health risks to the general population, and
standards are being considered to regulate the use of woodstoves nationwide.
Highly efficient and clean-burning woodstoves are available but expensive (3).
6.3 Hydroelectric Dams
As of 1987, hydroelectric dams in the United States provided the energy equiva-
lent of about 71 large power plants, about 10–14% of U.S. electricity, or about
3% of total energy supply, depending on year-to-year rainfall patterns. Of the
pollutants associated with fossil fuel energy, methane is the only one that results
from the damming of rivers. However, large dams have drowned out some of the
most beautiful stretches of American rivers, flooded agricultural lands, forests,
and areas of historical and geological value, and resulted in the dislocation of
communities and loss of wildlife (6). Dam failure can cause catastrophic floods
and thousands of deaths. Sedimentation often fills reservoirs rapidly and reduces
the usefulness of the dam for either irrigation or hydropower (3).
6.4 Synthetic Fuels
Methanol would provide little reduction in greenhouse gases if made from natural
gas (Office of Technology Assessment, as cited in Ref. 4). Synthetic fuels derived
from coal or oil shales would result in the release of even more CO
2
than coal
because the conversion processes require so much energy (6). The use of
compressed natural gas brings the potential for leaks of methane that could largely
offset the lesser carbon content of natural gas when compared to oil.
Copyright 2002 by Marcel Dekker, Inc. All Rights Reserved.
Ethanol (grain alcohol) and methanol (wood alcohol) are produced by
anaerobic digestion of plant materials (Figure 7). Ethanol is unlikely ever to play
an important energy role in our transportation future: 8% of the U.S. corn crop
would replace only 1% of U.S. gasoline. Further, making ethanol from corn
requires almost as much energy as the ethanol contains; therefore, it offers little
if any global-warming benefit (6). Among biomass fuels, synthetic natural gas or
methanol produced from woody biomass hold the largest potential for reducing
greenhouse gases (a reduction of 60–70% from that emitted by vehicle fuels used
at present), so long as the feedstock were offset with replacement biomass growth
(Office of Technology Assessment, as cited in Ref. 4).
6.5 Tides
The stormy coasts where waves are strongest are usually far from major popula-
tion centers that need the power. In addition, the storms that bring this energy can
destroy the equipment intended to exploit it (3). Even if the technology for
capture of tidal energy were available, only a minute fraction could, even
theoretically, be harnessed for useful purposes (25). France operates a tidal
generating station on the Rance Estuary that is designed to produce 240 MW of
electricity but that usually only generates 62 MW (26).
Gas
Supply
Hot
Water
Supply
Anaerobic
Digestor
Raw Materials
Ethanol or
Methanol
Production
Sludge
FIGURE 7 Production of ethanol and methanol through anaerobic digestion
of plant material.
Copyright 2002 by Marcel Dekker, Inc. All Rights Reserved.
6.6 Nuclear Power
Nuclear power provides about 17% percent of the world’s electricity (5) and about
5% of total energy needs, led by Western Europe with about 11% reliance on
nuclear plants (3). Although the United States has the world’s largest nuclear
power program, it provides only about 7.5% of our energy needs. In the United
States, at least, the management and operation of existing plants must improve
significantly, and existing unresolved safety problems must be convincingly
solved. The design of new reactors must be simplified and incorporate more
passive shut-down safety features. Further, there must be tangible progress in
solving the problems of storing radioactive wastes (6).
However, even if all these requirements were met, the potential contribution
of nuclear energy to solving the global energy–climate problem would be limited
for several reasons:
It is unlikely that a significant number of safer new reactors can be
designed, approved, constructed, operated, and “debugged” in a rela-
tively short period of time—say, less than 20 years. They will therefore
be unable to make a significant contribution to meeting the world’s
energy needs during the next 20–40 years.
Because of their inherent cost and complexity, nuclear plants are unlikely
to be deployed in poor, developing countries. Such facilities demand a
high level of sophisticated and expensive support to be safely constructed
and operated, a condition unlikely to occur in most of the developing
world.
Unless the world suddenly embraces peaceful solutions to its age-old
ethnic and boundary problems, the prospect of nations using nuclear
materials to build weapons clandestinely will grow with nuclear plant
deployment (6).
Of the nuclear plants that have been decommissioned so far, the costs of
tearing them down have been about two to ten times the costs of building
them in the first place.
We may never reach a breakeven point where we get back more energy
from nuclear plants than we put into them, especially considering the
energy that may be required to decommission nuclear plants and guard
their waste products in secure storage for thousands of years (3).
The raw materials required for nuclear fuels result in the same disturbances
of the landscape as other mined minerals.
Denmark has never permitted atomic power plants to be constructed within
its boundaries, and Sweden has a policy of decommissioning all its existing
plants. In the United States, few plants currently are under construction because
it has become so costly due to required environmental safeguards and the
Copyright 2002 by Marcel Dekker, Inc. All Rights Reserved.
inevitable litigation of nuclear opponents. Further, in most parts of the United
States, it is so politically risky that no new plans for nuclear power plant
construction are currently in existence (14).
6.7 Geothermal Energy
Geothermal energy is heat contained below the earth’s surface, either in rock or
in trapped hot water or steam. Geothermal power offers a number of environmen-
tal advantages. When compared with other alternative energy sources, geothermal
plants are reliable; the Department of Energy reports that they have a 65%
“capacity factor” (the ratio of actual output to the output that would result if the
plant ran full-tilt, full time). This is comparable with the capacity factors of new
coal or gas turbine plants. In contrast, the capacity factor of wind and solar
thermal plants is about 21%. Geothermal energy produces no ash, no scrubber
waste, and no radioactive waste. Although geothermal energy sometimes pro-
duces toxic waste from the dissolved or suspended chemicals naturally found
deep in the earth, these materials tend to be more easily disposed of than those
from other energy sources; virtually all U.S. generating plants simply reinject
them into the reservoir (27).
Geothermal power, however, suffers from resource, technological, and
economic constraints. The only type of geothermal energy that has been widely
developed is hydrothermal energy, which consists of trapped hot water or steam
(24). The total geothermal energy of the world’s volcanoes and hot springs is only
about 2% of today’s global commercial energy use. This energy flux can be
utilized in hyperthermal areas such as Iceland (where most buildings are heated
by geothermal steam) or in the “Ring of Fire” surrounding the Pacific Ocean,
where 18 nations (including the western United States) currently generate geo-
thermal electricity (27). Hydrothermal cannot, however, be of more than local or
regional importance (25).
Creating a geothermal plant is expensive, because developers usually must
bore holes a mile or so deep through hard rock. Even though geothermal plants
need no fuel, making operating costs extremely low, the capital cost still amounts
to about $3000 per kilowatt, in contrast for about $824 per kilowatt for an
efficient gas turbine plant. Innovations such as new drilling technologies promise
to cut expenses (27).
Other problems associated with the use of geothermal power include the
following:
Geothermal facilities are very large-scale plumbing pipes with an abun-
dance of giant pipes, huge valves, and specialized fittings. Some plants
need mufflers and sound blankets to reduce drilling and generating noise,
and they usually emit a plume of steam.
Copyright 2002 by Marcel Dekker, Inc. All Rights Reserved.
The rotten-egg stench of hydrogen sulfide released from underground can
often be overpowering (27).
The geothermal heat conducted by rocks is two and one-half times today’s
commercial energy use (25). Preliminary estimates of the cost of electricity
derived from hot dry rock (HDR) suggest that it might be relatively cheap, at least
in areas where the earth becomes at least 144˚F warmer with each mile of depth
and drilling costs are thus somewhat less formidable. Conditions like these
reportedly are found under 40,000 square miles of the lower 48 states, primarily
in Nevada, Oregon, and California (27). In view of the potentially catastrophic
effects of global warming, as well as the other environmental problems associated
with traditional energy sources, HDR-derived energy deserves serious study.
6.8 Wind Farms
Wind farms are large-scale public utility efforts to take advantage of wind power.
In 1990, wind machines in California generated enough electricity to meet the
annual residential needs of a city the size of San Francisco, or more than 1% of
California’s total electrical needs. There are enough windy sites in California to
meet about 20% of existing electricity demand. Advanced wind machines could
supply energy to the United States in amounts far in excess of the nation’s total
present energy demand.
The towers, roads, and other structures on a wind farm actually take up only
about one-third as much space as would be consumed by a coal-fired power plant
or solar thermal energy system to generate the same amount of energy over a
30-year period. The land under windmills is more easily used for grazing or
farming than is a strip-mined coal field or land under solar panels. Further, wind
power generates many more jobs per unit energy produced than do most other
technologies, even though its total cost is generally lower (3).
An obvious limitation of wind farms is the necessity of locating them in
windy areas. The best sites are in the Great Plains and include North and South
Dakota, Kansas, and Montana (6). Seacoasts also offer great potential for siting
wind farms. Opponents have complained of visual and noise pollution. While
most wind farms are too far from residential areas to be heard or seen, they do
interrupt the view in remote places and destroy the sense of isolation and natural
beauty. They can also pose a hazard to birds that fly into the whirling blades.
6.9 Solar Energy
Of all the available forms of energy, renewable or nonrenewable, solar has the
greatest potential for providing clean, safe, reliable power. The supply is in-
exhaustible: the solar energy falling on the earth’s continents is more than 2000
times the total annual commercial energy currently being used by humans (25).
Copyright 2002 by Marcel Dekker, Inc. All Rights Reserved.
Solar technologies can be broadly grouped into two categories:
1. Active technologies—solar thermal power plants, solar ponds, wind
turbines, and photovoltaic cells (Figure 8)
2. Passive technologies—natural materials or absorptive structures with
no moving parts that simply gather and hold heat (Figure 8) (3)
Low-temperature thermal collectors can provide heat for domestic hot
water, space heating, and industrial purposes (e.g., supplying hot water for car
washes). According to Cunningham and Saigo (3), water heating consumes 15%
of the U.S. domestic energy budget.
Active solar systems generally pump a heat-absorbing, fluid medium (air,
water, or an antifreeze solution) through a relatively small collector rather than
passively collecting heat in a stationary medium such as masonry (Figure 8) (3).
There are three main types of solar-thermal collectors: the parabolic trough, the
parabolic dish, and the central receiver.
Parabolic trough and parabolic dish units are modular and relatively small,
so that systems can be sized to suit almost any application. Central-receiver
systems generally are much larger. In all three, sunlight striking reflectors is
collected and used to heat a fluid that is piped to a central location. The heat can
be used directly to produce steam for industrial processes or to drive turbines that
generate electricity (21).
Photovoltaic cells are elegantly simple devices that generate electricity
directly from sunlight without going through the process of thermal–electric
conversion. These cells are made of silicon or other semiconductor materials; they
have no moving parts and therefore are quiet and reliable. Photovoltaic cells
require no maintenance, have the potential for long life, produce no pollution, and
consume no water in generating electricity. They can convert 20% or more of the
sunlight striking them into electricity; practical efficiencies in the 30–40 range
are possible (21).
In the United States, the land area of the lower 48 states intercepts about
47,000 quadrillion BTUs of direct sunlight per year, about 600 times total U.S.
primary energy use. At a solar collection efficiency of 15%, readily achievable
using present photovoltaic cells, significantly less than 1% of the land area of the
lower 48 states would be required to meet all our energy needs. This can be
compared to the 20% of U.S. lands devoted to croplands, or the 31% to pastures.
Moreover, many of the solar cells could be placed on the walls and roofs of
existing structures, reducing the area of land needed (6).
If the entire present U.S. electrical output came from central tower solar
steam generators, 780 square miles of collectors would be needed. This is less
land, however, than would be strip-mined in a 30-year period if all our energy
came from coal or uranium. Further, we can put solar collectors wherever we
choose (such as lands unsuited for agriculture, grazing, or habitation), whereas
Copyright 2002 by Marcel Dekker, Inc. All Rights Reserved.
COLD
HOT
Passive
solar heating
Active
solar heating
heat from hot water
warm air
cool air
glass
collector wall
summer
solar radiation
angle
winter
solar radiation
angle
heat
exchanger
air
space
solar
collector
FIGURE. 8 Passive and active solar systems. In a passive system, the length of roof overhang is
based on the latitude of the winter and summer sun. Natural air convection circulates heated air
between outer glass wall and collector wall. The collector wall is designed to be ~40 cm thick to
collect and store solar heat. In the active system, water is passed through solar collector panels,
the heated water is then pumped into the house, where heat is radiated from the hot water and
then recirculated into the system.
Copyright 2002 by Marcel Dekker, Inc. All Rights Reserved.
strip-mining occurs wherever coal or uranium exist, regardless of other values
associated with the land (3).
What happens when the sun goes down? One solution is hybrid energy
systems that run on 75% solar energy and 25% natural gas.
Unlike nuclear power, solar presents no problems of safety, disposal of
radioactive wastes, or danger that nuclear materials will fall into the wrong hands.
However, although solar schemes probably have the smallest environmental
impact of all current forms of energy, care must be taken with size of concentra-
tors and with the films and silicon used in photovoltaics (9).
It must be remembered that net yields and overall conversion efficiencies
are not the only considerations when different energy sources are compared. The
yield/cost ratio and conversion-cycle efficiency is much higher for coal burning,
for example, than for photovoltaic electrical production, making coal appear to
be a better source of energy than solar radiation. However, solar energy is free,
renewable, and nonpolluting; therefore, if we use solar energy to obtain electrical
energy, it does not matter how efficient the process is, as long as we get more out
of it than we put in (3).
6.10 Costs of Renewables
Geothermal energy is currently the least expensive renewable energy source. It is
closely followed by wood, hydroelectric, wind, and solar energy (Table 4). Most
solar technologies have high initial costs while providing savings down the road
in the form of lower fuel costs. For example, a solar water heater may cost $2500
to purchase and install. A solar power plant may cost $2500–$3000 per kilowatt
of capacity, while a conventional power plant costs between $400 and $1200 per
kilowatt of capacity. The difference is that solar technologies cost very little to
operate, whereas the major cost associated with conventional technologies is
usually fuel, which will be paid later. Unfortunately, our tax system gives
TABLE 4 Cost Comparison of
Renewable Energy Sources
Energy source Cost (cents/kWh)
Geothermal 4.5–6.5
Hydroelectric 5
Wood 5
Wind 7.5
Solar-thermal 8
Solar (photovoltaic) 30
Copyright 2002 by Marcel Dekker, Inc. All Rights Reserved.
advantages to the conventional plants, which can deduct the high, ongoing fuel
costs as operating expenses (21).
Commercialization of solar technologies could be greatly accelerated with
market incentives such as solar-energy tax credits, regulations requiring that
cost-effective passive and active solar technologies be included in new buildings,
and increased federal funding for solar-energy research and development. Cur-
rently, the great majority of subsidies go to established energy sources—fossil
fuels and nuclear power (21). U.S. federal funding for renewable energy sources
fell from $1.3 billion in 1980 to $135 million in 1990 (in 1990 dollars; Office of
Technology Assessment, 1991, as cited in Ref. 4). By recognizing the environ-
mental and social costs of energy technologies, federal, state, and local govern-
ments can help provide a “level playing field” for solar technologies and play a
decisive role in influencing energy choices (21).
When a homeowner or community invests independently in solar or wind
generation, what should be done about energy storage when electricity production
exceeds use? Many private electricity producers believe the best use for excess
electricity is in cooperation with the public utility grid. When private generation
is low, the public utility runs electricity through the meter and into the house or
community. When the wind generator or photovoltaic systems overproduce, the
electricity runs back into the grid and the meter runs backward. Ideally, the utility
reimburses individuals for this electricity, for which other consumers pay the
company. The 1978 Public Utilities Regulatory Policies Act required utilities to
buy power generated by small hydro, wind, cogeneration, and other privately
owned technologies at a fair price. Not all utilities comply yet, but some—notably
in California, Oregon, Maine, and Vermont—are purchasing significant amounts
of private energy (3).
7 CONCLUSION
Significant reductions in all pollutants that result from petroleum combustion
(CO
2
, CO, acid rain precursors, photochemical oxidants, unintentional petroleum
releases) could be achieved by the imposition of a gasoline tax that would
encourage the use of public transportation and fuel-efficient vehicles. Reduc-
tions in motor vehicle-related urban runoff represent an additional pollution
benefit of reducing the use of fossil fuels for transportation. The benefits of
freezing carbon emissions via a permitting system could have similar benefits to
those of a carbon tax, possibly with less public resistance.
At present, the possibilities for alternative transportation fuels appear rather
limited. The primary drawback for the use of ethanol is the relatively low energy
value obtained through its use as compared to the energy required for its
production. Synthetic natural gas or methanol produced from woody biomass may
Copyright 2002 by Marcel Dekker, Inc. All Rights Reserved.
be our most attractive options in this area; obviously, however, employment of
these does not eliminate CO
2
emissions.
Elimination of fossil fuel subsidies is vital to the creation of incentive for
increases in efficiency, a conservation measure whose potential is enormous.
A dramatic increase in exploitation of passive technologies and especially non-
carbon energy sources is essential. Of all the available forms of energy, solar
has the greatest potential for providing clean, safe, reliable power. Wind farms
also represent a significant potential means of producing energy with minimal
environmental impacts, and geothermal energy deserves thorough investigation
as well. During a period of transition to noncarbon energy sources, increased
exploitation of natural gas represents a means of reducing CO
2
emissions
significantly.
REFERENCES
1. D. E. Booth, The Environmental Consequences of Growth. London and New York:
Routledge, 1998.
2. International Energy Agency, World Energy Outlook, 1998 Edition. Paris: Organiza-
tion for Economic Co-operation and Development, 1998.
3. W. P. Cunningham and B. W. Saigo, Environmental Science. Dubuque, IA: William
C. Brown, 1997, 1992.
4. W. R. Cline, The Economics of Global Warming. Washington, DC: Institute for
International Economics, 1992.
5. J. H. Gibbons, P. D. Blair, and H. L. Gwin, Strategies for Energy Use. Sci. Am., vol.
261, no. 3, pp. 136–143, 1989.
6. J. J. MacKenzie, J.J. Energy and Environment in the 21st Century: The Challenge of
Change. In J. Byrne and D. Rich (eds.), Energy and Environment: The Policy
Challenge, New Brunswick, NJ: Transaction, 1992.
7. P. M. Vitousek, H. A. Mooney, J. Lubchenco, and J. M. Melillo, Human Domination
of Earth’s Ecosystems. Science, vol. 277, pp. 494–499, 1997.
8. A. Whyte, The Human Context. In H. Coward (ed.), Population, Consumption and
the Environment, pp. 41–59. Albany: State University of New York Press, 1995.
9. World Energy Council (WEC), Energy for Tomorrow’s World. New York: St. Martin’s
Press, 1993.
10. L. W. Canter, Environmental Impact Assessment, 2nd edition, p. 480, New York:
McGraw-Hill, 1995.
11. M. Ledbetter and M. Ross, Light Vehicles: Policies for Reducing Their Energy Use
and Environmental Impacts. In New Brunswick, NJ: Transaction, 1992. Energy and
Environment: The Policy Challenge, J. Burne and D. Rich (eds.), pp. 187–233.
12. Union of Concerned Scientists, Assessing the Hidden Costs of Fossil Fuels (briefing
paper). Cambridge, MA: Union of Concerned Scientists, 1993.
13. S. E. Manahan, Environmental Chemistry. Chelsea, MI: Lewis, 1991.
14. D. L. Johnson and L. A. Lewis, Land Degradation: Creation and Destruction.
Cambridge, MA, and Oxford, U.K. Blackwell, 1995.
15. Committee on Interior and Insular Affairs to Accompany HR 11500, Surface Mining
Copyright 2002 by Marcel Dekker, Inc. All Rights Reserved.
Control and Reclamation Act of 1974, HR93-1072. Washington, DC: U.S. House of
Representatives, 30 May 1974.
16. World Bank, Energy Efficiency and Conservation in the Developing World. New
York: World Bank, 1993.
17. R. U. Ayres, The Energy Policy Debate: A Case of Conflicting Paradigms. WEC J.,
vol. 111, p. 57, July 1992.
18. W. D. Ruckelshaus, Toward a Sustainable World. Sci. Am., vol. 261, no. 3, pp. 166–
174, 1989.
19. J. T. Lyle, Regenerative Design for Sustainable Development. New York: Wiley,
1994.
20. M. P. C. Munasinghe, Sustainable Energy Development: Issues and Policy. In P. R.
Kleindorfer, H. C. Kunreuther, and D. S. Hong (eds.), Energy, Environment and the
Economy, pp. 3–42. Brookfield, VT/Cheltenham, U.K.: Edward Elgar, 1996.
21. Union of Concerned Scientists, Solar Power: Energy for Today and Tomorrow.
Cambridge, MA: Union of Concerned Scientists, 1992.
22. E. Hirst and J. Ito, Justification of Electric-Utility Energy-Efficiency Programs. Oak
Ridge National Laboratory Report ORNL/CON-419, August 1995.
23. P. Ehrlich, and A. Ehrlich, The Population Explosion. New York: Simon & Schuster,
1990.
24. Union of Concerned Scientists, Cool Energy: The Renewable Solution to Global
Warmi ng. Cambridge, MA: Union of Concerned Scientists, 1991.
25. D. Abrahamson, Climatic Change and Energy Supply: A Comparison of Solar and
Nuclear Options. In J. Byrne and D. Rich (eds.), Energy and Environment: The Policy
Challenge, p. 430. New Brunswick, NJ: Transaction, 1992.
26. E. D. Enger and B. F. Smith, Environmental Science: A Study of Interrelationships.
Dubuque, IA: William C. Brown, 1995.
27. D. Tenenbaum, Tapping the Fire. Technol. Rev., vol. 2, pp. 39–47, 1995.
28. M. Renner, Assessing the Military’s War on the Environment. State of the World 1991.
New York: Norton, 1991.
29. United Nations Fund for Population Activities, State of the World Population 1990.
30. F. Ackerman, Why Do We Recycle? Washington, DC/Covelo, CA: Island Press, 1997.
31. J. MacNeill, Strategies for Sustainable Economic Development. Sci. Am., vol. 216,
no. 3, pp. 155–165, 1989.
32. D. W. Orr, Ecological Literacy. Albany, NY: SUNY Press, 1992.
33. World Bank, World Bank Development Report 1999. Hong Kong: Asia 2000, 1999.
34. U.S. Environmental Protection Agency, Acid Rain Program—Overview, EPA 430/F-
92/019. Washington, DC: EPA, 1992.
35. H. Friedli, H. Lötscher, H. Oeschger, U. Siegenthaler, and B. Stauffer, Ice Core
Record of the
13
C/
12
C Ratio of Atmospheric CO
2
in the Past Two Centuries. Nature,
vol. 324, no. 20, pp. 237–238, 1986.
36. A. Neftel, H. Oeschger, and B. Stauffer, Evidence from Polar Ice Cores for the
Increase in Atmospheric CO
2
in the Past Two Centuries. Nature, vol. 315, no. 2,
pp. 45–48, 1985.
37. National Academy of Sciences, Committee on Science, Engineering, and Public
Policy, Policy Implications of Greenhouse Warming: Mitigation, Adaptation, and the
Science Base. Washington, DC: National Academy Press, 1992.
Copyright 2002 by Marcel Dekker, Inc. All Rights Reserved.
8
Fundamentals of Heat Transfer
René Reyes Mazzoco
Universidad de las Américas–Puebla, Cholula, Mexico
1 HEAT TRANSFER MECHANISMS
1.1 Conduction
Conduction heat transfer is explained through the molecular motion in the solid’s
structure. Heat is transferred from one molecule to the adjacent molecule by
means of vibrational motion. This basic description points out that heat transfer
through a solid takes place entirely by conduction, and also states that it occurs
to a limited extent in liquids and gases because of their molecular mobility.
The mathematical formulation of conduction heat transfer was proposed by
Joseph Fourier while solving heat transfer problems in metal casting and tem-
plate. The first step for this formulation is the recognition that the amount of heat
transferred, q(W), from one point of a metal piece to another point of the same
medium (continuum) is proportional to the temperature difference between those
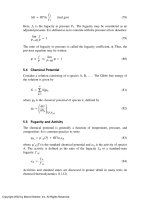
two points. The evaluation of the temperature difference through the derivative
in any direction (s) makes the measurement independent of any two specific
points and the distance between them:
q ∝
dT
ds
(1)
Copyright 2002 by Marcel Dekker, Inc. All Rights Reserved.