báo cáo hóa học:" Interferon signaling patterns in peripheral blood lymphocytes may predict clinical outcome after high-dose interferon therapy in melanoma patients" pptx
Bạn đang xem bản rút gọn của tài liệu. Xem và tải ngay bản đầy đủ của tài liệu tại đây (1.45 MB, 9 trang )
RESEARCH Open Access
Interferon signaling patterns in peripheral blood
lymphocytes may predict clinical outcome after
high-dose interferon therapy in melanoma
patients
Diana L Simons
1
, Gerald Lee
1
, John M Kirkwood
2*
and Peter P Lee
1*
Abstract
Background: High-dose Interferon (HDI) therapy produces a clinical response and achieves relapse-free survival in
20-33% of patients with operable high risk or metastatic melanoma. However, patients may develop significant side
effects frequently necessitating dose reduction or discontinuation of therapy. We recently showed that peripheral
blood lymphocytes (PBL) from some melanoma patients have impaired interferon (IFN) signaling which could be
restored with high concentrations of IFN. This exploratory study evaluated IFN signaling in PBL of melanoma
patients to assess whether the restoration of PBL IFN signaling may predict a beneficial effect for HDI in melanoma
patients.
Methods: PBL from 14 melanoma patients harvested on Day 0 and Day 29 of neoadjuvant HDI induction therapy
were analyzed using phosflow to assess their interferon signaling patterns through IFN-a induced phosphorylation
of STAT1-Y701.
Results: Patients who had a clinical response to HDI showed a lower PBL interferon signaling capacity than non-
responders at baseline (Day 0). Additionally, clinical respond ers and patients with good long-term outcome
showed a significant increase in their PBL interferon signaling from Day 0 to Day 29 compared to clinical non-
responders and patients that developed metastatic disease. The differences in STAT1 activation from pre- to post-
HDI treatment could distinguish between patients who were inclined to have a favorable or unfavorable outcome.
Conclusion: While the sample size is small, these results suggest that interferon signaling patterns in PBL correlate
with clinical responses and may predict clinical outcome after HDI in patients with melanoma. A larger
confirmatory study is warranted, which may yield a novel approach to select patients for HDI therapy.
Keywords: Melanoma High-Dose Interferon, Lymphocyte Signaling, STAT1
Background
High-dose Interferon (HDI) therapy produces a clinical
response and achieves relapse-free survival in 20-33% of
patients with operable high risk or metastatic melanoma
[1-9]. However, patients may develop significant side
effects frequently necessitating dose reduction or discon-
tinuation of therapy. Therefore, approaches to select
patients for initiation and/or maintenance on HDI ther-
apy would be very useful.
While interferon has been shown to induce anti-tumor
effects such as anti-proliferative, anti-vascular [10] and
pro-apoptotic effects [11], it has also been suggested
that HDI therapy mediates its effects through modulat-
ing the immune response [12]. Indeed development of
autoimmunity [13] and a certain serum cytokine profile
[14] have been shown to correlate with clinical
responses in HDI adjuvant treated melanoma patients.
Nonetheless, the mechanism of HDI’s immunomodula-
toryrolesisunclearanditisuncertainhowthese
* Correspondence: ;
1
Dept. of Medicine, Stanford University, Stanford, CA. USA
2
Dept. of Medicine, University of Pittsburgh, Pittsburgh, PA. USA
Full list of author information is available at the end of the article
Simons et al. Journal of Translational Medicine 2011, 9:52
/>© 2011 Simons et al; licensee BioMed Central Ltd. This is an Open Access article distributed under the terms of the Creative Commons
Attribu tion License ( which permits unrestricted use, distribution, and reproduction in
any medium, provided the original work is prope rly cited.
correspond with the autoimmune effects induced by IFN
therapy.
We recently showed that peripheral blood lympho-
cytes (PBL) from patients with melanoma and other
cancers have reduced phosphorylation of signal transdu-
cer and activators of tra nscription 1 ( pSTAT1) upon
Interferon-a (IFN-a) stimulation, demonstrating a
defect in Type I IFN signaling [15,16]. Moreover, suc h
defects could be partially restored by prolonged stimula-
tion with IFN [15]. This offered a possible mechanism
for the beneficial effect of HDI therapy in melanoma
patients, and also suggested a way to select patients for
therapy based on their PBL IFN signaling patterns.
Type I IFNs (a/b) have been recognized to have
important and diverse immunoregulatory functions.
These include promoting proliferation and clonal expan-
sion of CD4 and CD8 T cells [17-20], enhancing anti-
body production of B cells [21,22], and increasing
cytotoxic activity of natural killer cells (NK) and CD8 T
cells [23,24]. IFN also has negative effects on the activa-
tion and proliferation of T regulatory cells (Tregs) [25],
which are kno wn for their immunosuppressive roles in
cancer. With the advancement of flow cytometry-based
assays, signaling profiles of immune cells can be mea-
sured with increased sensitivity through phospho-flow
(phosflow) analysis, which provides the ability to con-
currently measure s ignaling activities within multiple
cell types.
In the present study, we measured IFN signaling
responses in peripheral blood lymphocytes from stage
IIIB-C melanoma patients taken before treatment and at
day 2 9 of neo-adjuv ant HDI therapy. In addition, all of
these patients continued on a maintenance regimen of
HDI post surgical resection. Archived peripheral blood
mononuclear cells (PBMCs) were assessed using phos-
flow to measure Type I IFN signaling responses through
IFN-a induced phosphorylation of STAT1-Y701 in
patients undergoing HDI therapy with known short-
term clinical responses and long-term clinical outcome.
This exploratory study found that there was a correla-
tion in PBL T cells between response to IFN-a induced
STAT1 activation and clinical responses during the
induction phase of HDI. Moreover, we were able to cor-
relate STAT1 activation in T cells from HDI treated
melanoma patients over the 4-week induction phase to
clinical outcome, demonst rating that measuring the IFN
signaling patterns in peripheral blood lymphocytes may
be useful to select patients who are more likely to bene-
fit from HDI maintenance therapy.
Methods
Patient Characteristics
Archived peripheral blood mononuclear cells (PBMCs)
from 14 Stage IIIB-C melanoma patients (a total of 28
PBMC samples, 14 acquired pre- and 14 acquired post-
HDI treatment) were analyzed for STAT1-Y701 phos-
phorylation (pSTAT1) levels by phosflow cytometry.
Patient demographics and clinical details are shown in
Table 1.
These patients participated in a clinical trial for
neoadjuvant therapy with HDI and their treatment has
been thoroughly described [12]. Briefly, the HDI induc-
tion phase consisted of IFN-a2b 20 million units (MU)/
m
2
per day intravenously, 5 days per week (Monday to
Friday) for 4 weeks. Following surgical resection,
patients were placed on a HDI maintenance regimen
Table 1 Patient characteristics and clinical outcome of HDI treated melanoma patients
Patient ID Age (y) * Gender Clinical Response Status at Follow-up HDI Completed Duration of Disease Free (mo) Current status
890 50 M CR MET Y, DR 32 Deceased
901 62 F NR MET Y 2 Deceased
903 45 M PR NED Y 86 Alive
973 59 M PR NED Y 54 Alive
974 70 F NR NED Y, DRx2 67 Alive
978 75 M PR MET Y 12 Deceased
980 56 F NR MET Y, DRx2 6 Deceased
983 45 M NR MET Y 6 Deceased
985 76 F PR NED Y, DR 65 Alive
1006 78 M PR MET Y 6 Deceased
1008 49 M PR NED Y, DR 61 Alive
1015 57 F PR MET Y 4 Deceased
1018 44 M PR NED Y 60 Alive
1052 54 M NR MET Y 19 Alive
NOTE: Adapted from ref.[12]
*Age at time of last contact.
HDI: High Dose IFN-a2b; CR: Complete Response; PR: Partial Response; NR: No Response; MET: Metastasis; NED: No Evidence of Disease; DR: Dose Reduction;
DRx2: Two Dose Reductions
Simons et al. Journal of Translational Medicine 2011, 9:52
/>Page 2 of 9
consisting of IFN-a2b 10 MU/m
2
per day subcuta-
neously, three times per week (Monday, Wednesday,
Friday) for 48 weeks. For each patient, blood samples
were taken before (Day 0-pre) and after the 4-week
induction phase of HDI (Day 29-post). Due to adverse
events, 5 patients underwent 1/3 dose reductions and
two of these patients required dose reductions twice
(Table 1). Phosphorylated STAT1 levels were measured
in lymphocytes, T cell subsets (both CD4 and CD8) and
B cells with or without stimulation of IFN-a for each of
these two time points. All patients signed informed con-
sentandthestudywasapprovedbytheUniversityof
Pittsburgh (Pittsburgh, PA) Institutional Review Board.
Interim responses were determined using WHO cri-
teria [26] and pat ients were classified as clinical respon-
ders or non-responders based on a measure o f tumor
reduction both clinically and histologically over the 4-
week induction phase of HDI therapy[12]. Among these
patients, 9 showed a complete response (n = 1) or par-
tial response (n = 8) and both were grouped into a sin-
gle responder group (R). Five patients did not exhibit a
clinical response and were grouped as non-responders
(NR).
For long-te rm clinical outcome, patients were further
classified as exhibiting no evidence of disease (NED) or
metastatic disease (MET) based on their status at the
time of follow-up (range 9-86 months) after completing
a maintenance regimen of 48 weeks. Six patients were
classified as NED and exhibited no evidence of metas-
tases at a minimum follow-up of 4.5 years. In contrast,
all of the 8 MET patients developed metastatic disease
within 3 years and three of these were d isease free for
up to 1 year (Table 1).
IFN-a Stimulation and Detection of pSTAT1-Y701 in HDI-
treated Melanoma PBMCs
IFN-a stimulation and detection of pS TAT1-Y701 in
cancer patients have been previously described [16] with
modifications.Briefly,cryopreserved PBMCs were
thawed and rested overnight in IMDM 10% FBS at 37°C
7% CO
2
. Cells were ficolled, resuspended to 2 × 10
6
cells per 50 μl in IMDM 5% human AB serum (HS) and
stained with mouse anti-human CD3 FITC, CD8 PE-
Cy7, CD4 PE-AF700 and CD19 PE-TR (Caltag-Invitro-
gen) for 30 minutes. IMDM 5%HS was added to each
tube and 1 × 10
6
cells were aliquoted per test. PBMCs
remained unstimulated or were stimulated with IFN- a
(NIAID Reference Reagent Repository) to a f inal con-
centration of 1000 IU/ml and inc ubated at 37°C 7%CO
2
for 15 minutes. Cells were fixed by formalin and incu-
batedat37°C7%CO
2
for 10 minutes. PBMCs were
washed twice with 1× PBS, resuspended in 1 ml of 1×
Custom Perm Buffer (#643435, BD Biosciences), and
incubated for 30 minutes at room temperature. Cells
were washed in wash buffer (1× PBS, 2% FBS, 0.09%
sodium azide), resuspended to exactly 50 μlandincu-
bated with mouse anti-human STAT1-pY701 Alexa
Fluor
®
647(BD Biosciences) for 1 hour at room tem-
perature. C ells were washed in wash buffer and put on
ice until analyzed by flow cytometry on a LSRII flow
cytometer (BD Biosciences). Paired pre-and correspond-
ing post- PBMC samples were assayed on the same day.
Data and Statistical Analysis
Flow cytometry FCS files were analyzed using FlowJo
8.5.3 (Treestar, ). Gating strategy
for the selection of lymphocytes, T cells and B cells are
shown in Additional File 1 Figure S1. The mean fluores-
cent intensity (MFI) of STAT1-pY701 Alexa Fluor
®
647
was calculated for all stimulat ed and unstimulated sam-
ples and fold changes were determined by dividing the
MFI of stimulated samples by the MFI of the corre-
sponding unstimulated samples. Basal levels of STAT1-
Y701 were determined by the MFI in unstimulated cells.
Kaplan-Meier survival curves were generated and the
correlation of IFN-a induced pSTAT1 with disease-free
and overall survival was estimated using the log-rank
test. For the purpose of these comparisons, a ratio for
each patients ’ lymphocytes were determi ned by dividing
the fold change in pSTAT1 post-treatment by the fold
change in pSTAT1 pre-treatment. A median of these
ratios was generated using all patients in the stu dy (n =
14) and patients were segregated according to whether
they fell within a range of ± 0.1 around the median.
Data was analyzed using Graphpad Prism 5.00 and the
R statistical package 2.7.1 . P-
values, estimated differences and 95% conf idence inter-
vals were calculated with R software from the Compre-
hensive R Archive Network using nonparametric
unpaired or paired two-sided Wilcoxon-Mann-Whitney
T-tests. The False Discovery Rate (FDR) was calculated
in R and used to adjust for multiple comparisons testing
[27]. A djusted P-values < 0.05 were considered signifi-
cant. Coefficient of variations (CV) was calculated by
dividing the standard d eviation with the mean of the
fold changes multiplied by 100.
Results
Differences in IFN responses between clinical responders
and non-responders
Initially, we compared STAT1-Y701 (pSTAT1) activatio n
from patients who underwent IFN dose reductions to
patients who did not undergo dose reductions (Table 1
data not shown) before and after the HDI induction phase.
Both unpaired and paired analyses showed no significant
changes in STAT1 activation between the patients who
had dose reductions and patients who did not undergo
dose reductions, and from day 0 to day 29 with HDI
Simons et al. Journal of Translational Medicine 2011, 9:52
/>Page 3 of 9
therapy. Subsequently, we addressed whether Type I I FN
signaling differed between HDI clinical responders and
clinical non-responders at day 0 or day 29 after HDI ther-
apy. The induction of pSTAT1 from IFN-a stimulation
was assessed by phosflow in PBMCs by examining the
overall median fold change. The median fold change of
IFN-a induced pSTAT1 in PBL from responders was
lowerthannon-respondersonday0(Figure1A),which
was observed in both CD4 and CD8 T cells, but these dif-
ferences were not statistically significant. In CD19 B cells,
a statistically significant difference was observed in the
median fold change of pSTAT1 induce d by IFN-a in
responders and non-responders on day 0 (Figure 1A). The
median fold change of pSTAT1 induce d by IFN-a in
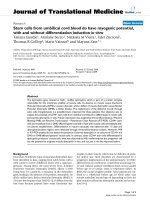
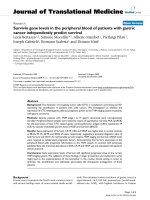
Figure 1 IFN-a induced f old change of pSTAT1-Y701 in PBMCs from responding and non-responding patients. PBMCs were stimulated
with 1000 IU/ml of IFN-a or remained unstimulated and pSTAT1 was assessed by phosflow. The IFN-a induced fold change in pSTAT1 was
measured in Lymphocytes, CD4 T cells, CD8 T cells and CD19 B cells. A) Unpaired analysis of PBMCs acquired before and after the 4 week
induction phase with HDI were compared between responders (R: pre- open circle, post- open square) and HDI non-responders (NR: pre- closed
circle, post- closed square). Two-sided Wilcoxon-Mann-Whitney unpaired analysis was used to compare between responding and non-
responding lymphocytes and lymphocyte subsets. (*
CD19: p = 0.028, 95% CI: 0.40 to 4.59, CV: pre-R 28.2%, pre-NR 30.9%). B) and C) Paired
analysis of HDI responders (R) and HDI non-responders (NR) lymphocytes were assessed for their response to IFN-a through STAT1 activation
before (pre-) and after (post-) the 4 week induction phase of HDI therapy. Two-sided Wilcoxon-Mann-Whitney paired analysis was used to
compare response levels of pSTAT1 in responding and non-responding melanoma patients. The fold change was calculated by dividing the
mean fluorescent intensity (MFI) of stimulated cells by the MFI of unstimulated cells. The median is indicated by the bar in each data set.
Adjusted P-values < 0.05 were considered significant. CVs were calculated by dividing the standard deviation with the mean of the fold changes
multiplied by 100. (*
Lymphocytes: p = 0.039, 95% CI:-3.52 to -0.57, CV: pre-R 25.6%, post-R 30.1%; * CD8: p = 0.039, 95% CI: -5.0 to -0.43, CV: pre-
R 19.6%, post-R 29.5%).
Simons et al. Journal of Translational Medicine 2011, 9:52
/>Page 4 of 9
lymphocytes and lymph ocyte subsets showed little or no
difference between responders and non-responders on day
29 (Figure 1A).
Changes in Type I IFN responses from day 0 to day 29 in
clinical responders and non-responders
We further investigated within the HDI-responding and
non-responding patients on day 0 and day 29 and exam-
ined the effect of HDI therapy on Type I IFN signaling.
Paired samples from pre-treated HDI PBMCs were com-
pared to lymphocytes from their corresponding post-
HDI treated PBMCs in both melanoma responding and
non-responding patients. Two-sided Wilcoxon-Mann-
Whitney paired analysis demonstrated that there was a
statistically significant increase in STAT1 activation
after HDI treatment in the responding group, and th e
response was equally observed in lymphocytes overall
and in CD8 T cell s (adjusted p-values 0.039, respec-
tively). CD4 T cells were on the cusp of significance
(adjusted p-value, 0.052) and B cells showed no signifi-
cant differences in STAT1 activation (adjusted p-value,
0.30) (Figure 1B). In contrast, there were no significant
differences in the response levels within any lymphocyte
subset of non-responders from pre- to post-HDI treat-
ment (Figure 1C). To determine whether the o verall
response was due to the basal levels of pSTAT1, we
analyzed changes in pSTAT1 in PBLs in unstimulated
cells from before to after HDI treatment. We found no
significant differences in the basal expression of
pSTAT1 from pre to post HDI treatment in both the
responding and non-responding patients (Figure 2A-B).
IFN signaling patterns and clinical outcome
It was observed that disease-free and overall survival was
longer amongst patients with a clinical response at day
29 compared w ith non-responders, although the results
did not reach statistical significance [12]. We investigated
the association of long-term clinical outcome with IFN-a
induced pSTAT1 levels in HDI treated melanoma patient
lymphocytes from Day 0 to Day 29. P aired-analysis was
used to compare patients who showed no evidence of
disease (NED) or who developed subsequent metastatic
disease (MET) at the time of clinical follow-up. NED
patients demonstrated a significant increase in the activa-
tion of STA T1 from Day 0 to Day 29 in lymphocytes and
both CD4 and CD8 T cells (adjusted p-values, 0.04
[Figure 3A, Additional File 2 Figure S2]). In contrast,
lymphocytes from MET patients d id not show a consis-
tent increase in the induction of pSTAT1 from IFN-a
stimulation from pre- to post-HDI therapy (Figure 3B).
Since STAT1 activation correlated with long-term
clinical outcome, we further examined pSTAT1
responses in lymphocytes with disease-free and overall
survival. A ratio for each patient’ s lymphocytes was
determined by dividing the fold change in pSTAT1
post-treatment by the fold change in pSTAT1 pre-treat-
ment. A median of these ratios (1.25) was generated
using all patients in the study (n = 14) and patients
were segregated according to whether they fell within a
range of ± 0.1 around the median. Patients whose
pSTAT1 ratios fell within this range had better disease-
free and overall survival (Figure 4A-B, respectively) as
compared to patients who had minimal or negative sig-
naling changes ( median <1.15), and interestingly, also
patients who had larger increases from pre- to post-
HDI treatment (median >1.35).
Discussion
Previously, we have demonstrated in two independent
cohorts impaired IFN signaling and downstream
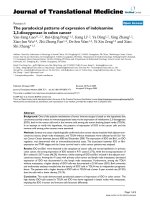
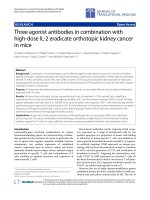
Figure 2 Basal levels o f pSTAT1-Y701 in PBMC subsets from
HDI treated responders and non-responders. Changes in basal
response levels of pSTAT1 before (pre-) and after (post-) the 4 week
induction phase with HDI were compared in Lymphocytes, CD4 and
CD8 T cells, and CD19 B cells in HDI treated A) responding and B)
non-responding melanoma patients. Two-sided paired Wilcoxon-
Mann-Whitney tests were performed on melanoma patient’s pre-
and corresponding post- PBMCs. Adjusted P-values < 0.05 were
considered significant.
Simons et al. Journal of Translational Medicine 2011, 9:52
/>Page 5 of 9
functional consequences in PBLs from patients with
minimally metastatic stage III and widely metastatic
stage IV melanoma as compared to healthy controls
[15,16]. In the current study, we analyzed serial PBMC
samples obtained from patients before and after the
induction phase of HDI in a new independent cohort of
minimally metastatic stage IIIb and IIIc melanoma
patients to a dvance our current un derstanding of
immune dysfunction in cancer. This exploratory study
demonstrated that patients with high-risk operabl e
nodal involvement with melanoma who had a clinical
response to high dose IFN-a2b therapy over the 4-week
induction phase of neoadjuvant therapy had a significant
increase in STAT1 activation in peripheral blood T
cells, but not B cells, upon IFN-a stimulation from Day
0 to Day 29. Moreover, this increase in pSTAT1 in per -
ipheral blood T cells also correlated with good clinical
outcome suggesting the efficacy of HDI in the clinical
responders may be due, as least in part, to augmentation
of their pSTAT1 responsiveness.
Moreover, the differences in STAT1 activation from
pre- to post- HDI treat ment could distinguish patients
who were inclined to have a favorable or unfavorable
outcome. As expected, patients who had minimal or
negative changes in pSTAT1 (median ratio < 1.15) had
poor outcome. Of patients who showed increased
pSTAT1 signaling after HDI therapy, only patients who
displayed modest augmentation (median ratio 1.15 -
1.35) had good outcome. Interestingly, patients who had
‘hyper’ IFN signaling responses (median ratio >1.35) of
pSTAT1 pre- to post- HDI therapy had poor o utcome,
similar to those who has minimal or negative changes.
These results warrant further confirmation in a larger
patient cohort to investigate the underlyi ng mechanisms
by which HDI alters IFN signaling patterns in patients
with different clinical outcomes.
Assessing the IFN signaling patterns in peripheral
blood T cells from melanoma patients from Day 0 to
Day 29 HDI therapy may be a clinically useful approach
to select patients who would be more inclined to benefit
from further treatment, and hence should be maintained
on HDI. A trend was observed which showed that
responding patients, prior to HDI therapy, have a lower
response to IFN-a induced pSTAT1 compared t o those
of the non-responding patients. We have previously
found two subsets of IFN responses in melanoma
patients, IFN low-responders and IFN high-responders
[15]. We showed that in IFN low-responders, prolonged
in vitro stimulation with high doses of IFN partially
restore d IFN signaling, suggesting a possible mechanism
for the beneficial effect of HDI therapy in these mela-
noma patients. Prior to initiation with HDI (pre),
reduced activation of STAT1 in the responding patients
compared to the non-responding patients may be
explained in that this patient subset exhibited a severe
impairment in IFN signaling which was restored during
the initiation phase of HDI therapy. In contrast, patients
who had higher levels of STAT1 activation prior to the
HDI initiation phase may not have had an IFN signaling
defect and therefore, would not have benefited from
HDI therapy. In our previous study [16], the differences
in the median activation of pSTAT1 between melanoma
patients and healthy controls were 1.6 fold were as, in
the current study, the median differences in STAT1
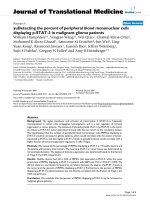
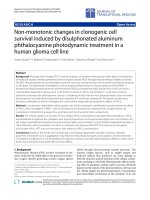
Figure 3 Correlation of IFN-a induced pSTAT1 and lon g-term
clinical outcome in HDI patients. At the time of clinical follow-up,
patients were classified as exhibiting no evidence of disease (NED)
or metastases (MET). The IFN-a induced fold change of pSTAT1 in
melanoma patients’ lymphocytes and lymphocyte subsets were
assessed in patients exhibiting A) NED and, B) MET before (pre-)
and after (post-) the HDI induction phase. Two-sided paired
Wilcoxon-Mann-Whitney tests were performed on melanoma
patients pre- and corresponding post- PBMCs and adjusted P-values
< 0.05 were considered significant. CVs were calculated by dividing
the standard deviation with the mean of the fold changes
multiplied by 100. (
*Lymphocytes: p = 0.042, 95% CI: -3.12 to -0.25,
CV: pre-NED 37.4%, post-NED 34%;
*CD4: p = 0.042, 95% CI: -4.77 to
-0.48, CV: pre-NED 39.6%, post-NED 36.9%; *
CD8: p = 0.042, 95% CI:
-5.12 to -0.13, CV: pre-NED 30.2%, post-NED 29.9%).
Simons et al. Journal of Translational Medicine 2011, 9:52
/>Page 6 of 9
activation between the responders and non-responders
were 1.4 fold.
Though B cells showed a s ignificantly lower trend in
overall STAT1 activation in responders compared to non-
responders before HDI, there was no significant increase
in STAT1 activation during the induction phase of HDI in
the responding group, and interestingly, non-responders
exhibited decreased overall STAT1 activation. It has been
reported that subsets of immune cells respond differently
to IFNs [28,29] and that in the presence of high amounts
of exogenous IFNs, downregulation of the receptors may
occur as a negative feed back mechanism [30 ], thereby
reducing responsiveness to IFNs. Additionally, reduced
responsiveness in leukocytes may reflect the effects of a
high tumor burden whereby tumor cells secreting immu-
nosuppressive cytokines, such as IL-10 and TGF-b, have
been shown to induce expression of STAT1 negative regu-
lators such as the suppressors of cytokine signaling
(SOCS) proteins and Src homology 2 (SH2)-containing
phosphatase-1 and -2 and CD45 [31-33], thereby inhibit-
ing the anti-tumor activity of immune effector cells [34].
Tregs and myeloid-derived suppressor cells, known for
their suppressive roles on immune cells [35-37] in cancer,
may also contribute to reduced responsiveness to HDI.
Altered plasma or serum cytokine profiles in cancer
patients [38,39] may predispose peripheral blood leuko-
cytes to impaired IFN signaling.
There w as variation and overlap between the respon-
der and non-responder groups. We and others have pre-
viously described variation of signaling responses in
melanoma patients’ PBMCs using phosflow [15,40,41],
suggesting that signaling abnormalities may not arise in
all p atients, but rather in a subset of patients. Variable
responsiveness may explain the small differences
observed between the clinical responders and non-
responders. The sample size of this study was too small
(14 patients) to be conclusive, but these results warrant
a larger confirmatory study.
The importance of STAT1 in IFN signalin g has been
demonstrated in STAT1 k nockout mice where STAT1
deficient mice were more likely to develop spontaneous
tumors than wild type mice [42], and were more suscep-
tible to viruses and pathogens showing an IFN-dependent
link to STAT1 [43]. Previous studies have attempted to
link pSTAT1 (and pSTAT3) levels in tumor c ells and
lymphocytes to clinical outcome of melanoma patients
receiving interferon treatment [44,45]. Patients with
higher pSTAT1/pSTAT3 ratios in pretreated lymph node
biopsy tissues had better clinical outcome [44]; however,
these studies did not find a correlation between
pSTAT1/pSTAT3 ratios among lymphocytes of regional
lymph nodes and survival. One novelty in the present
study is to consider pSTAT1 levels in different subsets of
peripheral blood lymphocytes.
The use of immune profiles as a prognostic tool to
determine melanoma patient survival has been studied,
such as using quantification of tumor infiltrating lym-
phocytes (TILs) in metastatic lesions [46], as well as
gene expression profiling of TILs and CD3 T cells from
primary cutaneous melanoma where the genes that were
Figure 4 Disease-free and overall survival analysis in melanoma patient lymphocytes. Kaplan-Meier survival curves were generated to
assess the correlation of STAT1 activation with A) disease-free survival (p = 0.062) and, B) overall survival (p = 0.088). A ratio for each patient
was calculated by dividing the fold induction of pSTAT1 in post-treated lymphocytes by the fold induction of pSTAT1 in pre-treated
lymphocytes (post/pre). A median of these ratios was generated (1.25) using all patients in the study (n = 14) and patients were segregated
according to whether they fell within a range of ± 0.1 around the median. P-values < 0.05 were considered significant.
Simons et al. Journal of Translational Medicine 2011, 9:52
/>Page 7 of 9
positively associated with survival were mainly related to
the immune response [47]. Beyond these prognostic
implications, assessing STAT1 activation in PBL of mel-
anoma patients may provide an additional predictive
tool to guide the application of HDI therapy.
Conclusion
While the sample si ze was size, we have fo und encoura-
ging results whic h point to measuring STAT1 activation
in PBL T cells from Stage IIIB-C melanoma patients to
stratify patients according to their potential to benefit
from HDI. These results build upon prior studies of
patients with advanced melanoma, and warrant confir-
matory studies with a larger cohort of melanoma
patients who are to receive HDI therapy. This is cur-
rently planned in the context of new intergroup studies
of HDI. Other agents that enhance IFN signaling in T
cells may be developed as novel therapy for melanoma,
especially those that do not have the side effects of HDI.
Additional material
Additional file 1: Figure S1. Gating of lymphocytes, T cells and B
cells for phosflow analysis. A) Lymphocytes were gated based on their
FSC and SSC properties. B) Within the lymphocyte gate, B cells were
selected by gating on CD19+CD3- events and T cells were selected by
gating on CD3+CD19- events. C) T cells were further divided into CD4
+CD8- T helper cells and CD4-CD8+ cytotoxic T cells. D) Phosphorylation
of STAT1-Y701 is demonstrated in stimulated cells (blue line) versus
unstimulated cells (red line).
Additional file 2: Figure S2. IFN-induced pSTAT1 expression in
lymphocytes. Histogram overlays were generated for unsti mulated (thin
black line) and IFN-a stimulated (bold black line) lymphocytes for A) NED
and B) MET patients before HDI therapy (open histograms) and after
(shaded histograms) 29 days with HDI therapy. * Indicates melanoma
patients that were clinical non-responders. CVs were calculated by
dividing the standard deviation with the mean of the fold changes
multiplied by 100. CV: pre-NED 37.4%, post-NED 34%, pre-MET 21.8%,
post-MET 31.5%.
Acknowledgements and Funding
We thank Dr. Skip Maino and Maria Suni (BD Biosciences, San Jose, CA) for
helpful advice and the Custom Perm Buffer for phosflow. We thank Ning
Yan, Andrea Miyahira, Neta Zuckerman, and Hongxiang Yu for their insightful
contribution to the manuscript. We thank Cindy Sander for her technical
assistance.
This work was in part supported by Award Number P50CA121973 from the
National Cancer Institute. This work was supported at the UPCI by the P50
SPORE in Skin Cancer CA121973 from the National Cancer Institute. The
content is solely the responsibility of the authors and does not necessarily
represent the official views of the National Cancer Institute or the National
Institutes of Health.
Author details
1
Dept. of Medicine, Stanford University, Stanford, CA. USA.
2
Dept. of
Medicine, University of Pittsburgh, Pittsburgh, PA. USA.
Authors’ contributions
PL and JK designed the study. JK provided the clinical samples. DS and GL
carried out the experiments. DS, GL, JK, and PL analyzed the results, and
wrote the manuscript. All authors read and approved the final manuscript.
Competing interests
The authors declare that they have no competing interests.
Received: 9 February 2011 Accepted: 5 May 2011 Published: 5 May 2011
References
1. Tarhini AA, Kirkwood JM: Clinical and immunologic basis of interferon
therapy in melanoma. Ann N Y Acad Sci 2009, 1182:47-57.
2. Elsasser-Beile U, Drees N, Neumann HA, Schopf E: Phase II trial of
recombinant leukocyte A interferon in advanced malignant melanoma. J
Cancer Res Clin Oncol 1987, 113:273-278.
3. Creagan ET, Schaid DJ, Ahmann DL, Frytak S: Recombinant interferons in
the management of advanced malignant melanoma. Updated review of
five prospective clinical trials and long-term responders. Am J Clin Oncol
1988, 11:652-659.
4. Kirkwood JM, Manola J, Ibrahim J, Sondak V, Ernstoff MS, Rao U: A pooled
analysis of eastern cooperative oncology group and intergroup trials of
adjuvant high-dose interferon for melanoma. Clin Cancer Res 2004,
10:1670-1677.
5. Wheatley K, Ives N, Hancock B, Gore M, Eggermont A, Suciu S: Does
adjuvant interferon-alpha for high-risk melanoma provide a worthwhile
benefit? A meta-analysis of the randomised trials. Cancer Treat Rev 2003,
29:241-252.
6. Pirard D, Heenen M, Melot C, Vereecken P: Interferon alpha as adjuvant
postsurgical treatment of melanoma: a meta-analysis. Dermatology 2004,
208:43-48.
7. Mitchell MS, Abrams J, Thompson JA, Kashani-Sabet M, DeConti RC,
Hwu WJ, Atkins MB, Whitman E, Ernstoff MS, Haluska FG, et al: Randomized
trial of an allogeneic melanoma lysate vaccine with low-dose interferon
Alfa-2b compared with high-dose interferon Alfa-2b for Resected stage
III cutaneous melanoma. J Clin Oncol 2007, 25:2078-2085.
8. Pectasides D, Dafni U, Bafaloukos D, Skarlos D, Polyzos A, Tsoutsos D,
Kalofonos H, Fountzilas G, Panagiotou P, Kokkalis G, et al: Randomized
phase III study of 1 month versus 1 year of adjuvant high-dose
interferon alfa-2b in patients with resected high-risk melanoma. J Clin
Oncol 2009, 27:939-944.
9. Mocellin S, Pasquali S, Rossi CR, Nitti D: Interferon alpha adjuvant therapy
in patients with high-risk melanoma: a systematic review and meta-
analysis. J Natl Cancer Inst 2010, 102:493-501.
10. Dvorak HF, Gresser I: Microvascular injury in pathogenesis of interferon-
induced necrosis of subcutaneous tumors in mice. J Natl Cancer Inst
1989, 81:497-502.
11. Thyrell L, Erickson S, Zhivotovsky B, Pokrovskaja K, Sangfelt O, Castro J,
Einhorn S, Grander D: Mechanisms of Interferon-alpha induced apoptosis
in malignant cells. Oncogene 2002, 21:1251-1262.
12. Moschos SJ, Edington HD, Land SR, Rao UN, Jukic D, Shipe-Spotloe J,
Kirkwood JM: Neoadjuvant treatment of regional stage IIIB melanoma
with high-dose interferon alfa-2b induces objective tumor regression in
association with modulation of tumor infiltrating host cellular immune
responses. J Clin Oncol 2006, 24:3164-3171.
13. Gogas H, Ioannovich J, Dafni U, Stavropoulou-Giokas C, Frangia K,
Tsoutsos D, Panagiotou P, Polyzos A, Papadopoulos O, Stratigos A, et al:
Prognostic significance of autoimmunity during treatment of melanoma
with
interferon. N
Engl J Med 2006, 354:709-718.
14. Yurkovetsky ZR, Kirkwood JM, Edington HD, Marrangoni AM,
Velikokhatnaya L, Winans MT, Gorelik E, Lokshin AE: Multiplex analysis of
serum cytokines in melanoma patients treated with interferon-alpha2b.
Clin Cancer Res 2007, 13:2422-2428.
15. Critchley-Thorne RJ, Yan N, Nacu S, Weber J, Holmes SP, Lee PP: Down-
regulation of the interferon signaling pathway in T lymphocytes from
patients with metastatic melanoma. PLoS Med 2007, 4:e176.
16. Critchley-Thorne RJ, Simons DL, Yan N, Miyahira AK, Dirbas FM, Johnson DL,
Swetter SM, Carlson RW, Fisher GA, Koong A, et al: Impaired interferon
signaling is a common immune defect in human cancer. Proc Natl Acad
Sci USA 2009, 106:9010-9015.
17. Dondi E, Roue G, Yuste VJ, Susin SA, Pellegrini S: A dual role of IFN-alpha
in the balance between proliferation and death of human CD4+ T
lymphocytes during primary response. J Immunol 2004, 173:3740-3747.
18. Havenar-Daughton C, Kolumam GA, Murali-Krishna K: Cutting Edge: The
direct action of type I IFN on CD4 T cells is critical for sustaining clonal
Simons et al. Journal of Translational Medicine 2011, 9:52
/>Page 8 of 9
expansion in response to a viral but not a bacterial infection. J Immunol
2006, 176:3315-3319.
19. Curtsinger JM, Valenzuela JO, Agarwal P, Lins D, Mescher MF: Type I IFNs
provide a third signal to CD8 T cells to stimulate clonal expansion and
differentiation. J Immunol 2005, 174:4465-4469.
20. Kolumam GA, Thomas S, Thompson LJ, Sprent J, Murali-Krishna K: Type I
interferons act directly on CD8 T cells to allow clonal expansion and
memory formation in response to viral infection. J Exp Med 2005,
202:637-650.
21. Le Bon A, Thompson C, Kamphuis E, Durand V, Rossmann C, Kalinke U,
Tough DF: Cutting edge: enhancement of antibody responses through
direct stimulation of B and T cells by type I IFN. J Immunol 2006,
176:2074-2078.
22. Giordani L, Sanchez M, Libri I, Quaranta MG, Mattioli B, Viora M: IFN-alpha
amplifies human naive B cell TLR-9-mediated activation and Ig
production. J Leukoc Biol 2009, 86:261-271.
23. Jewett A, Bonavida B: Interferon-alpha activates cytotoxic function but
inhibits interleukin-2-mediated proliferation and tumor necrosis factor-
alpha secretion by immature human natural killer cells. J Clin Immunol
1995, 15:35-44.
24. Bose A, Baral R: IFNalpha2b stimulated release of IFNgamma differentially
regulates T cell and NK cell mediated tumor cell cytotoxicity. Immunol
Lett 2007, 108:68-77.
25. Golding A, Rosen A, Petri M, Akhter E, Andrade F: Interferon-alpha
regulates the dynamic balance between human activated regulatory
and effector T cells: implications for antiviral and autoimmune
responses. Immunology 2010.
26. Miller AB, Hoogstraten B, Staquet M, Winkler A: Reporting results of cancer
treatment. Cancer 1981, 47:207-214.
27. Benjamini Y, D Y: The control of the false discovery rate in multiple
testing under dependency. Annals of Statistics 2001, 29:1165-1188.
28. Waddell SJ, Popper SJ, Rubins KH, Griffiths MJ, Brown PO, Levin M,
Relman DA: Dissecting interferon-induced transcriptional programs in
human peripheral blood cells. PLoS One 2010, 5:e9753.
29. van Boxel-Dezaire AH, Zula JA, Xu Y, Ransohoff RM, Jacobberger JW,
Stark GR: Major Differences in the Responses of Primary Human
Leukocyte Subsets to IFN-{beta}. J Immunol 2010, 185:5888-5899.
30. Tochizawa S, Akamatsu S, Sugiyama Y, Muraguchi M, Ohmoto Y, Ono Y,
Ishikawa H, Tanigami A, Sumida T, Mori T: A flow cytometric method for
determination of the interferon receptor IFNAR2 subunit in peripheral
blood leukocyte subsets. J Pharmacol Toxicol Methods 2004, 50:59-66.
31. Ito S, Ansari P, Sakatsume M, Dickensheets H, Vazquez N, Donnelly RP,
Larner AC, Finbloom DS: Interleukin-10 inhibits expression of both
interferon alpha- and interferon gamma- induced genes by suppressing
tyrosine phosphorylation of STAT1. Blood 1999,
93:1456-1463.
32. Park IK, Shultz LD, Letterio JJ, Gorham JD: TGF-beta1 inhibits T-bet
induction by IFN-gamma in murine CD4+ T cells through the protein
tyrosine phosphatase Src homology region 2 domain-containing
phosphatase-1. J Immunol 2005, 175:5666-5674.
33. Fox SW, Haque SJ, Lovibond AC, Chambers TJ: The possible role of TGF-
beta-induced suppressors of cytokine signaling expression in osteoclast/
macrophage lineage commitment in vitro. J Immunol 2003,
170:3679-3687.
34. Zimmerer JM, Lesinski GB, Kondadasula SV, Karpa VI, Lehman A,
Raychaudhury A, Becknell B, Carson WE: IFN-alpha-induced signal
transduction, gene expression, and antitumor activity of immune
effector cells are negatively regulated by suppressor of cytokine
signaling proteins. J Immunol 2007, 178:4832-4845.
35. Viguier M, Lemaitre F, Verola O, Cho MS, Gorochov G, Dubertret L,
Bachelez H, Kourilsky P, Ferradini L: Foxp3 expressing CD4+CD25(high)
regulatory T cells are overrepresented in human metastatic melanoma
lymph nodes and inhibit the function of infiltrating T cells. J Immunol
2004, 173:1444-1453.
36. Serafini P, Borrello I, Bronte V: Myeloid suppressor cells in cancer:
recruitment, phenotype, properties, and mechanisms of immune
suppression. Semin Cancer Biol 2006, 16:53-65.
37. Marigo I, Dolcetti L, Serafini P, Zanovello P, Bronte V: Tumor-induced
tolerance and immune suppression by myeloid derived suppressor cells.
Immunol Rev 2008, 222:162-179.
38. Krasagakis K, Tholke D, Farthmann B, Eberle J, Mansmann U, Orfanos CE:
Elevated plasma levels of transforming growth factor (TGF)-beta1 and
TGF-beta2 in patients with disseminated malignant melanoma. Br J
Cancer 1998, 77:1492-1494.
39. Saito H, Tsujitani S, Oka S, Kondo A, Ikeguchi M, Maeta M, Kaibara N: An
elevated serum level of transforming growth factor-beta 1 (TGF-beta 1)
significantly correlated with lymph node metastasis and poor prognosis
in patients with gastric carcinoma. Anticancer Res 2000, 20:4489-4493.
40. Lesinski GB, Kondadasula SV, Crespin T, Shen L, Kendra K, Walker M,
Carson WE: Multiparametric flow cytometric analysis of inter-patient
variation in STAT1 phosphorylation following interferon Alfa
immunotherapy. J Natl Cancer Inst 2004, 96:1331-1342.
41. Varker KA, Kondadasula SV, Go MR, Lesinski GB, Ghosh-Berkebile R,
Lehman A, Monk JP, Olencki T, Kendra K, Carson WE: Multiparametric flow
cytometric analysis of signal transducer and activator of transcription 5
phosphorylation in immune cell subsets in vitro and following
interleukin-2 immunotherapy. Clin Cancer Res 2006, 12:5850-5858.
42. Kaplan DH, Shankaran V, Dighe AS, Stockert E, Aguet M, Old LJ,
Schreiber RD: Demonstration of an interferon gamma-dependent tumor
surveillance system in immunocompetent mice. Proc Natl Acad Sci USA
1998, 95:7556-7561.
43. Meraz MA, White JM, Sheehan KC, Bach EA, Rodig SJ, Dighe AS, Kaplan DH,
Riley JK, Greenlund AC, Campbell D, et al: Targeted disruption of the Stat1
gene in mice reveals unexpected physiologic specificity in the JAK-STAT
signaling pathway. Cell 1996, 84:431-442.
44. Wang W, Edington HD, Rao UN, Jukic DM, Land SR, Ferrone S, Kirkwood JM:
Modulation of signal transducers and activators of transcription 1 and 3
signaling in melanoma by high-dose IFNalpha2b.
Clin Cancer Res 2007,
13:1523-1531.
45. Humpolikova-Adamkova L, Kovarik J, Dusek L, Lauerova L, Boudny V, Fait V,
Fojtova M, Krejci E, Kovarik A: Interferon-alpha treatment may negatively
influence disease progression in melanoma patients by hyperactivation
of STAT3 protein. Eur J Cancer 2009, 45:1315-1323.
46. Clemente CG, Mihm MC, Bufalino R, Zurrida S, Collini P, Cascinelli N:
Prognostic value of tumor infiltrating lymphocytes in the vertical growth
phase of primary cutaneous melanoma. Cancer 1996, 77:1303-1310.
47. Bogunovic D, O’Neill DW, Belitskaya-Levy I, Vacic V, Yu YL, Adams S,
Darvishian F, Berman R, Shapiro R, Pavlick AC, et al: Immune profile and
mitotic index of metastatic melanoma lesions enhance clinical staging
in predicting patient survival. Proc Natl Acad Sci USA 2009,
106:20429-20434.
doi:10.1186/1479-5876-9-52
Cite this article as: Simons et al.: Interferon signaling patterns in
peripheral blood lymphocytes may predict clinical outcome after high-
dose interferon therapy in melanoma patients. Journal of Translational
Medicine 2011 9:52.
Submit your next manuscript to BioMed Central
and take full advantage of:
• Convenient online submission
• Thorough peer review
• No space constraints or color figure charges
• Immediate publication on acceptance
• Inclusion in PubMed, CAS, Scopus and Google Scholar
• Research which is freely available for redistribution
Submit your manuscript at
www.biomedcentral.com/submit
Simons et al. Journal of Translational Medicine 2011, 9:52
/>Page 9 of 9