báo cáo hóa học:" Comparative study of clinical grade human tolerogenic dendritic cells" potx
Bạn đang xem bản rút gọn của tài liệu. Xem và tải ngay bản đầy đủ của tài liệu tại đây (1024 KB, 14 trang )
RESEARCH Open Access
Comparative study of clinical grade human
tolerogenic dendritic cells
M Naranjo-Gómez
1
, D Raïch-Regué
1
, C Oñate
1
, L Grau-López
2
, C Ramo-Tello
2
, R Pujol-Borrell
1
, E Martínez-Cáceres
1†
and Francesc E Borràs
1*†
Abstract
Background: The use of tolerogenic DCs is a promising therapeutic strategy for transplantation and autoimmune
disorders. Immunomodulatory DCs are primarily generated from monocytes (MDDCs) for in vitro experiments
following protocols that fail to fulfil the strict regulatory rules of clinically applicable products. Here, we compared
the efficacy of three different tolerance-inducing agents, dexamethasone, rapamycin and vitamin D3, on DC
biology using GMP (Good Manufacturing Practice) or clinical grade reagents with the aim of defining their use for
human cell therapy.
Methods: Tolerogenic MDDCs were generated by adding tolerogenic agents prior to the induction of maturation
using TNF-a, IL- b and PGE2. We evaluated the effects of each agent on viability, efficiency of differentiation,
phenotype, cytokine secretion and stability, the stimulatory capacity of tol-DCs and the T-cell profiles induced.
Results: Differences relevant to therapeutic applicability were observed with the cellular products that were
obtained. VitD3-induced tol-DCs exhibited a slightly reduced viabi lity and yield compared to Dexa-and Rapa-tol-
DCs. Phenotypically, while Dexa-and VitD3-tol-DCs were similar to immature DCs, Rapa-tol-DCs were not
distinguishable from mature DCs. In addition, only Dexa-and moderately VitD3-tol-DCs exhibited IL-10 production.
Interestingly, in all cases, the cytokine secretion profiles of tol-DCs were not modified by a subsequent TLR
stimulation with LPS, indicating that all products had stable phenotypes. Functionally, clearly reduced alloantigen T
cell proliferation was induced by tol-DCs obtained using any of these agent. Also, total interferon-gamma (IFN-g)
secretion by T cells stimulated with allogeneic tol-DCs was reduced in all three cases, but only T cells co-cultured
with Rapa-tol-DCs showed impaired intracellular IFN-g production. In addition, Rapa-DCs promoted CD4+ CD127
low/negative CD25high and Foxp3+ T cells.
Conclusions: Our results demonstrate contrasting influences of different clinical-grade pharmacological agents on
human tol-DC generation. This should be taken into account for decisions on the use of a specific agent for the
appropriate cellular therapy in the context of a particular disease.
Background
Autoimmune diseases are characterized by the loss of
tolerance toward self-antigens and the induction of
destructive immune resp onses leading to tissue damage.
Most patients with autoimmune diseases are treated
with immunosuppressive drugs that induce a generalized
immune suppression, which increases the risk of infec-
tious diseases and cancer [1]. Thus, induction of toler-
ance is an important goal for treating autoimmune
disorders or to prevent undesirable immune responses
against allogeneic transplants [2-8].
Research in recent years has primarily focused on
developing more selective immunosuppress ive or immu-
nomodulatory therapies with fewer side effects and with
the potential for long-term disease remission. In this
context, the use of antigen-specific tolerogenic dendritic
cells (tol-DCs) that target autoreactive T cells is an
attractive strategy, with the aim of reprogramming the
* Correspondence:
† Contributed equally
1
Laboratory of Immunobiology for Research and Diagnosis (LIRAD). Blood
and Tissue Bank (BTB); Dept. of Cell Biology, Physiology and Immunology,
Universitat Autònoma de Barcelona, Institut Investigació Germans Trias i
Pujol, Spain
Full list of author information is available at the end of the article
Naranjo-Gómez et al. Journal of Translational Medicine 2011, 9:89
/>© 2011 Naranjo-Gómez et al; licensee BioMed Central Ltd. This is an Open Access articl e distributed under the terms of the Creati ve
Commons Attribution License ( which permits unrestricted use, distribution, and
reprodu ction in any medium, provided the original work is pro perly cited.
immune system for the treatment of autoimmune disor-
ders [9-11].
Dendritic cells (DCs) are professional antigen-present-
ing cells that have the potential to either stimulate or
inhibit immune responses [12-15]. Their broad range of
powerful immune stimulatory and regulatory functions
has placed DCs at centre stage of active immunotherapy
[16-23]. Dendritic cells maintain immune tolerance to
self-antigens by deleting or controlling the pathogenicity
of autoreactive T-cells. Modifications of DCs i n the
laboratory can enhance and stabilise their tolerogenic
properties, and several pharmacological agents, such as
dexamethasone (Dexa), rapamycin (Rapa) and vitamin
D3 (VitD3), may promote the tolerogenic activities of
DCs [24,25]. It has been widely reported that such
maturation-resistant DCs can regulate autoreactive or
alloreactive T-cell responses and promote or restore
antigen-specific tolerance in experimental animal models
[26-36].
Yet, the current challenge is to move tol-DCs from the
bench to the bedside [37-41], and one of the major tasks
is to translat e laboratory protocols into clinically-ap plic-
able procedures. Currently, information on different tol-
erogenic cellular products can be found at the research
level. Therefore, a systematic comparison of the required
functional characteristics of the various clinical tolero-
genic DCs is necessary.
In this study, we compared the effects of three immu-
nomodulatory agents: Dexa, Rapa and VitD3, on tol-
DCs generation using clinical grade reagents. We
describe both the convenient and inconvenient aspects
of each different “t olerogenic cellular products” to
induce tolerance and discuss the eligibility of each cellu-
lar product for particular therapeutic scenarios.
Methods
Culture Media and reagents
Culture medium used was X-VIVO 15 (BioWhittaker
®
,
Lonza, Belgium) supplemented with 2% (vol/vol) heat-
inactivated AB human serum (BioWhittaker
®
,Lonza,
Belgium), 2 mM L-glutamine (Sigma-Aldrich Company
LTD, Saint Louis, MO, USA), 100 U/mL penicillin
(Cepa S.L, Madrid, Spain), and 100 μg/mL streptomycin
(Laboratorios Normon S.A, Madrid, Spain).
Monoclonal Antibodies
The following murine mAbs were used. FITC-labelled
mAbs: CD86 and Foxp3 (BD Biosciences, CA, USA);
PE-labelled mAbs: CD14 (ImmunoTools GmbH, Ger-
many), CD40 and CD127 (BD Biosciences); PerCP-
labelled mAb: CD3 (BD Bioscience s); PE-Cyanine dye 5-
labelled mAb: CD25 (BD Biosciences); PE-Cyanine dye
7-labelled mAb: CD14 (BD Biosciences); Allophycocya-
nin (APC)-labelled mAbs: CD83, CD4 and anti-IFN- g
(BD Biosciences); APC-H7-labelled m Ab: HLA-DR (BD
Biosciences).
Immunostaining and flow cytometry
Cells were washed, resuspended in 50 μlofPBSand
incubated with mAbs for 15-18 minutes at room tem-
perature (RT). After washing, acquisition used a Facs-
Canto II flow cytometer with Standard FacsDiva
software (BD Biosciences). Subsequent analyses used
FlowJo software (Tree Star, Inc, OR, USA). Samples
weregatedusingforward(FSC)andside(SSC)scatter
to exclude dead cells and debris.
Cell Isolation
Buffy coats, provided by our Blood Bank department,
were obtained from healthy blood donors following the
institutional Standard Operating Procedures for blood
donation and processing. Peripheral Blood Mononuclear
Cells (PBMCs) were isolated by Ficoll-Paque (Lympho-
prep, Axis Shield, Oslo, Norway) density gradient centri-
fugation at 400 × g for 25 min. Recovered cells were
washed twice in PBS and counted using Perfect Count
microspheres (Cytognos SL, Salamanca, Spain) following
the manufacturer’ s instructions. The Ethical Committee
of Germans Trias i Pujol Hospital approved the study,
and all subjects gave their informed consent according
to the Declaration of Helsinki (BMJ 1991; 302: 1994).
Establishing Monocyte-derived DCs
PBM Cs were dep leted o f CD3+ T cel ls using a Rosette-
Sep™ Human CD3 Depletion Cocktail (StemCell Tec h-
nologies, Seattle, WA, USA). Monocytes were obtained
by positive selection using an EasySep
®
Human CD14
Positive Selection Kit (StemCell Technologies, Seattle,
WA, USA). For all samples, the purity and viability of
the monocyte populations were greater than 95% and
90% respectively, as assessed by the expression of speci-
fic markers and Anne xin V + and 7-Amino-actinomycin
D (7AAD) labelling (BD Biosciences).
Monocytes were cultured at 1-1.1 ×10
6
/ml for 6 days
in cGMP-grade XVIVO15 containing penicillin (100 U/
ml) and streptomycin (100 μg/ml) in the presence of
clinical-grade granulocyte-macrophage colony-stimulat-
ing factor (GM-CSF: 1000 U/ml; CellGenix, Freiburg,
Germany) and interleukin 4 (IL-4: 1000 U/ml; Cell-
Genix, Freiburg, Germany). Cells were replenished on
day2withahalfvolumeoffreshmediumandcyto-
kines, and complete fresh medium and cyt okines on day
4. To induce mature DCs (Mat-DCs), DCs were treated
with a cGMP-grade cytokines cocktail: TNF-a (1000 U/
mL) and IL-b (10 ng/mL) (both from CellGenix); and
PGE2 (1 μM) (Pfizer, New York, USA) on day 4. Tol-
DCs were established by treatment with either Dexa (1
μM, Fortecortín, Merck Farma y Química, S.L, Spain),
Naranjo-Gómez et al. Journal of Translational Medicine 2011, 9:89
/>Page 2 of 14
Rapa (10 nM, Rapamune, Wyeth Farma S.A, Spain) on
days 2 and 4, or VitD3 (1 nM, Calcijex, Abbott) on days
0 and 4. Tol-DCs were stimulated as mature DCs at day
4 with the cytokine cocktail. On day 6, DCs were har-
vested and washed extensively twice before functional
assays were performed.
Allostimulatory assays
PBMCs were labelled with CFSE and plated (10
5
cells/
well) in 96-well round-bottom plates. Mononuclear cells
were co-cultured for 6 days with MDDCs at a 1:20 ratio
(DC: PBMC). Cell proliferation was determined by the
sequential loss of CFSE fluorescence of CD3 positive
cells, as detected by flow cytometry.
Intracellular cytokine staining
Mononuclear cells isolated from healthy donors were
seeded in 96-well round bottom plates (Nunc) at a den-
sity of 1 × 10
5
cells/well and stimulated for 6 days with
allogeneic DCs (5 × 10
3
DC/well ). Then, total cells were
stimulated with 50 ng/mL phorbol 12-myristate 13-acet-
ate (PMA, Sigma) plus 500 ng/mL ionomycin (Sigma)
for 5 h in the presence of 10 μg/ml brefeldin A (Sigma).
After stimulation, cells were washed with PBS and
stained for 18 min at RT with PerCP-conjugated anti-
human CD3 mAb (BD Biosc iences). Cells were then
washed, fixed and permeabilised using an IntraStain kit
(Dako) and incubated for 28 min at RT with anti-
human IFNg APC mAb (eBioscience). Cells were washed
and analysed with a BD-FACScanto II flow cytometer
equipped with FACSDiva software (Becton-Dickinson).
Measurements of cytokine production
Interleukin 10 (IL-10), IL-12p70 and IL-23 were d eter-
mined in supernatants of activated DCs using MILLI-
PLEX Multi-Analyte Profiling (MAP; Millipore
Corporate Headqua rters, MA, USA) following the man-
ufacturer’s instructions. These supernatants were col-
lected after 48 h upon maturation and also after strong
TLR (LPS: 100 ng/mL from E. Coli 0111:B4, Sigma.
Reference: L4391) re-stimulation fo r 24 h and analysed
for the presence of the indicated cytokines.
Supernatants from allogeneic co-cultures were col-
lected after 6 days, stored at -20°C, and analyzed by
MILLIPLEX Multi-Analyte Profiling (IL-10) and ELISA
(TGFb, eBioscience).
Determination of CD4+ CD127 low/negative CD25high
and Foxp3+ T cells
CD3+ T lymphocytes were purified from mononuclear
cells by negative selection using an EasySep
®
Human T
Cell Enrichment Kit (StemCell Technologies) following
the manufacturer’s instructions. Purity was > 95% in all
experiments. Enriched T cells were plated (10
5
cells/
well) in 96-well round-bottom plates. After 6 days of
co-culture (1DC:20T), we used flow cytometry to deter-
mine the percentages of Tregs defined as CD4+,
CD127
low/negative
,CD25
high
and intracellular Foxp3+, as
previously reported [42] (Hu man Regulatory T Cell
Staining Kit; eBioscience, San Diego, CA, USA).
Statistical analyses
Resultsaregivenasmeans±standarddeviations(SD)
fornsamplespergroup.Resultsarethemeansofat
least 5 re plicates for each expe riment. Comparisons
used either parametric paired t-tests or non-parametric
Wilcoxon tests, as appropriate. A p-value ≤ 0.05 was
considered statistically significant. Prism software
(GraphPad v4.00 software. CA, USA) was used for sta-
tistical analysis.
Results
Dexa, Rapa and VitD3 generate tol-DCs under GMP
conditions
Most clinical studies use MDDCs to obtain adequate
numbers of cells to warrant clinical doses for patients.
We first evaluated the viabilities and yields of t he differ-
entiation processes using parallel conditions for the
same individual for each of 5 different donors. In order
to establish a common, objective baseline for compara-
tive purposes, dose-dependent experiments were set up
to obtain the optimal concentration of each immunomo-
dulatory agent that induced an arbitrary 50% reduction
of allostimulatory capacity compared to mature DCs
(similar to immature DCs) with high viability (≥ 85%
viable cells) (additional file 1:, Figure S1). Rapa-and
Vit D3-tol-DCs exhibited 50-70% reductions of T prolif-
eration at 10 nM and 1 nM, respectively, while Dexa
required a concentration 100-1000 t imes higher ( 1 μM)
to achieve similar results. These criteria allowed u s to
evaluate equivalent tolerogenic products using the fol-
lowing final concentrations: 1 μ MDexa,10nMRapa
and 1 nM VitD3.
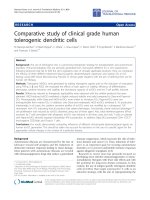
Simultaneous staining of cells with PE-annexin V and
with the non-vital dye 7AAD w as used to discriminate
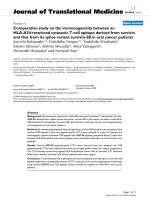
viable cells (Figure 1A). These results showed that, com-
pared to mature DCs, only VitD3 treatment slightly
reduced the cell viability (80 ± 13% vs. 87 ± 11% of
mature DCs, p = 0.01, paired t-test; Figure 1B) and yield
of DCs (45 ± 17% vs. 70 ± 19%, p = 0.0071, paired t-test;
Figure 1C) (n = 5). Treatment with Dexa and Rapa did
not affect these outcomes (viability: 89 ± 6% and 90 ± 8%
and yield: 60 ± 23% and 83 ± 16%; respectively, n = 5).
Dexa-and Vit D3-tol-DC phenotypes change and produce
IL-10
The tolerogenic functions of DCs may depend on their
maturation stage and their anti-inflammatory profile.
Naranjo-Gómez et al. Journal of Translational Medicine 2011, 9:89
/>Page 3 of 14
Thus, in our initial studies, we investigated the surface
phenotypes and cytokine milieus of tol-DCs obtained
using the 3 different immunomodulatory agents.
After 6 days of differ entiation, immat ure DCs (Im-
DCs) expressed low surface levels of MHC II and co-sti-
mulatory molecules (CD86 and CD83; n = 15) as com-
pared with mature DCs (Mat-DCs) (Table 1 and Figures
2A and 2B). Tol-DC generation in the presence of Dexa
and VitD3 was associated with an immature phenotype
as compared to Mat-DCs. This phenotypic impairment
may affect the whole population or may be observed
as a partial maturation induced in a relatively low
010
2
10
3
10
4
10
5
<PE-A>
0
10
2
10
3
10
4
10
5
<PerCP-Cy5-5-A>
0.58 8.24
2.0489.1
010
2
10
3
10
4
10
5
<PE-A>
0
10
2
10
3
10
4
10
5
<PerCP-Cy5-5-A>
0.3 9.4
5.2185.1
010
2
10
3
10
4
10
5
<PE-A>
0
10
2
10
3
10
4
10
5
<PerCP-Cy5-5-A>
1.4 10.7
2.485.5
010
2
10
3
10
4
10
5
<PE-A>
0
10
2
10
3
10
4
10
5
<PerCP-Cy5-5-A>
0.38 4.12
2.8892.6
010
2
10
3
10
4
10
5
<PE-A>
0
10
2
10
3
10
4
10
5
<PerCP-Cy5-5-A>
1.13 15.6
5.2578
0 1000 2000 3000 4000
FSC-A
0
1000
2000
3000
4000
SSC-A
50.5
30
Beads
Cells
0 1000 2000 3000 4000
FSC-A
0
1000
2000
3000
4000
SSC-A
53.2
27.4
Beads
Cells
0 1000 2000 3000 4000
FSC-A
0
1000
2000
3000
4000
SSC-A
55.3
24.4
Beads
Cells
0 1000 2000 3000 4000
FSC-A
0
1000
2000
3000
4000
SSC-A
48.1
32
Beads
Cells
0 1000 2000 3000 4000
FSC-A
0
1000
2000
3000
4000
SSC-A
55.2
22.3
Beads
Cells
Im-MDDC Mat-MDDC Dexa-MDDC Rapa-MDDC Vit D3-MDDC
Annexin V
7
AAD
010
2
10
3
10
4
10
5
<PE-A>
0
10
2
10
3
10
4
10
5
<PerCP-Cy5-5-A>
0.58 8.24
2.0489.1
010
2
10
3
10
4
10
5
<PE-A>
0
10
2
10
3
10
4
10
5
<PerCP-Cy5-5-A>
0.3 9.4
5.2185.1
010
2
10
3
10
4
10
5
<PE-A>
0
10
2
10
3
10
4
10
5
<PerCP-Cy5-5-A>
1.4 10.7
2.485.5
010
2
10
3
10
4
10
5
<PE-A>
0
10
2
10
3
10
4
10
5
<PerCP-Cy5-5-A>
0.38 4.12
2.8892.6
010
2
10
3
10
4
10
5
<PE-A>
0
10
2
10
3
10
4
10
5
<PerCP-Cy5-5-A>
1.13 15.6
5.2578
0 1000 2000 3000 4000
FSC-A
0
1000
2000
3000
4000
SSC-A
50.5
30
Beads
Cells
0 1000 2000 3000 4000
FSC-A
0
1000
2000
3000
4000
SSC-A
50.5
30
Beads
0 1000 2000 3000 4000
FSC-A
0
1000
2000
3000
4000
SSC-A
50.5
30
0 1000 2000 3000 4000
FSC-A
0
1000
2000
3000
4000
SSC-A
50.5
30
Beads
Cells
0 1000 2000 3000 4000
FSC-A
0
1000
2000
3000
4000
SSC-A
53.2
27.4
Beads
Cells
0 1000 2000 3000 4000
FSC-A
0
1000
2000
3000
4000
SSC-A
53.2
27.4
Beads
0 1000 2000 3000 4000
FSC-A
0
1000
2000
3000
4000
SSC-A
53.2
27.4
0 1000 2000 3000 4000
FSC-A
0
1000
2000
3000
4000
SSC-A
53.2
27.4
Beads
Cells
0 1000 2000 3000 4000
FSC-A
0
1000
2000
3000
4000
SSC-A
55.3
24.4
Beads
Cells
0 1000 2000 3000 4000
FSC-A
0
1000
2000
3000
4000
SSC-A
55.3
24.4
Beads
0 1000 2000 3000 4000
FSC-A
0
1000
2000
3000
4000
SSC-A
55.3
24.4
0 1000 2000 3000 4000
FSC-A
0
1000
2000
3000
4000
SSC-A
55.3
24.4
Beads
Cells
0 1000 2000 3000 4000
FSC-A
0
1000
2000
3000
4000
SSC-A
48.1
32
Beads
Cells
0 1000 2000 3000 4000
FSC-A
0
1000
2000
3000
4000
SSC-A
48.1
32
Beads
0 1000 2000 3000 4000
FSC-A
0
1000
2000
3000
4000
SSC-A
48.1
32
0 1000 2000 3000 4000
FSC-A
0
1000
2000
3000
4000
SSC-A
48.1
32
Beads
Cells
0 1000 2000 3000 4000
FSC-A
0
1000
2000
3000
4000
SSC-A
55.2
22.3
Beads
Cells
0 1000 2000 3000 4000
FSC-A
0
1000
2000
3000
4000
SSC-A
55.2
22.3
Beads
0 1000 2000 3000 4000
FSC-A
0
1000
2000
3000
4000
SSC-A
55.2
22.3
0 1000 2000 3000 4000
FSC-A
0
1000
2000
3000
4000
SSC-A
55.2
22.3
Beads
Cells
Im-MDDC Mat-MDDC Dexa-MDDC Rapa-MDDC Vit D3-MDDC
Annexin V
7
AAD
A
BC
Figure 1 Survival of tol-DCs after clinical protocol differentiation. (A) Vi ability of MDDCs with or without immunomodulatory treatment
after 6 days of differentiation. Plots are representative of 5 independent experiments. (B) Surviving cells are annexin V and 7AAD negative cells.
(C) Yield obtained calculated as the number of MDDCs obtained from the initial number of monocytes that were cultured (n = 5). (paired t-test.
*p≤ 0.05; ** p ≤ 0.001; ***≤ 0.0001).
Table 1 Surface markers on tolerogenic DCs
CD86 CD83 HLA-DR n
Im-DC 15737 ± 7681 *** 1316 ± 673 *** 39405 ± 33712 ** 15
Mat-DC 22704 ± 13632 4371 ± 3189 70692 ± 66038 15
Dexa-DC 12291 ± 11364 *** 2811 ± 2343 * 50928 ± 62830 11
Rapa-DC 23782 ± 10961 4785 ± 2786 75297 ± 56014 15
VitD3-DC 6398 ± 6243 ** 1941 ± 3096 ** 20851 ± 38803 ** 11
Surface markers expression was mea sured by flow cytometry on MDDC.
Results are the averages ± SDs of Mean Fluorescence Intensity (MFI) from
different donors; n (number of samples). Mature DCs were used as a reference
group for all comparisons. * p ≤ 0,05; ** p ≤ 0,001; *** p ≤ 0,0001 (paired t-
test) indicating significant differences compared to MDDCs.
Naranjo-Gómez et al. Journal of Translational Medicine 2011, 9:89
/>Page 4 of 14
Im-MDDC Mat-MDDC Dexa-MDDC Rapa-MDDC Vit D3-MDDC
010
2
10
3
10
4
10
5
<FITC-A>
0
20
40
60
80
100
% of Max
25877
010
2
10
3
10
4
10
5
<FITC-A>
0
20
40
60
80
100
% of Max
34065
010
2
10
3
10
4
10
5
<FITC-A>
0
20
40
60
80
100
% of Max
6906
010
2
10
3
10
4
10
5
<FITC-A>
0
20
40
60
80
100
% of Max
18702
010
2
10
3
10
4
10
5
<FITC-A>
0
20
40
60
80
100
% of Max
4111
CD86
CD83
010
2
10
3
10
4
10
5
<APC-A>
0
20
40
60
80
100
% of Max
1094
010
2
10
3
10
4
10
5
<APC-A>
0
20
40
60
80
100
% of Max
6475
010
2
10
3
10
4
10
5
<APC-A>
0
20
40
60
80
100
% of Max
1586
010
2
10
3
10
4
10
5
<APC-A>
0
20
40
60
80
100
% of Max
6405
010
2
10
3
10
4
10
5
<APC-A>
0
20
40
60
80
100
% of Max
869
010
2
10
3
10
4
10
5
<APC-Cy7-A>
0
20
40
60
80
100
% of Max
35079
010
2
10
3
10
4
10
5
<APC-Cy7-A>
0
20
40
60
80
100
% of Max
94406
010
2
10
3
10
4
10
5
<APC-Cy7-A>
0
20
40
60
80
100
% of Max
33747
010
2
10
3
10
4
10
5
<APC-Cy7-A>
0
20
40
60
80
100
% of Max
91758
010
2
10
3
10
4
10
5
<APC-Cy7-A>
0
20
40
60
80
100
% of Max
10893
HLA-DR
Im-MDDC Mat-MDDC Dexa-MDDC Rapa-MDDC Vit D3-MDDC
010
2
10
3
10
4
10
5
<FITC-A>
0
20
40
60
80
100
% of Max
25877
010
2
10
3
10
4
10
5
<FITC-A>
0
20
40
60
80
100
% of Max
25877
010
2
10
3
10
4
10
5
<FITC-A>
0
20
40
60
80
100
% of Max
34065
010
2
10
3
10
4
10
5
<FITC-A>
0
20
40
60
80
100
% of Max
34065
010
2
10
3
10
4
10
5
<FITC-A>
0
20
40
60
80
100
% of Max
6906
010
2
10
3
10
4
10
5
<FITC-A>
0
20
40
60
80
100
% of Max
6906
010
2
10
3
10
4
10
5
<FITC-A>
0
20
40
60
80
100
% of Max
18702
010
2
10
3
10
4
10
5
<FITC-A>
0
20
40
60
80
100
% of Max
18702
010
2
10
3
10
4
10
5
<FITC-A>
0
20
40
60
80
100
% of Max
4111
010
2
10
3
10
4
10
5
<FITC-A>
0
20
40
60
80
100
% of Max
4111
CD86CD86
CD83
010
2
10
3
10
4
10
5
<APC-A>
0
20
40
60
80
100
% of Max
1094
010
2
10
3
10
4
10
5
<APC-A>
0
20
40
60
80
100
% of Max
1094
010
2
10
3
10
4
10
5
<APC-A>
0
20
40
60
80
100
% of Max
6475
010
2
10
3
10
4
10
5
<APC-A>
0
20
40
60
80
100
% of Max
6475
010
2
10
3
10
4
10
5
<APC-A>
0
20
40
60
80
100
% of Max
1586
010
2
10
3
10
4
10
5
<APC-A>
0
20
40
60
80
100
% of Max
1586
010
2
10
3
10
4
10
5
<APC-A>
0
20
40
60
80
100
% of Max
6405
010
2
10
3
10
4
10
5
<APC-A>
0
20
40
60
80
100
% of Max
6405
010
2
10
3
10
4
10
5
<APC-A>
0
20
40
60
80
100
% of Max
869
010
2
10
3
10
4
10
5
<APC-A>
0
20
40
60
80
100
% of Max
869
010
2
10
3
10
4
10
5
<APC-Cy7-A>
0
20
40
60
80
100
% of Max
35079
010
2
10
3
10
4
10
5
<APC-Cy7-A>
0
20
40
60
80
100
% of Max
35079
010
2
10
3
10
4
10
5
<APC-Cy7-A>
0
20
40
60
80
100
% of Max
94406
010
2
10
3
10
4
10
5
<APC-Cy7-A>
0
20
40
60
80
100
% of Max
94406
010
2
10
3
10
4
10
5
<APC-Cy7-A>
0
20
40
60
80
100
% of Max
33747
010
2
10
3
10
4
10
5
<APC-Cy7-A>
0
20
40
60
80
100
% of Max
33747
010
2
10
3
10
4
10
5
<APC-Cy7-A>
0
20
40
60
80
100
% of Max
91758
010
2
10
3
10
4
10
5
<APC-Cy7-A>
0
20
40
60
80
100
% of Max
91758
010
2
10
3
10
4
10
5
<APC-Cy7-A>
0
20
40
60
80
100
% of Max
10893
010
2
10
3
10
4
10
5
<APC-Cy7-A>
0
20
40
60
80
100
% of Max
10893
HLA-DRHLA-DR
Dexa-MDDC
Rapa-MDDC
Vit D3-MDDC
A
B
CD86CD83HLA-DR
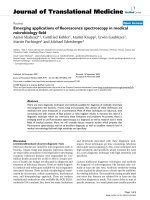
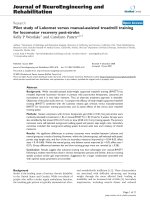
Figure 2 Dexa-and VitD3-DCs exhibit a semi-mature phenotype as compared with Mat-DCs. (A) DC expression of maturation-associate d
markers of immature DCs (Im-DCs), mature DCs (Mat-DCs) and tol-DCs. Surface expression of CD86-FITC, CD83-APC and HLA-DR-APCH7 staining
on MDDCs. Each histogram is representative of 15 independent experiments. Isotype controls are shown in grey. (B) Results are mean
fluorescence intensities from n = 11 cultures in the presence of Dexa, n = 15 cultures with Rapa-DCs and n = 11 cultures with VitD3-DCs. (paired
t-test. * p ≤ 0.05; ** p ≤ 0.001; ***≤ 0.0001).
Naranjo-Gómez et al. Journal of Translational Medicine 2011, 9:89
/>Page 5 of 14
proportion of cells compared to the mature situatio n.
The latter was often observed in most cases of our results.
Indeed, in several experiments the percentage of cells with
low CD83 and HLA DR levels ("semi-mature”) was over
75%. As our study aimed for the comparison of the popu-
lations obtained under different tolerogenic regimes, we
considered that the analyses of the whole population
would better reflect these comparisons. VitD3-DCs
showed a significantly reduced expression of CD86, CD83
and HLA-DR (n = 11). Dexa-tol-DCs exhibited a similar
pattern, although only CD86 and CD83 showed signifi-
cantly reduced expression levels (n = 11). In contrast,
Rapa-tol-DCs were not phenotypically different from Mat-
DCs (n = 15) (Table 1 and Figures 2A and 2B).
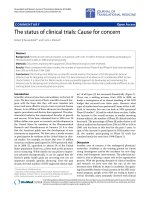
In addition, we measured the secretion of IL-10 and
IL-12p70 after 48 h upon maturation. We found IL-10
production in cultures with eithe r Dexa or VitD3, but
not with Rapa (Figure 3A). Of note, the production of
IL-10 in the presence of dexamethasone was 6 times
higher compared to mature DCs (1305 ± 846 pg/mL vs.
204.5 ± 160.5 pg/mL; p = 0 .0135, n = 6, paired t-test).
Also, VitD3 tol-DCs produced slightly more IL-10 than
mature cells (243 ± 272.9 pg/mL vs. 204.5 ± 160 .5 pg/
mL, n = 11). In contrast, IL-12 was notably undetectable
in all culture conditions (data not shown).
Stability of Tol-DCs after restimulation with LPS
To evaluate whether DCs were resistant to an exogen-
ous maturation stimulus, tol-DC stability was investi-
gated by culturing tol-DCs for 24 h in XVIVO medium
containing LPS (without immunomodulatory agent). As
shown in Figure 3B, tol-DCs were phenotypically refrac-
tory to secondary stimulat ion, and retained their typical
cytokine profile of IL-10 production. Dexa tol-DCs resti-
mulated with LPS produced 19 times more IL-10 than
Dexa-DCs (165.1 ± 203.7 pg/mL vs. 3244 ± 828.6 pg/
mL,p=0.0046,n=4,pairedt-test).RegardingVitD3-
DCs, LPS-restimulat ion did not greatly modified the IL-
10 production. Again, Rapa tol-DCs did not exhibit any
IL-10 production.
Importantly, while primary stim ulation of the DCs
with this strong TLR4 ligand induced greater IL-23 pro-
duction by immature DCs (10.86 ± 6.5 fold increase), no
increased IL-23 production was detected by tol-DCs in
any culture condition (Dexa-DC: 1.11 ± 0.46; Rapa: 1.22
± 0.84; VitD3: 1.0 8 ± 0.51 fold changes), w hich sup-
ported a stable non-proinflamatory profile for tol-DCs.
Mat-DC also showed some refractoriness to the ulterior
stimulation with LPS, meaning there was a faint produc-
tion of cytokines “de novo” as opposite to Im-DCs.
DC-tols do not promote a Th1 profile
To analyze the effect of the different tol-DCs, allostimu-
lated T cells were further studied. An example of the
proliferation of T cells allostimulated by tol-DCs is
shown in Figure 4A. We have also summarized the rela-
tive results achieved using mature-DCs for different
donors in Figure 4B. Of mention, we found that Dexa-
DCs inhibited T cell proliferation only partially in some
donors (4/12 subjects, data not shown).
To further investigate the effect of tol-DCs on T cells,
we also determined whether inhibition of T cell prolifera-
tion was due to increased T cell apoptosis. We found that
the reduced stimulation of T cell proliferation was not due
to a reduction in cell viability induced by a particular type
of tol-DC (% of both Annexin V and 7AAD negative cells)
of allostimulated T cells (Im: 61.76 ± 9.28%; Mat: 65.92 ±
10.13%; Dexa: 62.08 ± 9.21%; Rapa: 61.02 ± 11.12% a nd
VitD3: 60.43 ± 11.72%; n = 4) (Figure 4C).
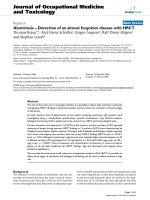
To gain some insight into the cytokines secreted by
these responding T cells, CFS E
low
alloproliferative T
lymphocytes were re-stimulat ed with PMA + ionomycin
and IFN-g production was measured by intracellular
staining. These results confirmed a reduction of about
50-60% in IFN-g production relative to mature DCs for
all conditions tested (Figures 5A and 5B: 50.18 ± 16.65%
IFN-g producing cells among T cells allostimulated by
Dexa-DC, p = 0,0093, n = 4, paired t-test; 39.83 ±
16.76% Rapa-DC, p < 0,0001, n = 7, paired t-test; and
37.97 ± 44.08 VitD3-DC, p = 0,0098, n = 7, paired t-
test). When only CFSE
low
proliferating T cells were ana-
lysed, Rapa-DCs stimulated T cells showed a significant
decrease in IFN-g production relative to Mat-DCs (Fig-
ure 5C: 40.99 ± 9.2% vs. 52.47 ± 10.85% IFN-g among
CFSE
low
CD3+ cells, n = 7, p = 0,0057, paired t-test).
VitD3-DCs also suppressed IFN-g production in co-cul-
tures with allogeneic mononuclear cells, but only in
some donors and Dexa-DCs did not reduce the capabi l-
ity of responding T cells to produce IFN-g in any of the
experiments.
In addition, we determined the production of IL-10
and TGFb in the supernatants from T cells co-cultured
with tol-DC. We could measure IL-10 production in
allostimulated T cells by Dexa-DC in 3 of 4 donors.
Interleukin 10 values obtained were 57.47 ± 29.47 pg/
mL (T cells + Dexa-DCs ) compared to 33.37 ± 2.66 pg/
mL (T cells allostimulated with Mat-DCs). Conversely,
we did not find major differences in T cells stimulated
with Rapa-DC (15.7 ± 13.61 pg/mL) or VitD3-DC (38.7
± 7.28 pg/mL) compared to mature DCs (n = 3).
Regarding TGFb,allthemeasureswerebelowthelimit
of detection of the assay (60 pg/mL) in the different sti-
mulatory conditions analyzed.
Finally, the presence of Tregs cells defined as CD4+
CD127 low/negative CD25high and Foxp3+ as reported
before (72) was estimated in these culture conditions.
After one round of stimulation for 6 days, we analysed the
induction of CD4+ Foxp3+ and CD25
high
, CD127
low/negative
Naranjo-Gómez et al. Journal of Translational Medicine 2011, 9:89
/>Page 6 of 14
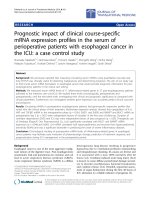
cellsasshowninFigure6A.Then,asdepicted,only
those T cells stimulated by Rapa-DCs showed a signifi-
cantly increase of the percentages of CD4+ Foxp3+ and
CD25
high
, CD127
low/negative
cells (5.4 ± 1.9% vs. 3.5 ±
1.7% with Mat-DCs, p = 0.0211, n = 6, paired t test)
(Figure 6B).
Discussion
Induct ion of therapeutic toleranc e is of increasing inter-
est in autoimmuni ty, allograft rejection, allergy, ast hma,
and various forms of hypersensitivity. Because of their
capacity to orchestrate immune responses, DCs can be
used as therapeutic agents. The classical concept that
A
B
Figure 3 Tolerogenic dendritic cells (tol-DCs) exhibit an anti-inflammatory cytokine profile and stable phenotype. (A) IL-10 release by
DCs in the presence or absence of immunomodulatory agents (Dexa, Rapa or VitD3) was measured after 48 h stimulation with a maturation
cocktail. Supernatants were harvested and analysed for IL-10 production by MILLIPLEX (Dexa: n = 6; Rapa: n = 7 and VitD3: n = 11). (B) Stability
of tol-DCs was evaluated after culture for 24 h in XVIVO medium containing LPS (without immunomodulatory agent). IL-10 and IL-23 production
was determined for all DC conditions (with or without LPS). (n = 4. Statistical significance derived from a paired t-test. * p ≤ 0.05).
Naranjo-Gómez et al. Journal of Translational Medicine 2011, 9:89
/>Page 7 of 14
imma tu re DCs induce tolerance and that mature DCs
induce immune responses has changed completely, and
several lines of evidence demonstrate that the maturation
state of DCs does not always correlate with their toleris-
ing or activating functions [43]. In this sense, the
definition of tol-DCs must include a maturation-resistant
cell that acts as “an immature DC” with a stable pheno-
type that is preserved, even in the presence of pro-inflam-
matory signals. This tolerogenic state of DCs can be
induced using several pharmacological agents [44-46].
0 1000 2000 3000 4000
FSC-A
0
1000
2000
3000
4000
SSC-A
55.8
010
2
10
3
10
4
10
5
<FITC-A>
0
10
2
10
3
10
4
10
5
<Pacific Blue-A>
0 0
8416
0 1000 2000 3000 4000
FSC-A
0
1000
2000
3000
4000
SSC-A
60.6
010
2
10
3
10
4
10
5
<FITC-A>
0
10
2
10
3
10
4
10
5
<Pacific Blue-A>
0 0.018
61.838.2
0 1000 2000 3000 4000
FSC-A
0
1000
2000
3000
4000
SSC-A
55.7
010
2
10
3
10
4
10
5
<FITC-A>
0
10
2
10
3
10
4
10
5
<Pacific Blue-A>
0 0
78.921.1
0 1000 2000 3000 4000
FSC-A
0
1000
2000
3000
4000
SSC-A
56.7
010
2
10
3
10
4
10
5
<FITC-A>
0
10
2
10
3
10
4
10
5
<Pacific Blue-A>
0 0
91.68.35
0 1000 2000 3000 4000
FSC-A
0
1000
2000
3000
4000
SSC-A
57.6
010
2
10
3
10
4
10
5
<FITC-A>
0
10
2
10
3
10
4
10
5
<Pacific Blue-A>
0 0
97.22.76
Im-MDDC Mat-MDDC Dexa-MDDC Rapa-MDDC Vit D3-MDDC
0 1000 2000 3000 4000
FSC-A
0
10
2
10
3
10
4
10
5
<APC-A>
82.6
CD3
0 1000 2000 3000 4000
FSC-A
0
10
2
10
3
10
4
10
5
<APC-A>
87.7
CD3
0 1000 2000 3000 4000
FSC-A
0
10
2
10
3
10
4
10
5
<APC-A>
86.4
CD3
0 1000 2000 3000 4000
FSC-A
0
10
2
10
3
10
4
10
5
<APC-A>
85.7
CD3
0 1000 2000 3000 4000
FSC-A
0
10
2
10
3
10
4
10
5
<APC-A>
87
CD3
CFSE
0 1000 2000 3000 4000
FSC-A
0
1000
2000
3000
4000
SSC-A
55.8
010
2
10
3
10
4
10
5
<FITC-A>
0
10
2
10
3
10
4
10
5
<Pacific Blue-A>
0 0
8416
0 1000 2000 3000 4000
FSC-A
0
1000
2000
3000
4000
SSC-A
60.6
010
2
10
3
10
4
10
5
<FITC-A>
0
10
2
10
3
10
4
10
5
<Pacific Blue-A>
0 0.018
61.838.2
0 1000 2000 3000 4000
FSC-A
0
1000
2000
3000
4000
SSC-A
55.7
010
2
10
3
10
4
10
5
<FITC-A>
0
10
2
10
3
10
4
10
5
<Pacific Blue-A>
0 0
78.921.1
0 1000 2000 3000 4000
FSC-A
0
1000
2000
3000
4000
SSC-A
56.7
010
2
10
3
10
4
10
5
<FITC-A>
0
10
2
10
3
10
4
10
5
<Pacific Blue-A>
0 0
91.68.35
0 1000 2000 3000 4000
FSC-A
0
1000
2000
3000
4000
SSC-A
57.6
010
2
10
3
10
4
10
5
<FITC-A>
0
10
2
10
3
10
4
10
5
<Pacific Blue-A>
0 0
97.22.76
Im-MDDC Mat-MDDC Dexa-MDDC Rapa-MDDC Vit D3-MDDC
0 1000 2000 3000 4000
FSC-A
0
10
2
10
3
10
4
10
5
<APC-A>
82.6
CD3
0 1000 2000 3000 4000
FSC-A
0
10
2
10
3
10
4
10
5
<APC-A>
82.6
CD3
0 1000 2000 3000 4000
FSC-A
0
10
2
10
3
10
4
10
5
<APC-A>
87.7
CD3
0 1000 2000 3000 4000
FSC-A
0
10
2
10
3
10
4
10
5
<APC-A>
87.7
CD3
0 1000 2000 3000 4000
FSC-A
0
10
2
10
3
10
4
10
5
<APC-A>
86.4
CD3
0 1000 2000 3000 4000
FSC-A
0
10
2
10
3
10
4
10
5
<APC-A>
86.4
CD3
0 1000 2000 3000 4000
FSC-A
0
10
2
10
3
10
4
10
5
<APC-A>
85.7
CD3
0 1000 2000 3000 4000
FSC-A
0
10
2
10
3
10
4
10
5
<APC-A>
85.7
CD3
0 1000 2000 3000 4000
FSC-A
0
10
2
10
3
10
4
10
5
<APC-A>
87
CD3
0 1000 2000 3000 4000
FSC-A
0
10
2
10
3
10
4
10
5
<APC-A>
87
CD3
CFSE
A
BC
Figure 4 Tolerogenic dendritic cells (tol-DCs) suppress T cell proliferation without apoptosis induction. (A and B) Allogeneic T cells were
stimulated with tol-DCs and compared for proliferation with stimulation by Mat-DCs and Im-DCs in mixed-lymphocyte reactions. Compared to
Mat-DCs, tol-DCs potently inhibited allogeneic T cell proliferation at a level similar to Im-DCs (Dexa: n = 7; Rapa: n = 10; and Vit D3: n = 10). (C)
Viability results (%Annexin V and 7AAD negative) for T cells co-cultured with different cellular products (n = 4).
Naranjo-Gómez et al. Journal of Translational Medicine 2011, 9:89
/>Page 8 of 14
A
B
C
0 1000 2000 3000 4000
FSC-A
0
10
2
10
3
10
4
10
5
<PECy-5-A>
78
010
2
10
3
10
4
10
5
<FITC-A>
0
10
2
10
3
10
4
10
5
<APC-A>
3.69
1.26 26
70.32.44
010
2
10
3
10
4
10
5
<FITC-A>
0
10
2
10
3
10
4
10
5
<APC-A>
33.9 0
066.1
0 1000 2000 3000 4000
FSC-A
0
10
2
10
3
10
4
10
5
<PECy-5-A>
70.9
010
2
10
3
10
4
10
5
<FITC-A>
0
10
2
10
3
10
4
10
5
<APC-A>
13
5.85 23
647.19
010
2
10
3
10
4
10
5
<FITC-A>
0
10
2
10
3
10
4
10
5
<APC-A>
45.1 0
054.9
0 1000 2000 3000 4000
FSC-A
0
10
2
10
3
10
4
10
5
<PECy-5-A>
73.6
010
2
10
3
10
4
10
5
<FITC-A>
0
10
2
10
3
10
4
10
5
<APC-A>
6.75
2.69 26.6
66.74.06
010
2
10
3
10
4
10
5
<FITC-A>
0
10
2
10
3
10
4
10
5
<APC-A>
39.9 0
060.1
0 1000 2000 3000 4000
FSC-A
0
10
2
10
3
10
4
10
5
<PECy-5-A>
75.9
010
2
10
3
10
4
10
5
<FITC-A>
0
10
2
10
3
10
4
10
5
<APC-A>
6.16
1.93 20.1
73.74.23
010
2
10
3
10
4
10
5
<FITC-A>
0
10
2
10
3
10
4
10
5
<APC-A>
31.4 0
068.6
0 1000 2000 3000 400
0
FSC-A
0
10
2
10
3
10
4
10
5
<PECy-5-A>
74.2
010
2
10
3
10
4
10
5
<FITC-A>
0
10
2
10
3
10
4
10
5
<APC-A>
4.85
1.36 25.8
69.43.5
010
2
10
3
10
4
10
5
<FITC-A>
0
10
2
10
3
10
4
10
5
<APC-A>
28 0
072
CD3 CD3 CD3 CD3 CD3
Im-MDDC Mat-MDDC Dexa-MDDC Rapa-MDDC Vit D3-MDDC
0 1000 2000 3000 4000
FSC-A
0
10
2
10
3
10
4
10
5
<PECy-5-A>
78
010
2
10
3
10
4
10
5
<FITC-A>
0
10
2
10
3
10
4
10
5
<APC-A>
3.69
1.26 26
70.32.44
010
2
10
3
10
4
10
5
<FITC-A>
0
10
2
10
3
10
4
10
5
<APC-A>
33.9 0
066.1
0 1000 2000 3000 4000
FSC-A
0
10
2
10
3
10
4
10
5
<PECy-5-A>
70.9
010
2
10
3
10
4
10
5
<FITC-A>
0
10
2
10
3
10
4
10
5
<APC-A>
13
5.85 23
647.19
010
2
10
3
10
4
10
5
<FITC-A>
0
10
2
10
3
10
4
10
5
<APC-A>
45.1 0
054.9
0 1000 2000 3000 4000
FSC-A
0
10
2
10
3
10
4
10
5
<PECy-5-A>
73.6
010
2
10
3
10
4
10
5
<FITC-A>
0
10
2
10
3
10
4
10
5
<APC-A>
6.75
2.69 26.6
66.74.06
010
2
10
3
10
4
10
5
<FITC-A>
0
10
2
10
3
10
4
10
5
<APC-A>
39.9 0
060.1
0 1000 2000 3000 4000
FSC-A
0
10
2
10
3
10
4
10
5
<PECy-5-A>
75.9
010
2
10
3
10
4
10
5
<FITC-A>
0
10
2
10
3
10
4
10
5
<APC-A>
6.16
1.93 20.1
73.74.23
010
2
10
3
10
4
10
5
<FITC-A>
0
10
2
10
3
10
4
10
5
<APC-A>
31.4 0
068.6
0 1000 2000 3000 400
0
FSC-A
0
10
2
10
3
10
4
10
5
<PECy-5-A>
74.2
010
2
10
3
10
4
10
5
<FITC-A>
0
10
2
10
3
10
4
10
5
<APC-A>
4.85
1.36 25.8
69.43.5
010
2
10
3
10
4
10
5
<FITC-A>
0
10
2
10
3
10
4
10
5
<APC-A>
28 0
072
CD3 CD3 CD3 CD3 CD3
Im-MDDC Mat-MDDC Dexa-MDDC Rapa-MDDC Vit D3-MDDC
IFN J
J
CFSE
i
ii
iii
Figure 5 Decreased production and secretion of IFN-g by T lymphocytes stimulated with tol-DCs. Proliferating T lymphocytes were
obtained from allostimulatory cultures. The production of interferon (IFN)-g was measured by intracellular staining after restimulating the cells
with PMA+Io in the presence of brefeldin for 5 h. (A) First row (i) shows gating CD3+ cells. The second row plots (ii) indicate the proportion of
total IFN-g producing cells. Third row (iii) shows the percentages of cells that responded to allostimulation (CFSElow) and produced IFN-g. The
numbers inside the plots indicate the percentage of cells in each quadrant or boxes (a representative experiment). (B) Summary of the results of
the total intracellular IFN-g (Upper Left, UL) production with Dexa-(n = 4), Rapa-(n = 7) and Vit D3 (n = 7) activated cultures relative to Mat-DCs
(taken as 100% production). (C) Percentage of IFN-g producing T cells that responded to allostimulation (CFSE
low
CD3+ cells). Each symbol
represents an individual sample. Significant differences are indicated (** p < 0,001; paired t-test).
Naranjo-Gómez et al. Journal of Translational Medicine 2011, 9:89
/>Page 9 of 14
A
B
Mat-MDDC
Dexa-MDDC
R
apa-MDDC
VitD3-MDDC
Foxp3
CD4
Foxp3
CD4
CD25
CD127
CD25
CD127
blast cells
non-blast cells
3,43%
89,6%
4,29%
80,7%
3,24%
86,9%
3,88%
75,9%
4,09%
90,5%
3,62%
82,9%
85,9%
2,23%
2,61%
74,5%
Figure 6 Rapa-DCs promote CD4+CD25
hi
CD127
low
FoxP3+ induction from blast T cells. After 6 days of culture without re-stimulation and
any supplemental cytokines, cell sizes were evaluated by FACS by plotting forward scatter (FSC) versus side scatter (SSC) parameters. Small (solid
line) non-blast cells and large (dotted line) blast cells are circled. (A) Phenotype of T cells as CD4+, Foxp3+ and CD25+ with low or null CD127
expression. One of 6 representative experiments is shown. (B) Summary of percentages of T cells in non-blast (left) and blast (right) cells. (* p ≤
0.05, n = 6, paired t-test).
Naranjo-Gómez et al. Journal of Translational Medicine 2011, 9:89
/>Page 10 of 14
At present, scattered knowledge from different tolero-
genic cellular products can be found. A b etter under-
standing of clinical grade cellular therapies may offer
new opportunities for treating different disorders. How-
ever, several gaps in our knowledge remain to be filled-
inbeforeaperfecttolerogenicDC(onebestsuitedfor
targeting a particular process) may be envisaged. Thus,
our work aimed to determine the capabilities of those
GMP-grade immunosuppressive drugs (dexamethasone,
rapamycin and vitamin D3) that are used to obtain tol-
DCs in comparative scenarios and identify the “array” of
their individual characteristics, such as phenotypes, cyto-
kine profiles, resistance to maturation, and T-cell pro-
files, in order to define the best DCs for a particular
situation.
Hence, we report for the first time a comparative
study of clinical-grade tolerogenic cellular products for
therapeutic applications that fulfil the regulatory medical
rules for human th erapy. Our results show that all clini-
cal-grade tol-DCs that were analysed function as “nega-
tive cellular vaccines,” whic h a re comparable to
previously characterised research-grade tol-DCs [47]. In
terms of viability, we observed that VitD3 had a slight
tendency to promote DC apoptosis, in accordance with
previous reports [48]. However, this minor reduction in
cell viability does not compromise either DC functional-
ity or the eventual use of these cells in therapy.
Although apoptosis induction in DCs by p harmacologi-
cal agents has been controversial, several reports
demonstrated t hat Dexa did not indu ce cell death in
MDDCs at any of the tested concentrations [49,50].
Also, use of Rapa for DC maturation did not increase
apoptosis [51], in agreement with our results.
When analysing the phenotypes of the generated tol-
DCs, we observed that only Dexa-and VitD3-DCs had
reduced classical markers of mature cells on their sur-
faces. However, Rapa-DCs did not show an immature
phenotype, thus being characterized as “mature DCs”
with respect to their exhibited phenotype. In this con-
text, it is obvious that the definition of DC m aturation
using phenotype markers is not a distinguishing feature
of immunogenicity nor tolerogenicity [40]. Thus, a set
of “biomarkers” for tolerance induction in our cellular
products have to be defined to better moni tor the puta-
tive tolerogenic cells [17,37], as phenotypic identification
of tol-DCs may not be as accurate as expected. Ideally,
quality controls for tol-DCs should be based on markers
that are quickly and readily detectable and that are
reliable.
From the cytokine profile results, Dexa-and moder-
ately VitD3-derived DCs showed increased IL-10 pro-
duction, whereas the secretion of IL-12p70 was not
detected in all cases. It is well known that IL-10 blocks
IL-12 synthesis by DCs, downregulates the expression of
co-stimulatory molecules and potentiates their tolero-
genicity [43,52]. T his tolerogenic feature was not
observed with Rap a-DCs, as was prev iously reported
[53]. Most likely, DCs modified by Rapa use some other
mechanism to induce tolerance, as discussed below.
Resistance to maturation is considered a prerequisite
of tolerogenic potential for ‘’negative cellular vaccines’’.
Under the influence of inflammation, the administered
immature DCs should potentially undergo maturation
and lose their tolerogenic function. Thus, for good clini-
cal applications, tol-DCs should show a stable immuno-
suppressive phenotype that will not be transformed to
immunostimulatory DCs after injection into patients. In
this context, several methods have been described for
designi ng maturation-resistant DCs [54-57]. Our results
show th at Dexa-DCs, and to a lesser exte nt VitD3-DCs,
exhibit a durable “immaturity,” as high IL-10 production
and no IL-12/IL-23 production was maintained upon
subsequent TLR stimulation. In agreement wit h this,
Xia et al. previously demonstrated that this tolerogenic
product preserves this feature up to 5 days after remov-
ing Dexa [58]. As described in the literature, immature
DCs undergo maturation and lose their tolerogenic
functions. Interestingly, the cytokine profiles of the gen-
erated tol-DCs were not modified by a strong TLR sti-
mulation, indicating that they maintained a stable
profile.
Another functional property of tol-DCs is their
decreased T cell-stimulatory capability. We further
invest igated the immunoregulatory capability of clinical-
grade tol-DCs using direct T cell activation in mixed-
lymphocyte reactions. Our results showed differential
potentials for reducing proliferation: Rapa and VitD3
worked in the nM range, while Dexa required higher
concentrations in the μM range. In fact, tolerogenic
MDDCs conditioned with Dexa from 1/3 of the indivi-
duals (4/12) did not acquire regulatory properties at the
concentration used, and even showed a “semi-mature”
phenotype. In this regard, the possibility of combining
Dexa with VitD3 to prevent de-sensitization of the DCs
to the actions of Dexa has been reported [11]. Further-
more, both immunomodulatory agents used in combina-
tion inhibit DC maturation and function in an additive
manner [7,59,60].
In addition, total IFN-g production was significantly
reduced when these T cells were stimulated by tol-DCs.
To extend our analyses, we evaluated IFN-g in T cells
that had responded to allostimulation and observed that
IFN-g production was only reduced when Rapa-DCs
were used as stimulators. This property in the deviation
of Th differentiation was also observed previously by
Monti P. et al [61].
It has been described that tolerogenic DCs induce
immune tolerance through several pathways, including
Naranjo-Gómez et al. Journal of Translational Medicine 2011, 9:89
/>Page 11 of 14
clonal T cell depletion or exhaustion, anergy, deviation
of Th differentiation or generation of Tregs [15,62-68].
To deduce which mechanisms that tol-DCs might have
exerted, the possibility of apoptosis induction was evalu-
ated. However, we did not find any differences in cell
death by allostimulated T cells, indicating that this
mechanism was not acting in our cellular products. In
contrast, it has been reported that Dexa-and VitD3-DCs
induced a hyporesponsiveness as a strategy to dampen
autoreactive responses [50], and our own observations
(Raïch-Regué D. et al) support these results.
Fina lly, we tested for the induct ion of CD4+CD25
hi
C-
D127
low
FoxP3+ T cells. Regulatory T cells suppress the
responses of alloreactive or self-reactive CD4+ T cells
and are supposed to maintain immunologic self-toler-
ance or control autoimmunity [69-71]. Rapa-DC-prim ed
T cells exhibited reduced alloproliferation along with a
concomitant expansion of CD4+CD25
hi
CD127
low
FoxP3+
cells [72-74]. This effect may have been in response to
the expression of high levels of CD86 and is consistent
with previou s reports that described that co-stimulation
is required for induction and expansion of FoxP3+
Tregs [53,75,76]. In contrast, Dexa and VitD3 did not
induce this phenotype on T cells. This discrepancy with
the literature could be due to the particular experimen-
tal approaches. It is important to note that we analyzed
these T cells in co-cultures of MDDCs with allogenic T
cell s for one round of stimulation. However, it has been
demonstrated that VitD3-DCs convert naive T cells into
Tregs after several rounds of priming and boostin g [77].
Another possibility to explore was the presence of other
CD4+ Treg subsets, including CD4+CD25-FoxP3-IL-10
producing Tr1 cells [78,79] and transforming growth
factor-b (TGF-b+) Th3 cells [80]. In this sense, our
results show IL-10 production on T cells stimulated by
Dexa-DCs but not TGF-b in any of cultured conditions.
Conclusions
In summary, in these comparative analyses of clinical
grade tol-DCs, Dexa-and VitD3-DCs exhibited a “semi-
immature” phenotype and IL-10 secretion. In contrast,
Rapa-DCs induced CD4+CD25
hi
CD127
low
FoxP3+ and
inhibited IFN-g secretion by allostimulated T cells. This
comparative study emphasises the fact that a simple
phenotypic determination of maturation markers does
not guarantee a tolerogenic function and that a com-
plete set of functional determinations is mandatory in
order to clearly define a tolerogenic “functional” pheno-
type. This also stresses the necessity to define reliable
biomarkers for applications in GMP labs. Finally, this
may also help with decisions o n which tolerogenic pro-
duct will be the best for a particular situation. Phase I-II
studies with quality control measures and appropriate
clinical and i mmunological outcomes must be per-
formed to evaluate potential tol-DC functions.
Additional material
Additional file 1: Figure S1-Dose-dependent experiments to
establish equivalent tol-DCs . Summary of the dose-dependent
experiments set up to obtain the optimal concentration of each
immunomodulatory agent. The results reflected the relative values of the
alloproliferation of T cells co-cultured with different tol-DCs (A: Dexa-DCs,
n ≥ 2; B: Rapa-DCs, n = 3; C: VitD3-DCs, n = 4).
List of abbreviations
DC: dendritic cell; Dexa: dexamethasone; GMP: Good Manufacturing Practice;
IFN-γ: Interferon-gamma; Io: ionomycin; MDDC: Monocyte Derived DC;
PBMCs: Peripheral Blood Mononuclear Cells; PMA: phorbol 12-myristate 13-
acetate; Rapa: rapamycin; tol-DC: tolerogenic DCs; Tregs: regulatory T cells;
VitD3: vitamin D3.
Acknowledgements and Funding
The authors thank Marco Fernández for his helpful advice with flow
cytometry experiments (Cytometry Unit of the IGTP). We also thank the
researchers of the Advanced Therapies Division (Banc Sang i Teixits) for their
continuous support. Grant Support: This work was supported, in part, by a
grant from Fundació La Marató de TV3 (07/2410) and Fundació GAEM (to
EMC). MNG is supported by a grant from the Spanish Ministry of Science
and Innovation and Blood and Tissue Bank (PTQ-09-02-017050). DRR is a
predoctoral fellow supported by project 07/2410 Fundació La Marató de
TV3. LGL is supported by a Rio Hortega grant from Instituto de Salud Carlos
III (ISCIII) Spanish Ministry of Health (CM07/00196). FEB is co-funded by the
stabilization program of Biomedical researches (CES07/015) of the ISCIII and
Direcció d’ Estratègia i Coordinació, Health Dept. of Catalonia.
Author details
1
Laboratory of Immunobiology for Research and Diagnosis (LIRAD). Blood
and Tissue Bank (BTB); Dept. of Cell Biology, Physiology and Immunology,
Universitat Autònoma de Barcelona, Institut Investigació Germans Trias i
Pujol, Spain.
2
Multiple Sclerosis Unit. Department of Neurosciences, Hospital
Universitari Germans Trias i Pujol Badalona Barcelona. Spain.
Authors’ contributions
MNG conceived and designed the study, performed most of the
experiments and drafted the manuscript. DRR carried out the
immunophenotyping and the determination of Tregs, participated in the
design of the study and helped in writing the manuscript. CO contributed in
cell culture techniques and analysed data. LGL participated in the statistical
analysis and interpretation of data. CR participated in the analysis and
revised the manuscript. RPB, head of the lab, critically revised the
manuscript. EMC participated in the coordination of the study and helped
to draft manuscript. FEB, author for correspondence, participated in the
design of the study, supervised the research, and revised the manuscript. All
authors read and approved the final manuscript.
Competing interests
The authors declare that they have no competing interests.
Received: 18 January 2011 Accepted: 9 June 2011
Published: 9 June 2011
References
1. Miller SD, Turley DM, Podojil JR: Antigen-specific tolerance strategies for
the prevention and treatment of autoimmune disease. Nat Rev Immuno
2007, 7(9):665-77.
2. van Duivenvoorde LM, van Mierlo GJ, Boonman ZF, Toes RE: Dendritic
cells: vehicles for tolerance induction and prevention of autoimmune
diseases. Immunobiology 2006, 211(6-8):627-32.
Naranjo-Gómez et al. Journal of Translational Medicine 2011, 9:89
/>Page 12 of 14
3. Morelli AE, Thomson AW: Tolerogenic dendritic cells and the quest for
transplant tolerance. Nat Rev Immunol 2007, 7(8):610-21.
4. Chuang JJ, Kleist C, Sandra-Petrescu F, Iancu M, Wang D, Opelz G,
Terness P: Suppressive dendritic cells as a tool for controlling allograft
rejection in organ transplantation: promises and difficulties. Hum
Immunol 2008, 69(3):p. 165-73.
5. van Kooten C, Lombardi G, Gelderman KA, Sagoo P, Buckland M, Lechler R,
Cuturi MC: Dendritic Cells as a Tool to Induce Transplantation Tolerance:
Obstacles and Opportunities. Transplantation 2011, 15(91(1)):2-7.
6. Thomson AW, Robbins PD: Tolerogenic dendritic cells for autoimmune
disease and transplantation. Ann Rheum Dis 2008, 67(Suppl 3):90-6, iii.
7. Hilkens CM, Isaacs JD, Thomson AW: Development of dendritic cell-based
immunotherapy for autoimmunity. Int Rev Immunol 29(2):p. 156-83.
8. Torres-Aguilar H, Blank M, Jara LJ, Shoenfeld Y: Tolerogenic dendritic cells
in autoimmune diseases: crucial players in induction and prevention of
autoimmunity. Autoimmun Rev 2010, 10(1):8-17.
9. Torres-Aguilar H, Aguilar-Ruiz SR, González-Pérez G, Munguía R, Bajaña S,
Meraz-Ríos MA, Sánchez-Torres C: Tolerogenic dendritic cells generated
with different immunosuppressive cytokines induce antigen-specific
anergy and regulatory properties in memory CD4+ T cells. J Immunol
2010, 184(4):1765-75.
10. Luther C, Adamopoulou E, Stoeckle C, Brucklacher-Waldert V, Rosenkranz D,
Stoltze L, Lauer S, Poeschel S, Melms A, Tolosa E: Prednisolone treatment
induces tolerogenic dendritic cells and a regulatory milieu in
myasthenia gravis patients. J Immunol 2009, 183(2) :841-8.
11. Harry RA, Anderson AE, Isaacs JD, Hilkens CM: Generation and
characterisation of therapeutic tolerogenic dendritic cells for rheumatoid
arthritis. Ann Rheum Dis 2010, 69(11):2042-50.
12. Banchereau J, Steinman RM: Dendritic cells and the control of immunity.
Nature 1998, 392(6673):245-52.
13. Morelli AE, Thomson AW: Dendritic cells: regulators of alloimmunity and
opportunities for tolerance induction. Immunol Rev 2003, 196:125-46.
14. Steinman RM: The dendritic cell system and its role in immunogenicity.
Annu Rev Immunol 1991, 9:271-96.
15. Steinman RM, Hawiger D, Nussenzweig MC: Tolerogenic dendritic cells.
Annu Rev Immunol 2003, 21:685-711.
16. Tatsumi T, Storkus WJ: Dendritic cell-based vaccines and therapies for
cancer. Expert Opin Biol Ther 2002, 2(8):919-28.
17. Figdor CG, de Vries IJ, Lesterhuis WJ, Melief CJ:
Dendritic cell
immunotherapy:
mapping
the way. Nat Med 2004, 10(5):475-80.
18. Palucka K, Banchereau J, Mellman I: Designing vaccines based on biology
of human dendritic cell subsets. Immunity 2010, 33(4):464-78.
19. Palucka K, Ueno H, Fay J, Banchereau J: Harnessing dendritic cells to
generate cancer vaccines. Ann N Y Acad Sci 2009, 1174:88-98.
20. Peng JC, Thomas R, Nielsen LK: Generation and maturation of dendritic
cells for clinical application under serum-free conditions. J Immunother
2005, 28(6):599-609.
21. Napoletano C, Pinto D, Bellati F, Taurino F, Rahimi H, Tomao F, Panici PB,
Rughetti A, Frati L, Nuti M: A comparative analysis of serum and serum-
free media for generation of clinical grade DCs. J Immunother 2007,
30(5):567-76.
22. D’Argenio DA, Wilson CB: A decade of vaccines: Integrating immunology
and vaccinology for rational vaccine design. Immunity 33(4):p. 437-40.
23. Germain RN: Vaccines and the future of human immunology. Immunity
2010, 33(4):441-50.
24. Hackstein H, Thomson AW: Dendritic cells: emerging pharmacological
targets of immunosuppressive drugs. Nat Rev Immunol 2004, 4(1):24-34.
25. Turnquist HR, Fischer RT, Thomson AW: Pharmacological modification of
dendritic cells to promote their tolerogenicity in transplantation.
Methods Mol Biol 2010, 595:135-48.
26. Verginis P, Li HS, Carayanniotis G: Tolerogenic semimature dendritic cells
suppress experimental autoimmune thyroiditis by activation of
thyroglobulin-specific CD4+CD25+ T cells. J Immunol 2005,
174(11):7433-9.
27. Min WP, Zhou D, Ichim TE, Strejan GH, Xia X, Yang J, Huang X, Garcia B,
White D, Dutartre P, Jevnikar AM, Zhong R: Inhibitory feedback loop
between tolerogenic dendritic cells and regulatory T cells in transplant
tolerance. J Immunol 2003, 170(3):1304-12.
28. Huang H, Dawicki W, Zhang X, Town J, Gordon JR: Tolerogenic dendritic
cells induce CD4+CD25hiFoxp3+ regulatory T cell differentiation from
CD4+CD25-/loFoxp3-effector T cells. J Immunol 2010, 185(9):5003-10.
29. Hill M, Cuturi MC: Negative vaccination by tolerogenic dendritic cells in
organ transplantation. Curr Opin Organ Transplant 2010.
30. Stoop JN, Harry RA, von Delwig A, Isaacs JD, Robinson JH, Hilkens CM:
Therapeutic effect of tolerogenic dendritic cells in established collagen-
induced arthritis is associated with a reduction in Th17 responses.
Arthritis Rheum 2010, 62(12):3656-65.
31. Quintana FJ, Murugaiyan G, Farez MF, Mitsdoerffer M, Tukpah AM, Burns EJ,
Weiner HL: An endogenous aryl hydrocarbon receptor ligand acts on
dendritic cells and T cells to suppress experimental autoimmune
encephalomyelitis. Proc Natl Acad Sci USA
2010, 107(48):20768-73.
32.
van
Duivenvoorde LM, Louis-Plence P, Apparailly F, van der Voort EI,
Huizinga TW, Jorgensen C, Toes RE: Antigen-specific immunomodulation
of collagen-induced arthritis with tumor necrosis factor-stimulated
dendritic cells. Arthritis Rheum 2004, 50(10):3354-64.
33. van Duivenvoorde LM, Han WG, Bakker AM, Louis-Plence P,
Charbonnier LM, Apparailly F, van der Voort EI, Jorgensen C, Huizinga TW,
Toes RE: Immunomodulatory dendritic cells inhibit Th1 responses and
arthritis via different mechanisms. J Immunol 2007, 179(3):1506-15.
34. Martin E, Capini C, Duggan E, Lutzky VP, Stumbles P, Pettit AR, O’Sullivan B,
Thomas R: Antigen-specific suppression of established arthritis in mice
by dendritic cells deficient in NF-kappaB. Arthritis Rheum 2007,
56(7):2255-66.
35. Adorini L: Tolerogenic dendritic cells induced by vitamin D receptor
ligands enhance regulatory T cells inhibiting autoimmune diabetes. Ann
N Y Acad Sci 2003, 987:258-61.
36. Marin-Gallen S, Clemente-Casares X, Planas R, Pujol-Autonell I, Carrascal J,
Carrillo J, Ampudia R, Verdaguer J, Pujol-Borrell R, Borràs FE, Vives-Pi M:
Dendritic cells pulsed with antigen-specific apoptotic bodies prevent
experimental type 1 diabetes. Clin Exp Immunol 2010, 160(2):207-14.
37. Nestle FO, Banchereau J, Hart D: Dendritic cells: On the move from bench
to bedside. Nat Med 2001, 7(7):761-5.
38. Cerundolo V, Hermans IF, Salio M: Dendritic cells: a journey from
laboratory to clinic. Nat Immunol 2004, 5(1):7-10.
39. Bluestone JA, Thomson AW, Shevach EM, Weiner HL: What does the future
hold for cell-based tolerogenic therapy? Nat Rev Immunol 2007,
7(8):650-4.
40. Rescigno M: Dendritic cells in tolerance induction for the treatment of
autoimmune diseases. Eur J Immunol 2010, 40(8):2119-23.
41. Steinman RM: Some active areas of DC research and their medical
potential. Eur J Immunol 2010, 40(8):2085-8.
42. Soldevila B, Alonso N, Martínez-Arconada MJ, Morillas RM, Planas R,
Sanmartí AM, Martínez-Cáceres EM: A prospective study of T-and B-
lymphocyte subpopulations, CD81 expression levels on B cells and
regulatory CD4(+) CD25(+) CD127(low/-) FoxP3(+) T cells in patients
with chronic HCV infection during pegylated interferon-alpha2a plus
ribavirin treatment. J Viral Hepat 2010.
43. Rutella S, Danese S, Leone G: Tolerogenic dendritic cells: cytokine
modulation comes of age. Blood 2006, 108(5):1435-40.
44. Adorini L, Penna G: Induction of tolerogenic dendritic cells by vitamin D
receptor agonists. Handb Exp Pharmacol 2009, , 188: 251-73.
45. van Kooten C, Stax AS, Woltman AM, Gelderman KA:
Handbook of
experimental
pharmacology “
dendritic cells": the use of dexamethasone
in the induction of tolerogenic DCs. Handb Exp Pharmacol 2009, , 188:
233-49.
46. Fischer R, Turnquist HR, Taner T, Thomson AW: Use of rapamycin in the
induction of tolerogenic dendritic cells. Handb Exp Pharmacol 2009, , 188:
215-32.
47. Anderson AE, Swan DJ, Sayers BL, Harry RA, Patterson AM, von Delwig A,
Robinson JH, Isaacs JD, Hilkens CM: LPS activation is required for
migratory activity and antigen presentation by tolerogenic dendritic
cells. J Leukoc Biol 2009, 85(2):243-50.
48. Penna G, Adorini L: 1 Alpha,25-dihydroxyvitamin D3 inhibits
differentiation, maturation, activation, and survival of dendritic cells
leading to impaired alloreactive T cell activation. J Immunol 2000,
164(5):2405-11.
49. Fazekasova H, Golshayan D, Read J, Tsallios A, Tsang JY, Dorling A,
George AJ, Lechler RI, Lombardi G, Mirenda V: Regulation of rat and
human T-cell immune response by pharmacologically modified dendritic
cells. Transplantation 2009, 87(11):1617-28.
50. Woltman AM, van der Kooij SW, de Fijter JW, van Kooten C: Maturation-
resistant dendritic cells induce hyporesponsiveness in alloreactive
Naranjo-Gómez et al. Journal of Translational Medicine 2011, 9:89
/>Page 13 of 14
CD45RA+ and CD45RO+ T-cell populations. Am J Transplant 2006,
6(11):2580-91.
51. Hackstein H, Taner T, Zahorchak AF, Morelli AE, Logar AJ, Gessner A,
Thomson AW: Rapamycin inhibits IL-4–induced dendritic cell maturation
in vitro and dendritic cell mobilization and function in vivo. Blood 2003,
101(11):4457-63.
52. Steinbrink K, Wölfl M, Jonuleit H, Knop J, Enk AH: Induction of tolerance by
IL-10-treated dendritic cells. J Immunol 1997, 159(10):4772-80.
53. Haidinger M, Poglitsch M, Geyeregger R, Kasturi S, Zeyda M, Zlabinger GJ,
Pulendran B, Hörl WH, Säemann MD, Weichhart T: A versatile role of
mammalian target of rapamycin in human dendritic cell function and
differentiation. J Immunol 2010, 185(7):3919-31.
54. Karimi MH, Ebadi P, Pourfathollah AA, Moazzeni M, Soheili ZS, Samiee S:
Comparison of Three Techniques for Generation of Tolerogenic
Dendritic Cells: siRNA, Oligonucleotide Antisense, and Antibody
Blocking. Hybridoma (Larchmt) 2010, 29(6):473-80.
55. Svajger U, Obermajer N, Jeras M: Novel findings in drug-induced dendritic
cell tolerogenicity. Int Rev Immunol 2010, 29(6):574-607.
56. Xiao BG, Huang YM, Link H: Tolerogenic dendritic cells: the ins and outs
of outcome. J Immunother 2006, 29(5):465-71.
57. Pulendran B, Tang H, Manicassamy S: Programming dendritic cells to
induce T(H)2 and tolerogenic responses. Nat Immunol 2010, 11(8):647-55.
58. Xia CQ, Peng R, Beato F, Clare-Salzler MJ: Dexamethasone induces IL-10-
producing monocyte-derived dendritic cells with durable immaturity.
Scand J Immunol 2005, 62(1):45-54.
59. Xing N, L Maldonado ML, Bachman LA, McKean DJ, Kumar R, Griffin MD:
Distinctive dendritic cell modulation by vitamin D(3) and glucocorticoid
pathways. Biochem Biophys Res Commun 2002, 297(3):645-52.
60. Griffin MD, Xing N, Kumar R: Gene expression profiles in dendritic cells
conditioned by 1alpha,25-dihydroxyvitamin D3 analog. J Steroid Biochem
Mol Biol 2004, 89-90(1-5):443-8.
61. Monti P, Mercalli A, Leone BE, Valerio DC, Allavena P, Piemonti L:
Rapamycin impairs antigen uptake of human dendritic cells.
Transplantation 2003, 75(1):137-45.
62. Jonuleit H, Schmitt E, Steinbrink K, Enk AH: Dendritic cells as a tool to
induce anergic and regulatory T cells. Trends Immunol 2001, 22(7):394-400.
63. Kubsch S, Graulich E, Knop J, Steinbrink K: Suppressor activity of anergic T
cells induced by IL-10-treated human dendritic cells: association with IL-
2-and CTLA-4-dependent G1 arrest of the cell cycle regulated by
p27Kip1. Eur J Immunol 2003, 33(7):1988-97.
64. Battaglia M, Stabilini A, Roncarolo MG: Rapamycin selectively expands CD4
+CD25+FoxP3+ regulatory T cells. Blood 2005, 105(12):4743-8.
65. Maldonado RA, von Andrian UH: How tolerogenic dendritic cells induce
regulatory T cells. Adv Immunol 2010, 108 :111-65.
66. Steinbrink K, Graulich E, Kubsch S, Knop J, Enk AH: CD4(+) and CD8(+)
anergic T cells induced by interleukin-10-treated human dendritic cells
display antigen-specific suppressor activity. Blood 2002, 99(7):2468-76.
67. Cobbold SP, Adams E, Nolan KF, Regateiro FS, Waldmann H: Connecting
the mechanisms of T-cell regulation: dendritic cells as the missing link.
Immunol Rev 2010, 236:203-18.
68. Francisco LM, Sage PT, Sharpe AH: The PD-1 pathway in tolerance and
autoimmunity. Immunol Rev 2010, 236:219-42.
69. Sakaguchi S: Regulatory T cells: key controllers of immunologic self-
tolerance. Cell 2000, 101(5):455-8.
70. Shevach EM, McHugh RS, Thornton AM, Piccirillo C, Natarajan K,
Margulies DH: Control of autoimmunity by regulatory T cells. Adv Exp
Med Biol 2001, 490:21-32.
71. Maloy KJ, Powrie F: Regulatory T cells in the control of immune
pathology. Nat Immunol 2001, 2(9):816-22.
72. Liu W, Putnam AL, Xu-Yu Z, Szot GL, Lee MR, Zhu S, Gottlieb PA,
Kapranov P, Gingeras TR, Fazekas de St Groth B, Clayberger C, Soper DM,
Ziegler SF, Bluestone JA: CD127 expression inversely correlates with
FoxP3 and suppressive function of human CD4+ T reg cells. J Exp Med
2006, 203(7):1701-11.
73. Sakaguchi S, Miyara M, Costantino CM, Hafler DA: FOXP3+ regulatory T
cells in the human immune system. Nat Rev Immunol 2010, 10(7):490-500.
74. Simonetta F, Chiali A, Cordier C, Urrutia A, Girault I, Bloquet S, Tanchot C,
Bourgeois C: Increased CD127 expression on activated FOXP3+CD4+
regulatory T cells. Eur J Immuno 2010, 40(9):2528-38.
75. Kang J, Huddleston SJ, Fraser JM, Khoruts A: De novo induction of
antigen-specific CD4+CD25+Foxp3+ regulatory T cells in vivo following
systemic antigen administration accompanied by blockade of mTOR. J
Leukoc Biol 2008, 83(5):1230-9.
76. Munn DH, Sharma MD, Mellor AL: Ligation of B7-1/B7-2 by human CD4+
T cells triggers indoleamine 2,3-dioxygenase activity in dendritic cells. J
Immunol 2004, 172(7):4100-10.
77. Penna G, Roncari A, Amuchastegui S, Daniel KC, Berti E, Colonna M,
Adorini L: Expression of the inhibitory receptor ILT3 on dendritic cells is
dispensable for induction of CD4+Foxp3+ regulatory T cells by 1,25-
dihydroxyvitamin D3. Blood 2005, 106(10)
:3490-7.
78. Roncarolo MG, Bacchetta R, Bordignon C, Narula S, Levings MK: Type 1 T
regulatory cells. Immunol Rev 2001, 182:68-79.
79. Roncarolo MG, Gregori S, Battaglia M, Bacchetta R, Fleischhauer K,
Levings MK: Interleukin-10-secreting type 1 regulatory T cells in rodents
and humans. Immunol Rev 2006, 212:28-50.
80. Weiner HL: Induction and mechanism of action of transforming growth
factor-beta-secreting Th3 regulatory cells. Immunol Rev 2001, 182:207-14.
doi:10.1186/1479-5876-9-89
Cite this article as: Naranjo-Gómez et al.: Comparative study of clinical
grade human tolerogenic dendritic cells. Journal of Translational Medicine
2011 9:89.
Submit your next manuscript to BioMed Central
and take full advantage of:
• Convenient online submission
• Thorough peer review
• No space constraints or color figure charges
• Immediate publication on acceptance
• Inclusion in PubMed, CAS, Scopus and Google Scholar
• Research which is freely available for redistribution
Submit your manuscript at
www.biomedcentral.com/submit
Naranjo-Gómez et al. Journal of Translational Medicine 2011, 9:89
/>Page 14 of 14