báo cáo hóa học:" Comparisons of the M1 genome segments and encoded µ2 proteins of different reovirus isolates" doc
Bạn đang xem bản rút gọn của tài liệu. Xem và tải ngay bản đầy đủ của tài liệu tại đây (986.15 KB, 17 trang )
BioMed Central
Page 1 of 17
(page number not for citation purposes)
Virology Journal
Open Access
Research
Comparisons of the M1 genome segments and encoded µ2 proteins
of different reovirus isolates
Peng Yin
1,2
, Natalie D Keirstead
1,3
, Teresa J Broering
4,5
, Michelle M Arnold
4,6
,
John SL Parker
4,7
, Max L Nibert
4,6
and Kevin M Coombs*
1
Address:
1
Department of Medical Microbiology and Infectious Diseases, University of Manitoba, Winnipeg, MB, R3E 0W3 Canada,
2
Thrasos
Therapeutics, Hopkinton, MA 01748 USA,
3
Department of Pathobiology, Ontario Veterinary College, Guelph, ON, N1G 2W1 Canada,
4
Department of Microbiology and Molecular Genetics, Harvard Medical School, Boston, MA, 02115 USA,
5
Massachusetts Biologic Laboratories,
Jamaica Plain, MA 02130-3597 USA,
6
Virology Training Program, Division of Medical Sciences, Harvard University, Cambridge, MA 02138 USA
and
7
James A. Baker Institute for Animal Health, College of Veterinary Medicine, Cornell University, Ithaca, NY 14853 USA
Email: Peng Yin - ; Natalie D Keirstead - ; Teresa J Broering - ;
Michelle M Arnold - ; John SL Parker - ;
Max L Nibert - ; Kevin M Coombs* -
* Corresponding author
Abstract
Background: The reovirus M1 genome segment encodes the µ2 protein, a structurally minor
component of the viral core, which has been identified as a transcriptase cofactor, nucleoside and
RNA triphosphatase, and microtubule-binding protein. The µ2 protein is the most poorly
understood of the reovirus structural proteins. Genome segment sequences have been reported
for 9 of the 10 genome segments for the 3 prototypic reoviruses type 1 Lang (T1L), type 2 Jones
(T2J), and type 3 Dearing (T3D), but the M1 genome segment sequences for only T1L and T3D
have been previously reported. For this study, we determined the M1 nucleotide and deduced µ2
amino acid sequences for T2J, nine other reovirus field isolates, and various T3D plaque-isolated
clones from different laboratories.
Results: Determination of the T2J M1 sequence completes the analysis of all ten genome segments
of that prototype. The T2J M1 sequence contained a 1 base pair deletion in the 3' non-translated
region, compared to the T1L and T3D M1 sequences. The T2J M1 gene showed ~80% nucleotide
homology, and the encoded µ2 protein showed ~71% amino acid identity, with the T1L and T3D
M1 and µ2 sequences, respectively, making the T2J M1 gene and µ2 proteins amongst the most
divergent of all reovirus genes and proteins. Comparisons of these newly determined M1 and µ2
sequences with newly determined M1 and µ2 sequences from nine additional field isolates and a
variety of laboratory T3D clones identified conserved features and/or regions that provide clues
about µ2 structure and function.
Conclusions: The findings suggest a model for the domain organization of µ2 and provide further
evidence for a role of µ2 in viral RNA synthesis. The new sequences were also used to explore the
basis for M1/µ2-determined differences in the morphology of viral factories in infected cells. The
findings confirm the key role of Ser/Pro208 as a prevalent determinant of differences in factory
morphology among reovirus isolates and trace the divergence of this residue and its associated
phenotype among the different laboratory-specific clones of type 3 Dearing.
Published: 23 September 2004
Virology Journal 2004, 1:6 doi:10.1186/1743-422X-1-6
Received: 29 July 2004
Accepted: 23 September 2004
This article is available from: />© 2004 Yin et al; licensee BioMed Central Ltd.
This is an open-access article distributed under the terms of the Creative Commons Attribution License ( />),
which permits unrestricted use, distribution, and reproduction in any medium, provided the original work is properly cited.
Virology Journal 2004, 1:6 />Page 2 of 17
(page number not for citation purposes)
Background
RNA viruses represent the most significant and diverse
group of infectious agents for eukaryotic organisms on
earth [1,2]. Virtually every RNA virus, except retroviruses,
must use an RNA-dependent RNA polymerase (RdRp) to
copy its RNA genome into progeny RNA, an essential step
in viral replication and assembly. The virally encoded
RdRp is not found in uninfected eukaryotic cells and
therefore represents an attractive target for chemothera-
peutic strategies to combat RNA viruses. A better under-
standing of the structure/function relationships of RNA-
virus RdRps has been gained from recent determinations
of X-ray crystal structures for several of these proteins,
including the RdRps of poliovirus, hepatitis C virus, rabbit
calicivirus, and mammalian orthoreovirus [3-6]. How-
ever, the diverse and complex functions and regulation of
these enzymes, including their interactions with other
viral proteins and cis-acting signals in the viral RNAs,
determine that we have hardly scratched the surface for
understanding most of them.
The nonfusogenic mammalian orthoreoviruses (reovi-
ruses) are prototype members of the family Reoviridae,
which includes segmented double-stranded RNA
(dsRNA) viruses of both medical (rotavirus) and eco-
nomic (orbivirus) importance (reviewed in [7-9]). Reovi-
ruses have nonenveloped, double-shelled particles
composed of eight different structural proteins encasing
the ten dsRNA genome segments. Reovirus isolates (or
"strains") can be grouped into three serotypes, repre-
sented by three commonly studied prototype isolates:
type 1 Lang (T1L), type 2 Jones (T2J), and type 3 Dearing
(T3D). Sequences have been reported for all ten genome
segments of T1L and T3D, as well as for nine of the ten
segments of T2J (all but the M1 segment) (e.g., see
[10,11]). Each of these segments encodes either one or
two proteins on one of its strands, the plus strand. After
cell entry, transcriptase complexes within the infecting
reovirus particles synthesize and release full-length,
capped plus-strand copies of each genome segment. These
plus-strand RNAs are used as templates for translation by
the host machinery as well as for minus-strand synthesis
by the viral replicase complexes. The latter process pro-
duces the new dsRNA genome segments for packaging
into progeny particles. The particle locations and func-
tions of most of the reovirus proteins have been deter-
mined by a combination of genetic, biochemical, and
biophysical techniques over the past 50 years (reviewed in
[8]).
Previous studies have identified the reovirus λ3 protein,
encoded by the L1 genome segment, as the viral RdRp
[6,12-14]. Protein λ3 is a minor component of the inner
capsid, present in only 10–12 copies per particle [15]. It
has been proposed to bind to the interior side of the inner
capsid, near the icosahedral fivefold axes, and recent work
has precisely localized it there [16,17]. In solution, puri-
fied λ3 mediates a poly(C)-dependent poly(G)-polymer-
ase activity, but it has not been shown to use virus-specific
dsRNA or plus-strand RNA as template for plus- or minus-
strand RNA synthesis, respectively [14]. This lack of activ-
ity with virus-specific templates suggests that viral or cel-
lular cofactors may be required to make λ3 fully
functional. Within the viral particle, where only viral pro-
teins are known to reside, these cofactors are presumably
viral in origin. The crystal structure of λ3 has provided
substantial new information about the organization of its
sequences and has suggested several new hypotheses
about its functions in viral RNA synthesis and the possible
roles of cofactors in these functions [6]. Notably, crystal-
lized λ3 uses short viral and nonviral oligonucleotides as
templates for RNA synthesis to yield short dsRNA prod-
ucts [6].
The reovirus µ2 protein has been proposed as a tran-
scriptase cofactor, but it remains the most functionally
and structurally enigmatic of the eight proteins found in
virions. Like λ3, µ2 is a minor component of the inner
capsid, present in only 20–24 copies per particle [15]. It is
thought to associate with λ3 in the particle interior, in
close juxtaposition to the icosahedral fivefold axes, but
has not been precisely localized there [16,17]. A recent
study has shown that purified µ2 and λ3 can interact in
vitro [18]. The M1 genome segment that encodes µ2 is
genetically associated with viral strain differences in the in
vitro transcriptase and nucleoside triphosphatase
(NTPase) activities of viral particles [19,20]. Recent work
with purified µ2 has shown that it can indeed function in
vitro as both an NTPase and an RNA 5'-triphosphatase
[18]. The µ2 protein has also been shown to bind RNA
and to be involved in formation of viral inclusions, also
called "factories", through microtubule binding in
infected cells [18,21-23]. Nevertheless, its precise func-
tion(s) in the reovirus replication cycle remain unclear.
Other studies have indicated that the µ2-encoding M1 seg-
ment genetically determines the severity of cytopathic
effect in mouse L929 cells, the frequency of myocarditis in
infected mice, the levels of viral growth in cardiac myo-
cytes and endothelial cells, the degree of organ-specific
virulence in severe combined immunodeficiency mice,
and the level of interferon induction in cardiac myocytes
[24-29]. The complete sequence of the M1 segment has
been reported for both T1L and T3D [23,30,31]. However,
computer-based comparisons of the M1 and µ2 sequences
to others in GenBank have previously failed to show sig-
nificant homology to other proteins, so that no clear indi-
cations of µ2 function have come from that approach.
Nevertheless, small regions of sequence similarity to NTP-
binding motifs have been identified near the middle of
µ2, and recent work has indicated that mutations in one
Virology Journal 2004, 1:6 />Page 3 of 17
(page number not for citation purposes)
of these regions indeed abrogates the triphosphatase
activities of µ2 [18,20].
For this study, we performed nucleotide-sequence deter-
minations of the M1 genome segments of reovirus T2J,
nine other reovirus field isolates, and reovirus T3D clones
obtained from several different laboratories. The determi-
nation of the T2J M1 sequence completes the sequence
determination of all ten genome segments of that proto-
type strain. We reasoned that comparisons of additional
M1 and µ2 sequences may reveal conserved features and/
or regions that provide clues about µ2 structure and func-
tion. The findings provide further evidence for a role of µ2
in viral RNA synthesis. We also took advantage of the
newly available sequences to explore the basis for M1/µ2-
determined strain differences in the morphology of viral
factories in reovirus-infected cells.
Results and Discussion
M1 nucleotide and
µ
2 amino acid sequences of reovirus
T2J and nine other field isolates
We determined the nucleotide sequence of the M1
genome segment of reovirus T2J to complete the sequenc-
ing of that isolate's genome. T2J M1 was found to be 2303
base pairs in length (GenBank accession no. AF124519)
(Table 1). This is one shorter than the M1 segments of reo-
viruses T1L and T3D [23,30,31], due to a single base-pair
deletion in T2J corresponding to position 2272 in the 3'
nontranslated region of the T1L and T3D plus strands
(Fig. 1, Table 1). Like those of T1L and T3D, the T2J-M1
plus strand contains a single long open reading frame,
encoding a µ2 protein of 736 amino acids (Fig. 2, Table
1), having the same start and stop codons (Fig. 1), and
having a 5' nontranslated region that is only 13 nucle-
otides in length (Table 1). Because of the single-base dele-
tion described above, the 3' nontranslated region of the
T2J M1 plus strand is only 82 nucleotides in length, com-
pared to 83 for T1L and T3D (Table 1). Regardless, M1 has
the longest 3' nontranslated region of any of the genome
segments of these viruses, the next longest being 73 nucle-
otides in S3 (reviewed in [32]).
To gain further insights into µ2 structure/function rela-
tionships, we determined the M1 nucleotide sequences of
nine other reovirus field isolates [33,34]. The M1 seg-
ments of each of these viruses were found to be 2304 base
pairs in length (GenBank accession nos. AY428870 to
AY428877 and AY551083), the same as T1L and T3D M1
(Fig. 1). Like those of T1L, T2J, and T3D, the M1 plus
strand from each of the field isolates contains a single
long open reading frame, again encoding a µ2 protein of
736 amino acids (Fig. 2) and having the same start and
stop codons (Fig. 1). Their 5' and 3' nontranslated regions
are therefore the same lengths as those of T1L and T3D M1
(Table 1). As part of this study, we also determined the M1
nucleotide sequences of the reovirus T1L and T3D clones
routinely used in the Coombs laboratory. We found these
sequences to be identical to those recently reported for the
respective Nibert laboratory clones [23].
Further comparisons of the M1 nucleotide sequences
The T2J M1 genome segment shares 71–72% homology
with those of both T1L and T3D (Table 2). This makes T2J
M1 the most divergent of all nonfusogenic mammalian
orthoreovirus genome segments examined to date, with
the exception of the S1 segment, which encodes the
Table 1: Features of M1 genome segments and µ2 proteins from different reovirus isolates
Reovirus isolate
a
M2 or µ2
property
b
T1L
c
T2J T3D
d
T3D
e
T1C11 T1C29 T1N84 T2N84 T2S59 T3C12 T3C18 T3C44 T3N83
Accession no.: X59945 AF124519 M27261 AF461683 AY428870 AY428871 AY428872 AY428873 AY428874 AY551083 AY428875 AY428876 AY428877
total nuc 2304 2303 2304 2304 2304 2304 2304 2304 2304 2304 2304 2304 2304
5' NTR 13131313131313131313131313
3' NTR 83828383838383838383838383
total AA 736 736 736 736 736 736 736 736 736 736 736 736 736
mass (kDa) 83.3 84.0 83.3 83.2 83.2 83.3 83.4 83.3 83.5 83.2 83.3 83.3 83.4
pI 6.92 7.44 6.98 6.89 7.10 7.09 6.98 6.92 6.96 6.89 6.92 7.09 7.01
Asp+Glu 85848585848485858485858485
Arg+Lys+His 102 105 102 101 103 103 102 102 100 101 102 103 103
a
Abbreviations defined in text.
b
nuc, nucleotides; NTR, nontranslated region; AA, amino acids; pI, isoelectric point.
c
All indicated values are the same for the T1L M1 and µ2 sequences obtained for the Brown laboratory clone [31] (indicated GenBank accession
number), the Nibert laboratory clone [23]; GenBank accession no. AF461682), and the Coombs laboratory clone (this study).
d
T3D M1 and µ2 sequences for the Joklik laboratory clone [30] (indicated GenBank accession number), and the Cashdollar laboratory clone [23];
GenBank accession no. AF461684).
e
T3D M1 and µ2 sequences for the Nibert laboratory clone [23] and the Coombs laboratory clone (this study).
Virology Journal 2004, 1:6 />Page 4 of 17
(page number not for citation purposes)
attachment protein σ1 and which shows less than 60%
nucleotide sequence homology between serotypes
[35,36]; reviewed in [11]. In contrast, the homology
between T1L and T3D M1 is ~98%, among the highest val-
ues seen to date between reovirus genome segments from
distinct field isolates [11,31,34,37-39].
The M1 genome segments of the nine other reovirus iso-
lates examined in this study are much more closely related
to those of T1L and T3D than to that of T2J (Table 2), as
also clearly indicated by phylogenetic analyses (Fig. 3 and
data not shown). Such greater divergence of the gene
sequences of T2J has been observed to date with other seg-
ments examined from multiple reovirus field isolates
[11,34,37-39]. Type 2 simian virus 59 (T2S59) has the
next most broadly divergent M1 sequence, but it is no
more similar to the M1 sequence of T2J than it is to that
of the other isolates (Table 2, Fig. 3). In sum, the results of
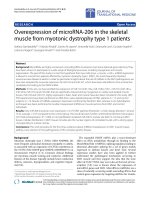
Sequences near the 5' (A) and 3' (B) ends of the M1 plus strands of 14 reovirus isolatesFigure 1
Sequences near the 5' (A) and 3' (B) ends of the M1 plus strands of 14 reovirus isolates. The start and stop codons are indi-
cated by bold and underline, respectively. The one-base deletion in the 3' noncoding region of the T2J sequence is indicated by
a triangle. Positions at which at least one sequence differs from the others are indicated by dots. GenBank accession numbers
for corresponding sequences are indicated between the clones' names and 5' sequences in "A". Clones are: T1L (type 1, Lang),
T1C11 (type 1, clone 11), T1C29 (type 1, clone 29), T1N84 (type 1, Netherlands 1984), T2J (type 2, Jones), T2N84 (type 2,
Netherlands 1984), T2S59 (type 2, simian virus 59), T3D (type 3, Dearing), T3C12 (type 3, clone 12), T3C18 (type 3, clone 18),
T3C44 (type 3, clone 44), and T3N83 (type 3, Netherlands 1983). T1L clones were obtained from Dr. E.G. Brown (Brown) or
our laboratories (Coombs/Nibert). T3D clones were obtained from Drs. W.K. Joklik, L.W. Cashdollar (Joklik/Cashdollar) and
our laboratories (Coombs/Nibert).
B
! !! ! ! !!! !!! ! !! !
L
3'
T1L GCGUGAUCCGUGACAUGCGUAGUGUGACACCUGCCCCUAGGUCAAUGGGGGUAGGGGGCGGGCUAAGACUACGUACGCGCUUCAUC 2304
T1L GCGUGA
UCCGUGACAUGCGUAGUGUGACACCUGCCCCUAGGUCAAUGGGGGUAGGGGGCGGGCUAAGACUACGUACGCGCUUCAUC 2304
T2J GCGUGAGUCGGGUCAUGCAACGUCGAACACCUGCCCCAUGGUCAAUGGGGGUAGGGG CGGGCUAAGACUACGUACGCGCUUCAUC 2303
T3D GCGUGA
UCCGUGACAUGCGUAGUGUGACACCUGCUCCUAGGUCAAUGGGGGUAGGGGGCGGGCUAAGACUACGUACGCGCUUCAUC 2304
T3D GCGUGA
UCCGUGACAUGCGUAGUGUGACACCUGCUCCUAGGUCAAUGGGGGUAGGGGGCGGGCUAAGACUACGUACGCGCUUCAUC 2304
T1C11 GCGUGA
UCCGUGACAUGCGUAGUGUGACACCUGCCCCUAGGUCAAUGGGGGUAGGGGGCGGGCUAAGACUACGUACGCGCUUCAUC 2304
T1C29 GCGUGA
UCCGUGACAUGCGUAGUGUGACACCUGCCCCUAGGUCAAUGGGGGUAGGGGGCGGGCUAAGACUACGUACGCGCUUCAUC 2304
T1N84 GUGUGA
UCCGUGUCAUGCGUAGUGUGACACCUGCCCCUGGGUCAACGGGGGUAGGGGGCGGGCUAAGACUACGUACGCGCUUCAUC 2304
T2N84 GCGUGA
UCCGUGACAUGCGUAGUGUGACACCUGCCCCUGGGUCAAUGGGGGUAGGGGGCGGGCUAAGACUACGUACGCGCUUCAUC 2304
T2S59 GCGUGA
UCCGUGACAUGCGUAGUAUGACACCUGCCCCCAGGUCAAAGGGGGUAGGGGGCGGGCUAAGACUACGUACGCGCUUCAUC 2304
T3C12 GCGUGA
UCCGUGACAUGCGUAGUGUGACACCUGCUCCUAGGUCAAUGGGGGUAGGGGGCGGGCUAAGACUACGUACGCGCUUCAUC 2304
T3C18 GCGUGA
UCCGUGACAUGCGUAGUGUGACACCUGCCCCUAGGUCAAUGGGGGUAGGGGGCGGGCUAAGACUACGUACGCGCUUCAUC 2304
T3C44 GCGUGA
UCCGUGACAUGCGUAGUGUGACACCUGCCCCUAGGUCAAUGGGGGUAGGGGGCGGGCUAAGACUACGUACGCGCUUCAUC 2304
T3N83 GCGUGA
UCCGUGACAUGCGUAGUGUGACACCUGCCCCUAGGUCAAUGGGGGUAGGGGGCGGGCUAAGACUACGUACGCGCUUCAUC 2304
A
Accession
No.
5'
!!
T1L(Brown) X59945 GCUAUUCGCGGUC
AUGGCUUACAUCGCAGUUCCUGCGGUG 40
T1L(Coombs/Nibert) AF461682 GCUAUUCGCGGUCAUG GCUUACAUCGCAGUUCCUGCGGUG 40
T2J AF124519 GCUAUUCGCGGUCAUG GCUUACGUCGCAGUUCCUGCGGUC 40
T3D(Joklik/Cashdollar) M27261 GCUAUUCGCGGUCAUG GCUUACAUCGCAGUUCCUGCGGUG 40
T3D(Coombs/Nibert) AF461683 GCUAUUCGCGGUCAUG GCUUACAUCGCAGUUCCUGCGGUG 40
T1C11 AY428870 GCUAUUCGCGGUCAUG GCUUACAUCGCAGUUCCUGCGGUG 40
T1C29 AY428871 GCUAUUCGCGGUCAUG GCUUACAUCGCAGUUCCUGCGGUG 40
T1N84 AY428872 GCUAUUCGCGGUCAUG GCUUACAUCGCAGUUCCUGCGGUG 40
T2N84 AY428873 GCUAUUCGCGGUCAUG GCUUACAUCGCAGUUCCUGCGGUG 40
T2S59 AY428874 GCUAUUCGCGGUCAUG GCUUACAUCGCAGUUCCUGCGGUG 40
T3C12 AY551083 GCUAUUCGCGGUCAUG GCUUACAUCGCAGUUCCUGCGGUG 40
T3C18 AY428875 GCUAUUCGCGGUCAUG GCUUACAUCGCAGUUCCUGCGGUG 40
T3C44 AY428876 GCUAUUCGCGGUCAUG GCUUACAUCGCAGUUCCUGCGGUG 40
T3N83 AY428877 GCUAUUCGCGGUCAUG GCUUACAUCGCAGUUCCUGCGGUG 40
5'
Virology Journal 2004, 1:6 />Page 5 of 17
(page number not for citation purposes)
Alignment of the deduced µ2 amino acid sequences of T1L, T2J, T3D, and various field isolatesFigure 2
Alignment of the deduced µ2 amino acid sequences of T1L, T2J, T3D, and various field isolates. The single-letter amino acid
code is used, and only the T1L µ2 sequence from the Brown laboratory is shown in its entirety. For other isolates, only those
amino acids that differ from this T1L sequence are shown. Clones arranged in same order as in Fig. 1; the second T1L µ2
sequence is from the Nibert and Coombs laboratories, the first T3D µ2 sequence is from the Joklik and Cashdollar laborato-
ries, and the second T3D µ2 sequence is from the Nibert and Coombs laboratories. Amino acid positions are numbered above
the sequences. Some symbols represent various nonconservative changes among the isolates: *, change involving a charged res-
idue; § change involving an aromatic residue; †, change involving a proline residue; ‡, change involving a cysteine residue. Resi-
due 208, which has been previously shown to affect microtubule association by µ2, is indicated by a filled diamond. Residues
410–420 and 446–449, which have been previously identified as NTP-binding motifs are indicated by filled circles. Consecutive
runs of wholly conserved residues ≥ 15 amino acids in length are indicated by the lines numbered 1 to 8.
10 20 30 40 50 60 70 80 90 100 110 120
12
3
T1L MAYIAVPAVVDSRSSEAIGLLESFGVDAGADANDVSYQDHDYVLDQLQYMLDGYEAGDVIDALVHKNWLHHSVYCLLPPKSQLLEYWKSNPSVIPDNVDRRLRKRLMLKKDLRKDDEYNQLARAF
T2J V T TKEES Q YR E A ES M V
T3D A
T1C11 A
T1C29 A
T1N84 S A
T2N84 A
T2S59 V I Y A
T3C18 A
T3C44 A
T3N83 R A
130 140 150 160 170 180 190 200 210 220 230 240 250
4
T1L KISDVYAPLISSTTSPMTMIQNLNQGEIVYTTTDRVIGARILLYAPRKYYASTLSFTMTKCIIPFGKEVGRVPHSRFNVGTFPSIATPKCFVMSGVDIESIPNEFIKLFYQRVKSVHANILNDIS
T2J L T V S SI NQ S S SA LNR Y N APIG A I L S L S R
T3D S
T1C11
T1C29 Q
T1N84
T2N84 V R
T2S59 N S A S R
T3C18
T3C44 Q
T3N83 F I
T3C12 A
T3C12 S
∗∗∗∗
∗
∗
♦
∗∗ ∗
∗
†
§
†
§
T1L
T3D A
260 270 280 290 300 310 320 330 340 350 360 370
T1L PQIVSDMINRKRLRVHTPSDRRAAQLMHLPYHVKRGASHVDVYKVDVVDVLLEVVDVADGLRNVSRKLTMHTVPVCILEMLGIEIADYCIRQEDGMFTDWFLLLTMLSDGLTDRRTHCQYLINPS
T2J LL LQ SS NE KI I T R F IK S LQ SVI LI L T K N I S
T3D M F L
T1C11 F
T1C29 F I
T1N84 A F V R
T2N84 F
T2S59 I S Q R L
T3C18 F
T3C44 F I
T3N83 F
T3C12 M F L
∗∗∗∗
‡ ‡
∗
§§
380 390 400 410 420 430 440 450 460 470 480 490 500
56
T1L SVPPDVILNISITGFINRHTIDVMPDIYDFVKPIGAVLPKGSFKSTIMRVLDSISILGVQIMPRAHVVDSDEVGEQMEPTFEHAVMEIYKGIAGVDSLDDLIKWVLNSDLIPHDDRLGQLFQAFL
T2J I I YVS T RV EM EMEV R C R Q EE N GP E K Y S
T3D I Q
T1C11 I L
T1C29 V I
T1N84 M
T2N84 V
T2S59 V M V T
T3C18 I L
T3C44 V I
T3N83 F I L P
T3C12 I Q
†
∗∗∗∗∗∗∗∗
‡
¤
•••••• ••••••
§§
•••
510 520 530 540 550 560 570 580 590 600 610 620
7
T1L PLAKDLLAPMARKFYDNSMSEGRLLTFAHADSELLNANYFGHLLRLKIPYITEVNLMIRKNREGGELFQLVLSYLYKMYATSAQPKWFGSLLRLLICPWLHMEKLIGEADPASTSAEIGWHIPRE
T2J V H EE L F M M D A I V K
T3D
T1C11
T1C29 S L
T1N84
T2N84 V
T2S59 F TT V
T3C18 V
T3C44 S L
T3N83
T3C12
8
†
∗
†
∗
§
630 640 650 660 670 680 690 700 710 720 730
T1L QLMQDGWCGCEDGFIPYVSIRAPRLVMEELMEKNWGQYHAQVIVTDQLVVGEPRRVSAKAVIKGNHLPVKLVSRFACFTLTAKYEMRLSCGHSTGRGAAYNARLAFRSDLA
T2J H T V K L R R E H RV M S I Y S MR M H T I SS G V S
T3D I S
T1C11 K I
T1C29 V S I R I I C
T1N84 I V I R V
T2N84 I M I
T2S59 I I R L N
T3C18 I S
T3C44 V S I R I I C
T3N83 AI V S
T3C12 I S
‡ †
∗∗∗
∗
∗∗∗∗
T1L
T3D I S
T3D
T1L
T3D I Q
T1L
T3D M F L M
T3D R
T1L
T1L
F
Virology Journal 2004, 1:6 />Page 6 of 17
(page number not for citation purposes)
this study provided little or no evidence for divergence of
the M1 sequences along the lines of reovirus serotype (Fig.
3), consistent with independent reassortment and evolu-
tion of the M1 and S1 segments in nature. Upon consid-
ering the sources of these isolates [34], the results
similarly provided little or no evidence for divergence of
the M1 sequences along the lines of host, geographic
locale, or date of isolation (Fig. 3). These findings are con-
sistent with ongoing exchange of M1 segments among
reovirus strains cocirculating in different hosts and
locales. Similar conclusions have been indicated by previ-
ous studies of other genome segments from multiple reo-
virus field isolates [11,34,37-39]. The M1 nucleotide
sequence of type 3 clone 12 (T3C12) is almost identical to
that of the T3D clone in use in the Coombs and Nibert
laboratories, with only a single silent change (U→C) at
plus-strand position 1532 (i.e., 99.9+% homology). How-
ever, several of the T3C12 genome segments show distin-
guishable mobilities in polyacrylamide gels (data not
shown), confirming that T3C12 is indeed a distinct
isolate.
Further comparisons of the
µ
2 protein sequences
The T2J µ2 protein shares 80–81% homology with those
of both T1L and T3D (Table 2, Fig. 2). Consistent with the
M1 nucleotide sequence results, this makes T2J µ2 the
most divergent of all nonfusogenic mammalian orthoreo-
virus proteins examined to date, with the exception of the
S1-encoded σ1 and σ1s proteins, which show less than
55% amino acid sequence homology between serotypes
[35,36]; reviewed in [11]. In contrast, the homology
between T1L and T3D µ2 approaches 99%, among the
highest values seen to date between reovirus genome seg-
ments from distinct isolates [11,31,34,37-39]. Also
consistent with the M1 nucleotide sequence results, the µ2
proteins of the nine other reovirus isolates examined in
this study are much more closely related to those of T1L
and T3D than to that of T2J (Table 2, Fig. 3), affirming the
divergent status of the T2J µ2 protein. The µ2 protein
sequence of T3C12 is identical to that of the T3D clone in
use in the Coombs and Nibert laboratories. In addition,
the µ2 protein sequence of T1C29 is identical to that of
T3C44. These are the first times that reovirus proteins
from distinct isolates have been found to share identical
amino acid sequences [11,32,34,37-39], reflecting the
high degree of µ2 conservation.
The encoded µ2 proteins of the twelve reovirus isolates are
all calculated to have molecular masses between 83.2 and
84.0 kDa, and isoelectric points between 6.89 and 7.44
pH units (Table 1). This range of isoelectric points is the
largest yet seen among reovirus proteins other than σ1s
Table 2: Pairwise comparisons of M1 genome segment and µ2 protein sequences from different reovirus isolates
Identity (%) compared with reovirus isolate
a
Virus
isolate
T1L
b
T1L
c
T2J T3D
d
T3D
e
T1C11 T1C29 T1N84 T2N84 T2S59 T3C12 T3C18 T3C44 T3N83
T1L
b
99.9
f
80.8 98.6 98.8 99.2 98.0 98.4 98.8 96.3 98.8 99.0 98.0 98.2
T1L
c
99.9
f
81.0 98.8 98.9 99.3 98.1 98.5 98.9 96.2 98.9 99.2 98.1 98.4
T2J 71.6 71.6 80.0 80.2 80.4 80.3 80.2 80.4 81.5 80.2 80.3 80.3 80.4
T3D
d
97.8 97.9 70.9 99.6 98.6 97.4 97.8 98.2 95.5 99.6 98.5 97.4 98.0
T3D
e
97.9 98.0 71.0 99.7 98.8 97.6 98.0 98.4 95.7 100 98.6 97.6 98.1
T1C11 98.7 98.7 71.3 97.1 97.1 98.0 98.4 98.8 96.1 98.8 99.6 98.0 98.8
T1C29 96.3 96.4 71.1 95.8 95.8 95.5 97.3 97.8 95.7 97.6 97.8 100 97.0
T1N84 96.3 96.3 70.8 95.7 95.8 95.9 94.5 98.5 95.7 98.0 98.2 97.3 97.4
T2N84 97.1 97.1 71.0 96.5 96.6 96.7 95.4 96.5 96.2 98.4 98.6 97.8 97.8
T2S59 89.8 89.9 71.3 89.2 89.3 89.2 89.4 89.1 89.7 95.7 95.9 95.7 95.1
T3C12 97.8 97.9 71.0 99.7 99.9+ 97.2 95.7 95.7 96.6 89.3 98.6 97.6 98.1
T3C18 98.8 98.9 71.2 97.3 97.4 99.4 95.8 95.8 96.8 89.4 97.4 97.8 98.6
T3C44 96.5 96.6 71.1 95.9 95.9 95.7 99.7 94.6 95.5 89.4 95.9 96.0 97.0
T3N83 97.7 97.8 71.4 96.4 96.4 98.6 94.7 94.9 95.8 88.5 96.4 98.4 95.0
a
Abbreviations defined in text.
b
T1L M1 and µ2 sequences for the Brown laboratory clone [31]; GenBank accession no. X59945).
c
T1L M1 and µ2 sequences for the Nibert laboratory clone [23]; GenBank accession no. AF461682) and the Coombs laboratory clone (this study).
d
T3D M1 and µ2 sequences for the Joklik laboratory clone [30]; GenBank accession no. M27261), and the Cashdollar laboratory clone [23];
GenBank accession no. AF461684).
e
T3D M1 and µ2 sequences for the Nibert laboratory clone [23]; GenBank accession no. AF461683) and the Coombs laboratory clone (this study).
f
Values for M1-gene sequence comparisons are shown below the diagonal, in bold; values for µ2-protein sequence comparisons are shown above
the diagonal.
Virology Journal 2004, 1:6 />Page 7 of 17
(page number not for citation purposes)
[11], but is largely attributable to the divergent value of
T2J µ2 (others range only from 6.89 to 7.10). The substan-
tially higher isoelectric point of T2J µ2 is explained by it
containing a larger number of basic residues (excess
arginine) than do the other isolates (Table 1).
Comparisons of the twelve µ2 sequences showed eight
highly conserved regions, each containing ≥ 15 consecu-
tive residues that are identical in all of the isolates (Fig. 2).
The highly conserved regions are clustered in two larger
areas of µ2, spanning approximately amino acids 1–250
and amino acids 400–610. Conserved region 5 in the
400–610 area encompasses the more amino-terminal of
the two NTP-binding motifs in µ2 (Fig. 2) [18,20]. The
other NTP-binding motif is also wholly conserved, but
within a smaller consecutive run of conserved residues.
The region between the two motifs is notably variable
(Fig. 2). Conserved region 5 also contains the less conserv-
ative of the two amino acid substitutions in T1L-derived
temperature-sensitive (ts) mutant tsH11.2 (Pro414→His)
[40]. The pattern of conserved and variable areas of µ2
was also seen by plotting scores for sequence identity in
running windows over the protein length (e.g., [32]). In
addition to the conserved regions described above, areas
of greater than average variation are evident in this plot,
spanning approximately amino acids 250–400 and 610–
736 (the carboxyl terminus) (Fig. 4). The 250–400 area is
notable for regularly oscillating between conserved and
variable regions (Fig. 4). The two large areas of greater-
than-average sequence conservation, spanning approxi-
mately amino acids 1–250 and 400–610 (Fig. 4), are
likely to be involved in the protein's primary function(s).
The more variable, 250–400 area between the two con-
served ones might represent a hinge or linker of mostly
structural importance.
As indicated earlier, µ2 is one of the most poorly under-
stood reovirus proteins, from both a functional and a
structural point of view. For example, atomic structures
are available for seven of the eight reovirus structural pro-
teins, with µ2 being the missing one. Thus, in an effort to
refine the model for µ2 structure/function relationships
based on regional differences, we obtained predictions for
secondary structures, hydropathy, and surface probability.
PHD PredictProtein algorithms suggest that µ2 can be
divided into four approximate regions characterized by
different patterns of predicted secondary structures (Fig.
5C). An amino-terminal region spans to residue 157, a
"variable" region spans residues 157 to 450, a "helix-rich"
region spans residues 450 to 606, and a carboxyl-terminal
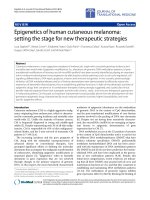
Most parsimonious phylogenetic tree based on the M1 nucle-otide sequences of the different reovirusesFigure 3
Most parsimonious phylogenetic tree based on the M1 nucle-
otide sequences of the different reoviruses. Sequences for
T1L and T3D clones from different laboratories are shown
(laboratory source(s) in parentheses). Horizontal lines are
proportional in length to nucleotide substitutions.
T1L(Brown)
T1L(Coombs/Nibert)
T1C11
T3N83
T3C18
T3D(Joklik/Cashdolla
r)
T3D(Coombs/Nibert)
T3C12
T1N84
T2N84
T1C29
T3C44
T2S59
T2J
100 nucleotide differences
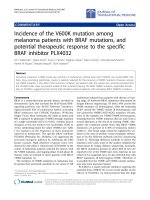
Window-averaged scores for sequence identity among the T1L, T2J, and T3D µ2 proteinsFigure 4
Window-averaged scores for sequence identity among the
T1L, T2J, and T3D µ2 proteins. Identity scores averaged over
running windows of 21 amino acids and centered at consecu-
tive amino acid positions are shown. The global identity
score for the three sequences is indicated by the dashed line.
Two extended areas of greater-than-average sequence varia-
tion are marked with lines below the plot. Two extended
areas of greater-than-average sequence conservation are
marked with lines above the plot. Eight regions of ≥ 15 con-
secutive residues of identity among all twelve µ2 sequences
from Fig. 2, as discussed in the text, are numbered above the
plot. The Ser/Pro208 determinant of microtubule binding is
marked with a filled diamond. The two putative NTP-binding
motifs are marked with filled circles.
Sequence Identity
1.0
0.8
0.4
0.6
0.0
0.2
100 2000 300 400 500 600 700
Amino Acid Position
123 4 5 6 7 8
• •
♦
NVHC
Virology Journal 2004, 1:6 />Page 8 of 17
(page number not for citation purposes)
region spans the sequences after residue 606. The amino-
terminal region contains six predicted α-helices and three
predicted β-strands, and is highly conserved across all
twelve µ2 sequences. The "variable" region is the most
structurally complex and contains numerous interspersed
α-helices and β-strands. The "helix-rich" region contains
seven α-helices and is highly conserved across all twelve
µ2 sequences. The carboxyl-terminal region varies across
all three serotypes. Overall, the µ2 protein is predicted to
be 48% α-helical and 14% β-sheet in composition, mak-
ing it an "α-β " protein according to the CATH designation
[41]. Interestingly, most tyrosine protein kinases with SH
2
domains are also "α-β " proteins by this designation. The
T1L and T3D µ2 hydropathy profiles were identical to
each other. Both show numerous regions of similarity to
the hydropathy profile of the T2J µ2. However, there also
are several distinct differences between the T1L and T2J
profiles (Fig. 5). Alterations in amino acid charge at resi-
dues 32, 430 to 432, and 673 in the T2J sequence account
for the major differences in hydrophobicity between T2J
and the other serotypes. In addition, the carboxyl-termi-
nal 66 residues show multiple differences in hydropathy.
The surface probability profiles of each of the three sero-
type's µ2 proteins are identical (Fig. 5) and show numer-
ous regions that are highly predicted to be exposed at the
surface of the protein as well as regions predicted to be
buried.
The MOTIF and FingerPRINTScan programs were used to
compare the highly conserved regions of µ2 with other
sequences in protein data banks (ProSite, Blocks, and Pro-
Domain). The results revealed that several of the con-
served regions in µ2 share limited similarities with
members of the DNA polymerase A family and with the
SH
2
domain of tyrosine kinases. The sequence YEAgDV in
µ2, located in conserved region 2 (Fig. 2), is similar to the
"YAD" motif of DNA polymerase A from a number of dif-
ferent bacteria (e.g., YEADDV in Deinococcus radiodurans).
The YAD motif is located in the exonuclease region of
DNA polymerase A, a region which also functions as an
NTPase and enhances the rate of DNA polymerization
[42]. The SH
2
domain of tyrosine kinases was the highest
score hit for the conserved regions of µ2 with Finger-
PRINTScan. Four of the five motifs in the 100 amino acid
SH
2
domain matched the µ2 sequence. The SH
2
domain
mediates protein-protein interactions through its capacity
to bind phosphotyrosine [43]. The protein motifs found
by focusing on the conserved regions of µ2 provide sup-
portive evidence that this protein is involved in nucleotide
binding and metabolism. However, the described similar-
ities did not match with greater than 90% certainty and no
other significant homologies were detected. The inability
to identify higher-scoring GenBank similarities, first
noted when sequences of the T3D and T1L M1 genes were
reported [30,31] attests to the uniqueness of this minor
core protein.
Biochemical confirmations
In an effort to provide biochemical confirmation of the
predicted variation in the different isolates' µ2 proteins,
we analyzed the T1L, T2J, and T3D proteins by sodium
dodecyl sulfate-polyacrylamide gel electrophoresis (SDS-
PAGE) and immunoblotting. Despite the slightly larger
molecular mass calculated from its sequence (Table 1),
T2J µ2 displayed a slightly smaller relative molecular
weight on gels than T1L and T3D µ2 (Fig. 6A). This aber-
rant mobility may reflect the higher isoelectric point of
T2J µ2 (Table 1). Polyclonal anti-µ2 antibodies that had
been raised against purified T1L µ2 [44] reacted strongly
with both T1L and T3D µ2, but only weakly with T2J µ2
(Fig. 6B), despite equal band loading as demonstrated by
Ponceau S staining. These antibody cross-reactivities cor-
related well with the predicted protein homologies (Table
2).
Factory morphologies among reovirus field isolates
We took advantage of the new M1/µ2 sequences to extend
analysis of the role of µ2 in determining differences in
viral factory morphology among reovirus isolates [23].
Sequence variation at µ2 residue Pro/Ser208 was previ-
ously indicated to determine the different morphologies
of T1L and T3D factories: Pro208 is associated with micro-
tubule-anchored filamentous factories, as in T1L and the
Cashdollar laboratory clone of T3D, whereas Ser208 is
associated with globular factories, as in the Nibert labora-
tory clone of T3D [23]. For the previous study we had
already examined the factories of T2J and some of the nine
other isolates used for M1 sequencing above. We
nonetheless newly examined the factories of all ten iso-
lates in the present study, using the same stocks used for
sequencing. T3C12 was the only one of these isolates that
formed globular factories; the remainder, including T2J,
formed filamentous factories (Fig. 7, Table 4). This
finding is consistent with the fact that T3C12 is the only
one of these isolates that has a serine at µ2 residue 208,
like T3D from the Nibert laboratory; the remainder, like
T1L and T3D from the Cashdollar laboratory, have a pro-
line there (Fig. 2, Table 4) [23]. Thus, although the results
identify no additional µ2 residues that may influence fac-
tory morphology, they are consistent with the identifica-
tion of Pro/Ser208 as a prevalent determinant of
differences in this phenotype among reovirus isolates.
Factory morphologies and M1/
µ
2 sequences of other T3D
and T3D-derived clones
T3D clones from the Nibert and Cashdollar laboratories
have been shown to exhibit different factory morpholo-
gies based on differences in the microtubule-binding
capacities of their µ2 proteins and the presence of either
Virology Journal 2004, 1:6 />Page 9 of 17
(page number not for citation purposes)
Secondary structure predictions of µ2 proteinFigure 5
Secondary structure predictions of µ2 protein. (A) Hydropathicity index predictions of T2J (- - -) and T1L ( ) µ2 proteins,
superimposed to accentuate similarities and differences. Hydropathy values were determined by the Kyte-Doolittle method
[72], using DNA Strider 1.2, a window length of 11, and a stringency of 7. (B) Surface probability predictions of the T2J µ2 pro-
tein, determined as per Emini et al. [73], using DNASTAR. The predicted surface probability profiles of T1L and T3D (not
shown) were identical to T2J. (C) Locations of α-helices and β-sheets were determined by the PHD PredictProtein algorithms
[74], and results were graphically rendered with Microsoft PowerPoint software. , α-helix;. , β-sheet;—, turn. Differences
in fill pattern correspond to arbitrary division of protein into four regions; N, amino terminal; V, variable; H, helix-rich; C, car-
boxyl terminal. The locations of variable regions are indicated by the thick lines under the domain representation.
100 200 300 400 500 600 700
3 3
2
2
1
1
0
0
-1
-1
-2
-2
-3
-3
H
y
d
r
o
p
h
o
b
i
c
i
t
y
S
c
o
r
e
A
T1L
T2J
T3D
N V
H
C
1 157 450 606 736
C
6
1
Surface
Regions
6
1
100 200 300 400 500 600 700
B
Surface
Probability
-
¨
Virology Journal 2004, 1:6 />Page 10 of 17
(page number not for citation purposes)
serine or proline at µ2 residue 208 [23]. We took the
opportunity in this study to examine additional T3D
clones. The clones from some laboratories formed
globular factories in infected cells whereas those from
other laboratories or the American Type Culture
Collection formed filamentous factories (Fig. 8, Table 5).
T3D-derived ts mutants tsC447, tsE320, and tsG453 [45]
formed filamentous factories (Fig. 8, Table 5). Other ts
mutants were not examined; however, [46] have shown
evidence that tsF556 [45] forms filamentous factories as
well.
We additionally determined the M1 sequences of the
wild-type and ts T3D clones newly tested for factory mor-
phology. All clones with globular factories have a serine at
µ2 position 208 whereas all those with filamentous facto-
ries have a proline there (Table 5). These findings provide
further evidence for the influence of residue 208 on this
phenotypic difference.
All wild-type T3D clones with globular factories were
recently derived from a Fields laboratory parent whereas
all wild-type or ts T3D clones with filamentous factories
were derived from parents in other laboratories.
(Although extensively characterized by both Fields (e.g.,
[47,48]) and Joklik (e.g., [49,50]), the original T3D-
derived ts mutants in groups A through G were generated
in the Joklik laboratory [45]). This correlation suggests
that formation of filamentous factories is the ancestral
phenotype of reovirus T3D and that the Ser208 mutation
in T3D µ2 was established later, in the Fields laboratory.
As we noted in a previous study [23], several other labora-
tories reported evidence for filamentous T3D factories in
the 1960's (e.g., [51,52]), following its isolation in 1955
[53]. Since microtubules were noted to be commonly
associated with T3D factories in Fields laboratory publica-
tions from as late as 1973 [54], but not in one from 1979
[55], the µ2 Ser208 mutation was probably established in,
or introduced into, that laboratory during the middle
1970's. Investigators should be alert to these different lin-
eages of T3D and their derivatives for genetic studies. For
example, reassortant 3HA1 [56] contains a T3D M1
genome segment derived from clone tsC447, and its fac-
tory phenotype is filamentous (data not shown).
Additional genome-wide comparisons of T1L, T2J, and
T3D
Several types of genome-wide comparisons of T1L, T2J,
and T3D have been reported previously [11]. For this
study we examined the positions and types of nucleotide
mismatches in these prototype isolates in order to gain a
more comprehensive view of the evolutionary divergence
of their protein-coding sequences. Most mismatches
between T2J and either T1L or T3D segments, ~68%, are
in the third codon base position, while ~21% are in the
first position and ~11% are in the second position. Each
of these mismatch percentages was converted to an evolu-
tionary divergence value by multiplying mismatch
percentage by 1.33 [31] (Table 3). These values have been
used to argue that the homologous T1L and T3D genome
segments diverged from common ancestors at different
times in the past, with the M1 and L3 segments having
diverged most recently and the M2, S1, S2, and S3 seg-
ments having diverged longer ago [31]. The consistently
high values for divergence at third codon base positions
among pairings with T2J genome segments (Table 3) indi-
cate that all ten T2J segments diverged from common
ancestors substantially before their respective T1L and
T3D homologs. Relative numbers of synonymous and
nonsynonymous nucleotide changes identified in pair-
wise comparisons of the coding sequences of these iso-
lates (Table 3) support the same conclusion.
The types of amino acid substitutions within each of the
prototype isolates' proteins were also examined. Pairwise
analyses showed that most substitutions in most proteins
were conservative (Table 3). Nonconservative substitu-
tions were relatively rare in most proteins' pair-wise com-
SDS-PAGE and immunoblot analyses of virion and core particlesFigure 6
SDS-PAGE and immunoblot analyses of virion and core parti-
cles. Proteins from gradient-purified T1L (1), T2J (2), and
T3D (3) particles were resolved in 5–15% SDS-polyacryla-
mide gels as detailed in Materials and methods. Gels were
then fixed and stained with Coomassie Brilliant Blue R-250
and silver (A). Alternatively, proteins from the gels were
transferred to nitrocellulose, probed with anti-µ2 antiserum
(polyclonal antibodies raised against T1L µ2, kindly provided
by E. G. Brown), and detected by chemiluminescence (B).
Virion proteins are indicated to the left of panel A, except
for µ2, which is indicated between the panels.
123 1 2 3
123
µ2
µ2µ2
µ2
λ
λλ
λ
µ1
µ1µ1
µ1
µ1
µ1µ1
µ1C
σ1
σ1σ1
σ1
σ2
σ2σ2
σ2
σ3
σ3σ3
σ3
Virus Cores
A
B
Virology Journal 2004, 1:6 />Page 11 of 17
(page number not for citation purposes)
parisons. For example, comparison of the T1L and T3D µ2
proteins showed none (0.0%) of the 10 amino acid sub-
stitutions were nonconservative, and most T1L:T3D com-
parisons gave low nonconservative substitution values
ranging from 0.1–0.5% of total amino acid residues
within the respective proteins. However, some genes,
most notably M1, M3, and S3, demonstrated higher non-
conservative variation, with values approaching 3.5% of
Viral factory morphology as demonstrated by the distribution of µNS in cells infected with various reovirus isolatesFigure 7
Viral factory morphology as demonstrated by the distribution of µNS in cells infected with various reovirus isolates. CV-1 cells
were infected at 5 PFU/cell with the isolate indicated above each panel, fixed at 18 h p.i., and immunostained with µNS-specific
rabbit IgG conjugated to Alexa 594. Size bars, 10 µm.
T1L T1C11 T1C29
T2J T2N84 T2S59
T3C12 T3C18 T3C44
Virology Journal 2004, 1:6 />Page 12 of 17
(page number not for citation purposes)
total amino acid residues. Most of these higher noncon-
servative substitution values were observed when T2J pro-
teins were compared to either T1L or T3D proteins. In
addition, in many proteins, the majority of nonconserva-
tive substitutions were located within the amino-terminal
portions (first ~20%) of the respective proteins (data not
shown).
The frequencies with which different redundant codons
are used to encode certain mammalian amino acids are
non-random (reviewed in [57]). This phenomenon is
mirrored by different abundances of the complementary
tRNA molecules in mammalian cells. For example, CG
pairs are underrepresented in mammalian genomes and
common in their "rare" codons (see Table 6). A recent
study revealed that many RNA viruses of humans display
mild deviations from host codon-usage frequencies and
that these deviations are more prominent among viruses
with segmented genomes [57]. However, reoviruses were
not included in that study. By examining reovirus isolates
T1L, T2J, and T3D, for which whole-genome sequences
are now available, we found that codons that qualify as
rare in mammals are not rare in reovirus (Table 6). More-
over, the few codons that qualify as rare in reovirus (ACC,
AGC, CCC, CGG, CUC, and GCC; data not shown) are
common in mammals. The basis and significance of these
deviations remain unknown, but could have impacts on
the rates of translation of reovirus proteins. It is perhaps
notable in this regard that the four most highly expressed
reovirus proteins (µ1, σ3, µNS, and σNS) have the lowest
average frequencies of codons that are rare in mammals
(Table 6). Thus, incorporation of rare codons into reovi-
rus coding sequences could be a mechanism of dampen-
ing the expression of certain viral proteins.
Table 3: Pairwise comparisons of variation at different codon positions in reovirus genome segments
Variation (%) in the long open reading frame of genome segment
Codon position Isolate pair L1 L2 L3 M1 M2 M3 S2 S3 S4
first
a
T1L:T2J 16.9 19.9 12.2 24.6 11.1 25.3 13.7 25.5 13.1
T2J:T3D 16.7 20.4 12.7 26.1 10.7 25.0 14.0 25.5 13.9
T1L:T3D 2.4 15.4 1.4 1.5 6.0 7.6 6.1 6.6 4.0
second
a
T1L:T2J 5.3 8.0 3.3 11.8 1.7 10.0 4.1 8.4 5.1
T2J:T3D 5.1 7.5 3.2 11.8 1.7 9.6 4.1 8.0 5.5
T1L:T3D 0.8 3.5 0.3 0.4 2.1 2.0 0.0 2.2 1.1
third
a
T1L:T2J 77.1 83.7 79.4 80.1 81.5 81.2 74.0 79.1 73.8
T2J:T3D 76.7 77.4 79.1 81.0 82.7 83.0 73.0 73.9 76.7
T1L:T3D 12.9 76.1 7.5 6.5 53.3 39.2 53.6 48.1 21.9
syn.
b
T1L:T2J 88.3 90.2 89.6 85.8 90.0 87.1 83.8 90.2 81.9
T2J:T3D 87.5 84.2 89.3 87.0 89.3 89.8 83.6 85.4 84.2
T1L:T3D 15.0 85.9 8.8 7.9 59.3 46.4 63.1 58.2 25.8
nonsyn.
b
T1L:T2J 5.9 9.1 3.8 12.6 2.6 11.8 4.8 10.2 6.2
T2J:T3D 5.9 8.9 3.9 13.1 3.2 11.5 4.7 9.6 6.8
T1L:T3D 0.8 5.0 0.3 0.5 1.2 2.0 0.7 1.3 1.3
cons.
c
T1L:T2J 60.0 66.3 57.1 63.8 50.0 60.6 50.0 60.8 73.5
5.0 8.7 2.5 12.2 1.3 10.7 2.9 8.5 6.8
T2J:T3D 62.7 64.5 56.1 64.6 65.2 60.5 52.0 60.8 71.1
5.1 8.6 2.5 12.9 2.1 10.0 3.1 8.5 7.4
T1L:T3D 36.4 77.4 88.9 80.0 50.0 62.5 100 40.0 63.6
0.65.60.61.1 1.12.8 1.21.01.9
noncon.
c
T1L:T2J 18.1 10.7 17.9 17.0 11.1 18.9 20.8 17.6 14.7
1.51.40.83.3 0.33.3 1.22.51.4
T2J:T3D 18.6 9.9 19.3 16.3 13.0 16.8 20.0 15.7 21.1
1.51.30.93.3 0.42.8 1.22.22.2
T1L:T3D 18.2 8.6 11.1 0.0 12.5 3.1 0.0 20.0 27.3
0.30.60.10.0 0.30.1 0.00.50.8
S1 not included because of uncertainty in where to place gaps.
a
Values determined for each pairwise comparison as: # base changes / total such positions × 100.
b
Values determined as # of observed changes/ # of positions at which changes could have occurred × 100.
c
Upper value indicates proportion of all amino acid substitutions that are conservative or nonconservative (using CLUSTAL W analysis with
BLOSUM weighting); semi-conservative substitutions not included. Lower bold value indicates proportion of indicated types of alterations as a
percentage of total number of amino acids within whole protein.
Virology Journal 2004, 1:6 />Page 13 of 17
(page number not for citation purposes)
Methods
Cells and viruses
Reoviruses T1L, T2J, T3D, and T3C12 were Coombs and/
or Nibert laboratory stocks. Other reovirus isolates were
provided by Dr. T. S. Dermody (Vanderbilt University).
Virus clones were amplified to the second passage in
murine L929 cell monolayers in Joklik's modified mini-
mal essential medium (Gibco) supplemented to contain
2.5% fetal calf serum (Intergen), 2.5% neonatal bovine
serum (Biocell), 2 mM glutamine, 100 U/ml penicillin,
100 µg/ml streptomycin, and 1 µg/ml amphotericin B,
and large amounts of virus were grown in spinner culture,
extracted with Freon (DuPont) or Vertrel-XF (DuPont),
and purified in CsCl gradients, all as previously described
[19,58].
Sequencing the M1 genome segments
All oligonucleotide primers were obtained from Gibco/
BRL. Genomic dsRNA was extracted from gradient-puri-
fied virions with phenol/chloroform [59]. Strain identity
was confirmed by resolving aliquots of each in 10% SDS-
PAGE gels and comparing dsRNA band mobilities [60].
Oligonucleotide primers corresponding to either the 5'
end of the plus strand or the 5' end of the minus strand
were as previously described [40]. Additional oligonucle-
otides for sequencing were designed and obtained as
needed. cDNA copies of the M1 genes of each virus were
constructed by using the 5' oligonucleotide primers and
reverse transcriptase (Gibco/BRL). The cDNAs were
amplified by the polymerase chain reaction [61] and
resolved in 0.7% agarose gels [59]. The bands correspond-
ing to the 2.3-kb gene were then excised, purified, and
eluted with Qiagen columns, using the manufacterer's
instructions. Sequences of the respective cDNAs were
determined in both directions by dideoxynucleotide cycle
sequencing [62-64], using fluorescent
dideoxynucleotides.
Sequences at the termini of each M1 segment were deter-
mined by one or both of two methods. For some isolates,
sequences near the ends of the segment were determined
by modified procedures for rapid amplification of cDNA
ends (RACE) as previously described [32,65]. In addition,
the sequences at the ends of all M1 segments were deter-
mined in both directions by a modification of the 3'-liga-
tion method described by Lambden et al. [66]. Briefly,
viral genes from gradient-purified virions were resolved in
a 1% agarose gel, and the M segments were excised and
eluted with Qiagen columns as described above.
Oligonucleotide 3'L1 (5'-CCCCAACCCACTTTTTCCAT-
TACGCCCCTTTCCCCC-3'; phosphorylated at the 5' end
and blocked with a biotin group at the 3' end) was ligated
to the 3' ends of the M segments according to the manu-
facterer's directions (Boehringer Mannheim) at 37°C
overnight. The ligated genes were repurified by agarose gel
and Qiagen columns to remove unincorporated 3'L1 oli-
gonucleotide and precipitated overnight with ice-cold eth-
anol. The precipitated genes were dissolved in 4 µl of 90%
dimethyl sulfoxide. cDNA copies of the ligated M1 genes
were constructed by using oligonucleotide 3'L2 (5'-
GGGGGAAAGGGGCGTAATGGAAAAAGTGGGTT-
GGGG-3') and gene-specific internal oligonucleotide
primers designed to generate a product of 0.5 to 1.2 kb in
length. These constructs were amplified by PCR, purified
Table 4: Properties of different reovirus isolates
Virus isolate
a
Virus factory morphology
b
Amino acid at µ2 position 208
T1L filamentous
c
Pro
c
T2J filamentous
d
Pro
T3D
e
filamentous
c
Pro
c
T3D
f
globular
c
Ser
c
T1C11 filamentous Pro
T1C29 filamentous Pro
T1N84 filamentous
d
Pro
T2N84 filamentous
d
Pro
T2S59 filamentous
d
Pro
T3C12 globular
d
Ser
T3C18 filamentous
d
Pro
T3C44 filamentous Pro
T3N83 filamentous
d
Pro
a
Abbreviations defined in the text.
b
Determined by immunofluorescence microscopy as described in the text.
c
Reported in Parker et al. [23].
d
Reported in supplementary data of Parker et al. [23].
e
T3D clone from the Cashdollar laboratory.
f
T3D clone from the Nibert laboratory.
Virology Journal 2004, 1:6 />Page 14 of 17
(page number not for citation purposes)
in 1.5% agarose gels, excised, and eluted as described
above. Sequences of these cDNAs were determined with
gene-specific internal oligonucleotides and with
oligonucleotide 3'L3 (5'-GGGGGAAAGGGGCGTAAT-3')
by dideoxy-fluorescence methods.
Sequence analyses
DNA sequences were analyzed with DNASTAR, DNA
Strider, BLITZ, BLAST, and CLUSTAL-W. Phylogenetic
analyses were performed using the PHYLIP programs
/>. DNA-
PARS (parsimony) (Fig. 3) and DNAML (maximum like-
lihood) (data not shown) produced essentially identical
trees. These programs were run using the Jumble option to
test the trees using 50 different, randomly generated
orders of adding the different sequences. In addition,
DNAPENNY (parsimony by brand-and-bound algorithm)
generated a tree with the same branch orders as DNAPARS
and DNAML. RETREE and DRAWGRAM were used to vis-
ualize the tree and to prepare the image for publication.
Final refinement of the image was performed with
Illustrator. Synonymous and nonsynonymous substitu-
tion frequencies were calculated according to the methods
of Nei and Gojobori [67] as applied by Dr. B. Korber at
/>.
Codon frequencies in the M1 coding sequences were
determined using the COUNTCODON program main-
tained at />don.html. Values for codon frequencies in mammalian
genomes were obtained from the Codon Usage Database
maintained at />Protein sequence analyses were performed using the GCG
programs in SeqWeb version 2 (Accelrys). Multiple
sequence alignments were done with PRETTY. Determina-
tions of molecular weights, isoelectric points, and residue
counts were done with PEPTIDESORT. Determinations of
percent identities in pairwise comparisons were done with
GAP. Plots of sequence identity over running windows of
different numbers of amino acids (Fig. 4 and data not
shown) were generated with PLOTSIMILARITY, and the
image for publication was refined with Illustrator (Adobe
Systems). In addition, protein sequences were analysed
for conservative and nonconservative substitutions by
pairwise CLUSTAL-W analyses, using BLOSUM matrix
weighting [68].
SDS-PAGE
Gradient-purified virus and core samples were dissolved
in electrophoresis sample buffer (0.24 M Tris [pH 6.8],
1.5% dithiothreitol, 1% SDS), heated to 95°C for 3–5
min, and resolved in a 5–15% SDS-PAGE gradient gel
(16.0 × 12.0 × 0.1 cm) [69] at 5 mA for 18 h. Some sets of
resolved proteins were fixed, and stained with Coomassie
Brilliant Blue R-250 and/or silver [70].
Immunoblotting
Gradient-purified viral and core proteins were resolved by
SDS-PAGE as described above, and sets of resolved pro-
teins were transferred to nitrocellulose membranes with a
Semi-Dry Transblot manifold (Bio-Rad Laboratories)
according to the manufacturer's instructions. Transfer of
all proteins was confirmed by Ponceau S staining. Non-
specific binding was blocked in TBS-T (10 mM Tris [pH
7.5], 100 mM NaCl, 0.1% Tween 20) supplemented with
5% milk proteins, and the membranes probed with poly-
valent anti-µ2 antibody (a kind gift from Dr. E. G. Brown,
University of Ottawa). Membranes were washed with TBS-
Viral factory morphology as demonstrated by the distribu-tion of µNS in cells infected with T3D clones obtained from different laboratories or with T3D-derived ts clonesFigure 8
Viral factory morphology as demonstrated by the distribu-
tion of µNS in cells infected with T3D clones obtained from
different laboratories or with T3D-derived ts clones. Labora-
tory sources are indicated in parentheses. CV-1 cells were
infected at 5 PFU/cell with the clone indicated above each
panel, fixed at 18 h p.i., and immunostained with µNS-specific
rabbit IgG conjugated to Alexa 488. Size bars, 10 µm.
T3D(Coombs) T3D(Tyler)
T3D(Duncan) T3D(Shatkin)
tsC447 tsE320
Virology Journal 2004, 1:6 />Page 15 of 17
(page number not for citation purposes)
T, reacted with horseradish peroxidase-conjugated goat
anti-rabbit IgG (Jackson ImmunoResearch Laboratories),
and immune complexes detected with the enhanced
chemiluminescence system (Amersham Life Sciences)
according to the manufacturer's instructions.
Infections and IF microscopy
CV-1 cells were maintained in Dulbecco's modified Eagles
medium (Invitrogen) containing 10% fetal bovine serum
(HyClone Laboratories) and 10 µg/ml Gentamycin solu-
tion (Invitrogen). Rabbit polyclonal IgG against µNS [71]
was purified with protein A and conjugated to Alexa Fluor
488 or Alexa Fluor 594 using a kit obtained from Molecu-
lar Probes and titrated to optimize the signal-to-noise
ratio. Cells were seeded the day before infection at a den-
sity of 1.5 × 10
4
/cm
2
in 6-well plates (9.6 cm
2
/well) con-
taining round glass cover slips (18 mm). Cells on cover
slips were inoculated with 5 PFU/cell in phosphate-buff-
ered saline (PBS) (137 mM NaCl, 3 mM KCl, 8 mM
Na
2
HPO
4
[pH 7.5]) containing 2 mM MgCl
2
. Virus was
Table 5: Properties of different T3D and T3D-derived clones
Positions of variation in T3D µ2
Virus isolate Laboratory source Virus factory
morphology
150 208 224 372
T3D Nibert
a
globular
b
Gln Ser
b
Glu Ile
T3D Coombs
a
globular Gln Ser Glu Ile
T3D Schiff
a
globular Gln Ser Glu Ile
T3D Tyler
a
globular Gln Ser Glu Ile
T3D Cashdollar
c
filamentous
b
Arg Pro
b
Glu Met
T3D Duncan
c
filamentous Arg Pro Glu Met
T3D Shatkin filamentous Gln Pro Ala Ile
T3D ATCC filamentous Gln Pro Glu Ile
tsC447 Coombs
c
filamentous Gln Pro Glu Ile
tsE320 Coombs
c
filamentous Gln Pro Glu Ile
tsG453 Coombs
c
filamentous Gln Pro Glu Ile
a
Origin traceable to B. N. Fields laboratory.
b
Reported in Parker et al. [23].
c
Origin traceable to W. K. Joklik laboratory; derived from T3D; sequences of tsC447 (GenBank accession no. AY428878), tsE320, and tsG453 are
identical.
Table 6: Codon-usage frequencies in reovirus for eight codons that are rare in mammals
Frequencies of selected codons in coding sequences of:
a
Mammalian genomes Reovirus genomes Individual reovirus genome segments (major protein encoded by each)
Codon AA
b
Exp
c
Mus Bos Homo T1L T2J T3D L1 (λ3) L2 (λ2) L3 (λ1) M1 (µ2) M2 (µ1) M3
(µNS)
S1 (σ1) S2 (σ2) S3 (σNS) S4 (σ3)
ACG Thr 0.25 0.11 0.13 0.11 0.23 0.30 0.24 0.17 0.28 0.22 0.27 0.17 0.16 0.30 0.38 0.26 0.20
CCG Pro 0.25
0.11 0.12 0.11 0.17 0.20 0.17 0.12 0.20 0.15 0.27 0.20 0.14 0.18 0.25 0.07 0.11
CGU Arg 0.17 0.09 0.08 0.08 0.20
0.22 0.24 0.22 0.19 0.14 0.25 0.19 0.31 0.12 0.16 0.21 0.29
CUA Leu 0.17 0.08 0.09 0.08 0.15 0.13 0.14 0.18 0.13 0.14 0.19 0.09 0.18 0.16 0.09 0.05 0.16
GCG Ala 0.25
0.10 0.11 0.11 0.24 0.26 0.26 0.29 0.22 0.30 0.31 0.15 0.16 0.25 0.30 0.10 0.29
GUA Val 0.25 0.12 0.11 0.12 0.18 0.17 0.15 0.20 0.23 0.12 0.15 0.23 0.14 0.23 0.17 0.14 0.23
UCG Ser 0.17
0.05 0.06 0.06 0.14 0.17 0.14 0.13 0.14 0.18 0.16 0.11 0.03 0.13 0.18 0.20 0.16
UUA Leu 0.17 0.06 0.07 0.07 0.20 0.18 0.20 0.32 0.20 0.16 0.23 0.14 0.07 0.18 0.32 0.13 0.16
mean - 0.21 0.09 0.10 0.09 0.19 0.20 0.19 0.22 0.20 0.19 0.21 0.18 0.16 0.21 0.22 0.16 0.18
a
As fraction of all codons for the particular amino acid. Bold, value higher than that in any of the indicated mammals; underlined, value more than
double that in any of the indicated mammals.
b
Amino acid encoded by the codon
c
Expected frequency if codons for each amino acid are used randomly (assuming equal A, C, G, and U contents and no di- or trinucleotide bias).
Virology Journal 2004, 1:6 />Page 16 of 17
(page number not for citation purposes)
adsorbed for 1 h at room temperature before fresh
medium was added. Cells were further incubated for 18–
24 h at 37°C before fixation for 10 min at room tempera-
ture in 2% paraformaldehyde in PBS or 3 min at -20°C in
ice-cold methanol. Fixed cells were washed with PBS three
times and permeabilized and blocked in PBS containing
1% bovine serum albumin and 0.1% Triton X-100.
Antibody was diluted in the blocking solution and incu-
bated with cells for 25–40 min at room temperature. After
three washes in PBS, cover slips were mounted on glass
slides with Prolong (Molecular Probes). Samples were
examined using a Nikon TE-300 inverted microscope
equipped with phase and fluorescence optics, and images
were collected digitally as described elsewhere [23]. All
images were processed and prepared for presentation
using Photoshop (Adobe Systems).
Authors' Contributions
PY and NDK participated equally in designing primers
and determining the T2J M1 sequence; TJB, MMA, and
JSLP determined the M1 sequences of the T3C12 clone
and other labs' T3D clones, as well as factory morpholo-
gies of all clones; and all authors participated in writing
the manuscript. MLN and KMC are the principal investi-
gators and KMC determined the M1 sequences of the
other field isolates and ts mutants.
Acknowledgments
We thank T. S. Dermody for suggesting and providing virus isolates used in
this work, J. N. Simonsen for helpful comments, and members of their lab-
oratories for critical reviews of the manuscript. We also thank S. Taylor of
the Canadian Science Centre for Human and Animal Health Core DNA
Sequencing Facility, the University of Calgary Core DNA Sequencing Facil-
ity, and the University of Manitoba Department of Medical Microbiology
Core DNA Sequencing Facility.
This research was supported by grants MT-11630 and GSP-48371 from the
Canadian Institutes of Health Research (to K. M. C.), NIH grant R01 AI-
47904 (to M. L. N.), a junior faculty research grant from the Giovanni
Armenise-Harvard Foundation (to M. L. N.), and NIH grant K08 AI52209
(to J. S. L. P.). N. D. K. was the recipient of a Natural Sciences and Engineer-
ing Research Council Post-Graduate Scholarship from the Government of
Canada and T. J. B. received additional support from NIH grant T32
AI07061 to the Infectious Disease Training Program at Harvard Medical
School.
References
1. Murray CJL, Lopez AD: In The Global Burden of Disease. A comprehen-
sive assessment of mortality and disability from diseases, injuries, and risk
factors in 1990 and projected to 2020 Boston: Harvard School of Public
Health; 1996:990.
2. The World Health Report: Fighting Disease, Fostering Development
Geneva: World Health Organization; 1996.
3. Hansen AK, Thomsen P, Jensen HJ: A serological indication of the
existence of a guineapig poliovirus. Lab Anim 1997, 31:212-218.
4. Lesburg CA, Cable MB, Ferrari E, Hong Z, Mannarino AF, Weber PC:
Crystal structure of the RNA-dependent RNA polymerase
from hepatitis C virus reveals a fully encircled active site. Nat
Struct Biol 1999, 6:937-943.
5. Ng KKS, Cherney MM, Vazquez AL, Machin A, Alonso JMM, Parra F,
et al.: Crystal Structures of Active and Inactive Conforma-
tions of a Caliciviral RNA-dependent RNA Polymerase. Jour-
nal of Biological Chemistry 2002, 277:1381-1387.
6. Tao Y, Farsetta DL, Nibert ML, Harrison SC: RNA Synthesis in a
Cage-Structural Studies of Reovirus Polymerase lambda3.
Cell 2002, 111:733-745.
7. Estes MK: Rotaviruses and their replication. In Fields Virology
Edited by: Knipe DM, Howley PM. Philadelphia: Lippencott Williams
& Wilkins; 2001:1747-1785.
8. Nibert ML, Schiff LA: Reoviruses and their replication. In Fields
Virology Edited by: Knipe DM, Howley PM. Philadelphia: Lippencott
Williams & Wilkins; 2001:1679-1728.
9. Roy P: Orbiviruses. In Fields Virology Edited by: Knipe DM, Howley
PM. Philadelphia: Lippencott Williams & Wilkins; 2001:1835-1869.
10. Wiener JR, Joklik WK: The sequences of the reovirus serotype
1, 2, and 3 L1 genome segments and analysis of the mode of
divergence of the reovirus serotypes. Virology 1989,
169:194-203.
11. Breun LA, Broering TJ, McCutcheon AM, Harrison SJ, Luongo CL,
Nibert ML: Mammalian reovirus L2 gene and lambda2 core
spike protein sequences and whole-genome comparisons of
reoviruses type 1 Lang, type 2 Jones, and type 3 Dearing. Virol-
ogy 2001, 287:333-348.
12. Drayna D, Fields BN: Activation and characterization of the
reovirus transcriptase: genetic analysis. J Virol 1982,
41:110-118.
13. Morozov SY: A possible relationship of reovirus putative RNA
polymerase to polymerases of positive-strand RNA viruses.
Nucleic Acids Res 1989, 17:5394.
14. Starnes MC, Joklik WK: Reovirus protein lambda 3 is a poly(C)-
dependent poly(G) polymerase. Virology 1993, 193:356-366.
15. Coombs KM: Stoichiometry of reovirus structural proteins in
virus, ISVP, and core particles. Virology 1998, 243:218-228.
16. Dryden KA, Farsetta DL, Wang G, Keegan JM, Fields BN, Baker TS,
et al.: Internal/Structures Containing Transcriptase-Related
Proteins in Top Component Particles of Mammalian
Orthoreovirus*1. Virology 1998, 245:33-46.
17. Zhang X, Walker SB, Chipman PR, Nibert ML, Baker TS: Reovirus
polymerase lambda 3 localized by cryo-electron microscopy
of virions at a resolution of 7.6 angstrom. Nature Structural
Biology 2003, 10:1011-1018.
18. Kim J, Parker JSL, Murray KE, Nibert ML: Nucleoside and RNA
Triphosphatase Activities of Orthoreovirus Transcriptase
Cofactor {micro}2. Journal of Biological Chemistry 2004,
279:4394-4403.
19. Yin P, Cheang M, Coombs KM: The M1 gene is associated with
differences in the temperature optimum of the transcriptase
activity in reovirus core particles. J Virol 1996, 70:1223-1227.
20. Noble S, Nibert ML: Core protein mu2 is a second determinant
of nucleoside triphosphatase activities by reovirus cores. J
Virol 1997, 71:7728-7735.
21. Brentano L, Noah DL, Brown EG, Sherry B: The reovirus protein
mu2, encoded by the M1 gene, is an RNA-binding protein. J
Virol 1998, 72:8354-8357.
22. Mbisa JL, Becker MM, Zou S, Dermody TS, Brown EG: Reovirus
mu2 protein determines strain-specific differences in the
rate of viral inclusion formation in L929 cells. Virology 2000,
272:16-26.
23. Parker JSL, Broering TJ, Kim J, Higgins DE, Nibert ML: Reovirus core
protein mu 2 determines the filamentous morphology of
viral inclusion bodies by interacting with and stabilizing
microtubules. Journal of Virology 2002, 76:4483-4496.
24. Moody MD, Joklik WK: The function of reovirus proteins during
the reovirus multiplication cycle: analysis using
monoreassortants. Virology 1989, 173:437-446.
25. Sherry B, Fields BN: The reovirus M1 gene, encoding a viral
core protein, is associated with the myocarditic phenotype
of a reovirus variant. J Virol 1989, 63:4850-4856.
26. Matoba Y, Sherry B, Fields BN, Smith TW: Identification of the
viral genes responsible for growth of strains of reovirus in
cultured mouse heart cells. J Clin Invest 1991, 87:1628-1633.
27. Matoba Y, Colucci WS, Fields BN, Smith TW: The reovirus M1
gene determines the relative capacity of growth of reovirus
in cultured bovine aortic endothelial cells. J Clin Invest 1993,
92:2883-2888.
28. Haller BL, Barkon ML, Vogler GP, Virgin HW: Genetic mapping of
reovirus virulence and organ tropism in severe combined
Virology Journal 2004, 1:6 />Page 17 of 17
(page number not for citation purposes)
immunodeficient mice: organ-specific virulence genes. J Virol
1995, 69:357-364.
29. Sherry B, Torres J, Blum MA: Reovirus induction of and sensitiv-
ity to beta interferon in cardiac myocyte cultures correlate
with induction of myocarditis and are determined by viral
core proteins. J Virol 1998, 72:1314-1323.
30. Wiener JR, Bartlett JA, Joklik WK: The sequences of reovirus
serotype 3 genome segments M1 and M3 encoding the
minor protein mu 2 and the major nonstructural protein mu
NS, respectively. Virology 1989, 169:293-304.
31. Zou S, Brown EG: Nucleotide sequence comparison of the M1
genome segment of reovirus type 1 Lang and type 3 Dearing.
Virus Res 1992, 22:159-164.
32. Harrison SJ, Farsetta DL, Kim J, Noble S, Broering TJ, Nibert ML:
Mammalian reovirus L3 gene sequences and evidence for a
distinct amino-terminal region of the lambda1 protein. Virol-
ogy 1999, 258:54-64.
33. Hrdy DB, Rosen L, Fields BN: Polymorphism of the migration of
double-stranded RNA genome segments of reovirus isolates
from humans, cattle, and mice. J Virol 1979, 31:104-111.
34. Goral MI, Mochow-Grundy M, Dermody TS: Sequence diversity
within the reovirus S3 gene: reoviruses evolve independently
of host species, geographic locale, and date of isolation. Virol-
ogy 1996, 216:265-271.
35. Duncan R, Horne D, Cashdollar LW, Joklik WK, Lee PW: Identifi-
cation of conserved domains in the cell attachment proteins
of the three serotypes of reovirus. Virology 1990, 174:399-409.
36. Nibert ML, Dermody TS, Fields BN: Structure of the reovirus
cell-attachment protein: a model for the domain organiza-
tion of sigma 1. J Virol 1990, 64:2976-2989.
37. Dermody TS, Nibert ML, Bassel-Duby R, Fields BN: Sequence
diversity in S1 genes and S1 translation products of 11 sero-
type 3 reovirus strains. J Virol 1990, 64:4842-4850.
38. Chappell JD, Goral MI, Rodgers SE, dePamphilis CW, Dermody TS:
Sequence diversity within the reovirus S2 gene: reovirus
genes reassort in nature, and their termini are predicted to
form a panhandle motif. J Virol 1994, 68:750-756.
39. Kedl R, Schmechel S, Schiff L: Comparative sequence analysis of
the reovirus S4 genes from 13 serotype 1 and serotype 3 field
isolates. J Virol 1995, 69:552-559.
40. Coombs KM: Identification and characterization of a double-
stranded RNA-reovirus temperature-sensitive mutant
defective in minor core protein mu2. J Virol 1996, 70:4237-4245.
41. Martin AC, Orengo CA, Hutchinson EG, Jones S, Karmirantzou M,
Laskowski RA, et al.: Protein folds and functions. Structure 1998,
6:875-884.
42. Gutman PD, Fuchs P, Ouyang L, Minton KW: Identification,
sequencing, and targetted mutagenesis of a DNA polymer-
ase gene required for the extreme radioresistance of Deino-
coccus radiodurans. J Bacteriol 1993, 175:3581-3590.
43. Okamura H, Resh MD: Differential binding of pp60c-src and
pp60v-src to cytoskeleton is mediated by SH2 and catalytic
domains. Oncogene 1994, 9:2293-2303.
44. Zou S, Brown EG: Stable expression of the reovirus mu2 pro-
tein in mouse L cells complements the growth of a reovirus
ts mutant with a defect in its M1 gene. Virology 1996, 217:42-48.
45. Fields BN, Joklik WK: Isolation and preliminary genetic and bio-
chemical characterization of temperature-sensitive mutants
of reovirus. Virology 1969, 37:335-342.
46. Mora M, Partin K, Bhatia M, Partin J, Carter C: Association of reo-
virus proteins with the structural matrix of infected cells.
Virology 1987, 159:265-277.
47. Fields BN: Temperature-sensitive mutants of reovirus type 3:
Features of genetic recombination. Virology 1971, 46:142-148.
48. Ramig RF, Mustoe TA, Sharpe AH, Fields BN: A genetic map of
reovirus. II. Assignment of the double-stranded RNA-nega-
tive mutant groups C, D, and E to genome segments. Virology
1978, 85:531-534.
49. Ito Y, Joklik WK: Temperature-sensitive mutants of reovirus.
I. Patterns of gene expression by mutants of groups C, D,
and E. Virology 1972, 50:189-201.
50. Schuerch AR, Joklik WK: Temperature-sensitive mutants of
reovirus. IV. Evidence that anomalous electrophoretic
migration behavior of certain double-stranded RNA hybrid
species is mutant group-specific. Virology 1973, 56:218-229.
51. Dales S: Association between the spindle apparatus and
reovirus. Proc Natl Acad Sci U S A 1963, 50:268-275.
52. Spendlove RS, Lennette EH, John AC: The role of the mitotic
apparatus in the intracellular location of reovirus antigen. J
Immunol 1963, 90:554-560.
53. Sabin AB: Reoviruses. Science 1959, 130:1387-1389.
54. Raine CS, Fields BN: Reovirus type 3 encephalitis – a virologic
and ultrastructural study. J Neuropathol Exp Neurol 1973,
32:19-33.
55. Babiss LE, Luftig RB, Weatherbee JA, Weihing RR, Ray UR, Fields BN:
Reovirus serotypes 1 and 3 differ in their in vitro association
with microtubules. J Virol 1979, 30:863-874.
56. Weiner HL, Powers ML, Fields BN: Absolute linkage of virulence
and central nervous system cell tropism of reoviruses to viral
hemagglutinin. J Infect Dis 1980, 141:609-616.
57. Jenkins GM, Holmes EC: The extent of codon usage bias in
human RNA viruses and its evolutionary origin. Virus Res 2003,
92:1-7.
58. Mendez II, Hermann LL, Hazelton PR, Coombs KM: A comparative
analysis of freon substitutes in the purification of reovirus
and calicivirus. J Virol Methods 2000, 90:59-67.
59. Sambrook J, Fritsch EF, Maniatis T: Molecular cloning: a laboratory man-
ual 2nd edition. Cold Spring Harbor: Cold Spring Harbor Laboratory;
1989.
60. Nibert ML, Margraf RL, Coombs KM: Nonrandom segregation of
parental alleles in reovirus reassortants. J Virol 1996,
70:7295-7300.
61. Saiki RK, Scharf S, Faloona F, Mullis KB, Horn GT, Erlich HA, et al.:
Enzymatic amplification of α-globin genomic sequences and
restriction site analysis for diagnosis of sickle cell anemia. Sci-
ence 1985, 230:1350-1354.
62. Sanger F, Nicklen S, Coulson AR: DNA sequencing with chain-
terminating inhibitors. Proc Natl Acad Sci U S A 1977,
74:5463-5467.
63. Murray V: Improved double-stranded DNA sequencing using
the linear polymerase chain reaction. Nucleic Acids Res 1989,
17:8889.
64. Craxton M: Linear amplification sequencing, a powerful
method for sequencing DNA. Methods: Compan Meth Enzymol
1991, 3:20-26.
65. Frohman MA, Dush MK, Martin GR: Rapid production of full-
length cDNAs from rare transcripts: Amplification using a
single gene-specific oligonucleotide primer. Proc Natl Acad Sci U
S A 1988, 85:8998-9002.
66. Lambden PR, Cooke SJ, Caul EO, Clarke IN: Cloning of nonculti-
vable human rotavirus by single primer amplification. J Virol
1992, 66:1817-1822.
67. Nei M, Gojobori T: Simple methods for estimating the num-
bers of synonomous and nonsynonomous nucleotide
substitutions. Mol Biol Evol 1986, 3:418-426.
68. Thompson JD, Higgins DG, Gibson TJ: CLUSTAL W: Improving
the sensitivity of progressive multiple sequence alignment
through sequence weighting, position-specific gap penalties
and weight matrix choice. Nucleic Acids Res 1994, 22:4673-4680.
69. Laemmli UK: Cleavage of structural proteins during the
assembly of the head of bacteriophage T4. Nature 1970,
227:680-685.
70. Merril CR, Goldman D, Sedman SA, Ebert MH: Ultrasensitive stain
for protein in polyacrylamide gels shows regional variation in
cerebrospinal fluid proteins. Science 1981, 211:1437-1438.
71. Broering TJ, Parker JS, Joyce PL, Kim J, Nibert ML: Mammalian reo-
virus nonstructural protein µNS forms large inclusions and
colocalizes with reovirus microtubule-associated protein µ2
in transfected cells. J Virol 2002, 76:8285-8297.
72. Kyte J, Doolittle RF: A simple method for displaying the hydro-
pathic character of a protein. J Mol Biol 1982, 157:105-132.
73. Emini EA, Hughs JV, Perlow DS, Boger J: Induction of hepatitis A
virus-neutralizing antibody by a virus-specific synthetic
peptide. J Virol 1985, 55:836-9.
74. Rost B: Predicting one-dimensional protein structure by use
of sequence profiles and neural networks. Methods Enzymol
1996, 266:525-539.