Properties and Applications of Silicon Carbide Part 17 ppt
Bạn đang xem bản rút gọn của tài liệu. Xem và tải ngay bản đầy đủ của tài liệu tại đây (3.17 MB, 30 trang )
Properties and Applications of Silicon Carbide472
determining the w
t
. Nevertheless, there have been very limited reports on studying the
influence of α in the presence of variation in v for AWJ milling applications. For machining
(milling, turning and drilling) of different materials, such as stainless steel 304, Ti-6-4 and
ceramics, an improved depth of cut (h(α)), MRR and surface finish are observed with the
change in jet impingement angle (Wang, 2003; Hashish, 1993). However, there are very
limited studies that have considered the influence of α on top width of JFP. Although some
empirical models exist for prediction of geometrical characteristics of the JFP, they cannot
readily be adoptable for AWJ milling as are developed for cutting applications; most of the
models in the literature have assumed the top width of kerf is equal to the d
f
, which is not
true in practice due to the divergence of jet plume (Srinivasu et al., 2009).
From the literature review, it is inferred that the key enabling element for generation of
complex geometries in AEMs using AWJ technology is a unified understanding of the
influence of the interaction of jet at different feed rates and impingement angles on the JFP
generated. Furthermore, there is a need to develop models for prediction of the geometry of
the JFP and its dimensional characteristics, such as top width of kerf in 2-axis/5-axis
macro/micro milling. In order to address the above issues, in this chapter, the research work
done at the University of Nottingham under the NIMRC sponsored research project titled
“Freeform Abrasive WaterJet Machining in Advanced Engineering Materials (Freeform_JET)”,
under the following headings was presented: (i) comprehensive investigation on the
physical phenomenon involved in the formation of JFP, (ii) development of models for (a)
prediction of geometry, and (b) top width, of the JFP.
2. Experimentation and methodology
In order to understand the physical phenomenon involved in generation of the geometry of
the JFP at various jet impingement angles and jet feed rates, and to generate the data
required to develop models for prediction of JFP geometry and top width, experimental
trials were conducted and the complete details are as follows: Milling trials were conducted
on 5-axis AWJ (Ormond) cutting system with a streamline SL-V100D ultra-high pressure
pump capable of providing a maximum pressure of 413.7 MPa at various mass flow rates (0-
1 kg/min) while the jet feed rate can be varied in the range of 0-20,000 mm/min. Garnet (80
mesh size, average Ф180μm - GMA Garnet) abrasive media with sub-angular particle
shapes was employed throughout the experimentation to mill SiC ceramic plate
(100mmX100mmX10mm). The hardness of the SiC was evaluated as 2500VH. Figure 1a
shows a photograph of the experimental setup employed in this study. The structure of the
SiC consists of two different regions: α-SiC and β-SiC displaying two different wear
characteristics; as α-SiC was reported to have increased strength than β-SiC phase and lower
fracture toughness (Lee & Rainforth, 1992), it is expected that the first one will be easier to
be removed under AWJ impingement. The two constituents of the SiC ceramic have been
revealed by fine diamond polishing (# 6µm/5min followed #1µm/5 min) followed by
etching with ‘Murakami’ (aqueous solution of NaoH and K
3
[Fe(CN
6
]) solution for 10
minutes. Figure 1b explains the notations used in describing the characteristics of the AWJ
process and its erosion outcomes (i.e. kerf shape/dimensions).
As the kerf characteristics are influenced by various operating parameters such as P, d
f
, m
f
,
α, v, SOD and properties of workpiece material, careful consideration has been taken in
selecting their values in relation to material of study. Since, SiC is a hard material, a high P
of 345 MPa was employed. Furthermore, to maintain the optimum ratio of focusing nozzle
diameter to orifice diameter of 3-4 for optimum performance (Chalmers, 1991), a d
f
of 1.06
mm and d
o
of 0.3 mm were employed. Garnet abrasive of 80 mesh size with an m
f
of 0.7
kg/min was employed (Hashish, 1989). SOD of 3 mm was employed as it has been
demonstrated that the MRR is insensitive to SOD within the range of 2-5 mm and decreases
beyond 5 mm (Hashish, 1987; Laurinat et al., 1993; Ojmertz, 1997). The above operating
parameters were kept constant throughout the experimental program. In order to study the
influence of v and α on the JFP and its characteristics, the following experimental plan was
followed.
Examination of the influence of jet feed rate on jet footprint generation: To understand the
influence of jet feed rate on JFP generation, experiments were conducted by varying
the v in the range of 100-1700 mm/min in steps of 400 mm/min.
Examination of the influence of jet impingement angle on jet footprint generation: To
understand the influence of jet impingement angle on JFP generation, experiments
were conducted by varying α in the range of 40
0
-90
0
in steps of 10
0
. Further, to study
the influence of α on kerf geometry at different jet feed rates, cutting trials were
performed at different jet impingement angles for smaller (v = 100 mm/min) and
higher (v = 900 mm/min) levels of feed rate.
Examination of the influence of number of passes on jet footprint generation: To understand
the influence of number of passes on erosion depth, the contribution of preceding jet
pass on the increase in SOD (SOD
actual
: SOD
n+1
= SOD
n
+ h
n
) and shape of kerf geometry
were analyzed. For this purpose, different kerfs were generated by single and double jet
passes at v = 900 mm/min and α = 90
0
at nominal SOD (i.e. 3 mm) and their variation in
geometries/characteristics were discussed. Additionally, trials for compensating the
increase in SOD at a second jet pass were performed as follows: 1
st
pass with SOD =
3mm and 2
nd
pass with a corrected SOD (SOD
corrected
= SOD-h) have been carried out;
where, ‘h’ represents the erosion depth in single jet pass.
Investigations on Jet Footprint Geometry and its Characteristics
for Complex Shape Machining with Abrasive Waterjets in Silicon Carbide Ceramic Material 473
determining the w
t
. Nevertheless, there have been very limited reports on studying the
influence of α in the presence of variation in v for AWJ milling applications. For machining
(milling, turning and drilling) of different materials, such as stainless steel 304, Ti-6-4 and
ceramics, an improved depth of cut (h(α)), MRR and surface finish are observed with the
change in jet impingement angle (Wang, 2003; Hashish, 1993). However, there are very
limited studies that have considered the influence of α on top width of JFP. Although some
empirical models exist for prediction of geometrical characteristics of the JFP, they cannot
readily be adoptable for AWJ milling as are developed for cutting applications; most of the
models in the literature have assumed the top width of kerf is equal to the d
f
, which is not
true in practice due to the divergence of jet plume (Srinivasu et al., 2009).
From the literature review, it is inferred that the key enabling element for generation of
complex geometries in AEMs using AWJ technology is a unified understanding of the
influence of the interaction of jet at different feed rates and impingement angles on the JFP
generated. Furthermore, there is a need to develop models for prediction of the geometry of
the JFP and its dimensional characteristics, such as top width of kerf in 2-axis/5-axis
macro/micro milling. In order to address the above issues, in this chapter, the research work
done at the University of Nottingham under the NIMRC sponsored research project titled
“Freeform Abrasive WaterJet Machining in Advanced Engineering Materials (Freeform_JET)”,
under the following headings was presented: (i) comprehensive investigation on the
physical phenomenon involved in the formation of JFP, (ii) development of models for (a)
prediction of geometry, and (b) top width, of the JFP.
2. Experimentation and methodology
In order to understand the physical phenomenon involved in generation of the geometry of
the JFP at various jet impingement angles and jet feed rates, and to generate the data
required to develop models for prediction of JFP geometry and top width, experimental
trials were conducted and the complete details are as follows: Milling trials were conducted
on 5-axis AWJ (Ormond) cutting system with a streamline SL-V100D ultra-high pressure
pump capable of providing a maximum pressure of 413.7 MPa at various mass flow rates (0-
1 kg/min) while the jet feed rate can be varied in the range of 0-20,000 mm/min. Garnet (80
mesh size, average Ф180μm - GMA Garnet) abrasive media with sub-angular particle
shapes was employed throughout the experimentation to mill SiC ceramic plate
(100mmX100mmX10mm). The hardness of the SiC was evaluated as 2500VH. Figure 1a
shows a photograph of the experimental setup employed in this study. The structure of the
SiC consists of two different regions: α-SiC and β-SiC displaying two different wear
characteristics; as α-SiC was reported to have increased strength than β-SiC phase and lower
fracture toughness (Lee & Rainforth, 1992), it is expected that the first one will be easier to
be removed under AWJ impingement. The two constituents of the SiC ceramic have been
revealed by fine diamond polishing (# 6µm/5min followed #1µm/5 min) followed by
etching with ‘Murakami’ (aqueous solution of NaoH and K
3
[Fe(CN
6
]) solution for 10
minutes. Figure 1b explains the notations used in describing the characteristics of the AWJ
process and its erosion outcomes (i.e. kerf shape/dimensions).
As the kerf characteristics are influenced by various operating parameters such as P, d
f
, m
f
,
α, v, SOD and properties of workpiece material, careful consideration has been taken in
selecting their values in relation to material of study. Since, SiC is a hard material, a high P
of 345 MPa was employed. Furthermore, to maintain the optimum ratio of focusing nozzle
diameter to orifice diameter of 3-4 for optimum performance (Chalmers, 1991), a d
f
of 1.06
mm and d
o
of 0.3 mm were employed. Garnet abrasive of 80 mesh size with an m
f
of 0.7
kg/min was employed (Hashish, 1989). SOD of 3 mm was employed as it has been
demonstrated that the MRR is insensitive to SOD within the range of 2-5 mm and decreases
beyond 5 mm (Hashish, 1987; Laurinat et al., 1993; Ojmertz, 1997). The above operating
parameters were kept constant throughout the experimental program. In order to study the
influence of v and α on the JFP and its characteristics, the following experimental plan was
followed.
Examination of the influence of jet feed rate on jet footprint generation: To understand the
influence of jet feed rate on JFP generation, experiments were conducted by varying
the v in the range of 100-1700 mm/min in steps of 400 mm/min.
Examination of the influence of jet impingement angle on jet footprint generation: To
understand the influence of jet impingement angle on JFP generation, experiments
were conducted by varying α in the range of 40
0
-90
0
in steps of 10
0
. Further, to study
the influence of α on kerf geometry at different jet feed rates, cutting trials were
performed at different jet impingement angles for smaller (v = 100 mm/min) and
higher (v = 900 mm/min) levels of feed rate.
Examination of the influence of number of passes on jet footprint generation: To understand
the influence of number of passes on erosion depth, the contribution of preceding jet
pass on the increase in SOD (SOD
actual
: SOD
n+1
= SOD
n
+ h
n
) and shape of kerf geometry
were analyzed. For this purpose, different kerfs were generated by single and double jet
passes at v = 900 mm/min and α = 90
0
at nominal SOD (i.e. 3 mm) and their variation in
geometries/characteristics were discussed. Additionally, trials for compensating the
increase in SOD at a second jet pass were performed as follows: 1
st
pass with SOD =
3mm and 2
nd
pass with a corrected SOD (SOD
corrected
= SOD-h) have been carried out;
where, ‘h’ represents the erosion depth in single jet pass.
Properties and Applications of Silicon Carbide474
(a)
X
Z
Z�
O
Y
X
O
w
t
h
SOD
l
t
b
A
B
AB - Jet footprint
C
C
v
Trailing edge
Forward edge
-
SiC
-
SiC
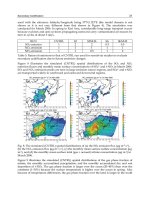
Fig. 1. (a) Photograph of the experimental setup employed for AWJ machining of SiC
ceramic material, (b) Schematic illustration of nomenclature in kerf generation
A summary of the testing program is presented in Table 1. To study the influence of jet
impingement angle and jet feed rate on the kerf generation in AWJ machining, the cut
surfaces were analysed in two stages (i) geometry of the kerf generated at different jet
impingement angles; and (ii) dimensional characteristics of the kerf, such as erosion depth,
kerf width, slope of the kerf trailing wall. To enable these investigations, sections across the
kerfs have been cut, followed by diamond polishing (# 60µm grit / 10min and 15µm grit /
15min.) to ensure their flatness and to allow accurate measurement of geometry of JFP and
its geometrical measurements, such as top width, depth, slope of walls using fibre optic
digital microscope (Keyence-VHX) and profilometer. Once the jet footprints were generated
they have been 3D scanned (Fig. 4) using a Talysurf CLI 1000 from which the ten kerf
profiles were extracted at equal spaced intervals (along jet feed direction) to allow the
evaluation of the averaged profiles and their variability at various experimental conditions.
The average profiles have then been fed into the geometrical models (developed in
MATLAB codes) for their calibration and validation.
Constant operating parameters
d
f
(mm) 1.06 P (MPa) 345 d
o
(mm) 0.3
m
f
(kg/min) 0.7 (Garnet, 80 mesh) SOD (mm) 3.0
Variable operating parameters
S. No. Objective Operating parameters
I
Influence of v on top with of
jet footprint
v (mm/min) 100, 500, 900, 1300, 1700
α (deg) 90
II
Influence of α on top width of
jet footprint
v (mm/min) 100, 900
α (deg) 50, 60, 70, 80 , 90
Table 1. Overview of experimental plan to study the influence of jet impingement angle and
jet feed rate on top width of the jet footprint on SiC material
3 Analysis and modelling of abrasive waterjet footprint
3.1 Physical phenomenon involved in the formation of jet footprint
(Srinivasu et al., 2009)
Understanding the influence of jet footprint at various impingement angles can be done by
analyzing the 2D cross-sectional view of the kerf in the plane of the focusing nozzle/jet tilt.
Hence, in the following sections, the variation in 2D geometry of the kerf by considering the
key kinematic operating parameters (α and v) is discussed with the help of schematic
illustrations and the experimental results on kerf geometry and dimensional characteristics,
such as erosion depth, top kerf width and slope of kerf walls.
Investigations on Jet Footprint Geometry and its Characteristics
for Complex Shape Machining with Abrasive Waterjets in Silicon Carbide Ceramic Material 475
(a)
X
Z
Z�
O
Y
X
O
w
t
h
SOD
l
t
b
A
B
AB - Jet footprint
C
C
v
Trailing edge
Forward edge
-
SiC
-
SiC
Fig. 1. (a) Photograph of the experimental setup employed for AWJ machining of SiC
ceramic material, (b) Schematic illustration of nomenclature in kerf generation
A summary of the testing program is presented in Table 1. To study the influence of jet
impingement angle and jet feed rate on the kerf generation in AWJ machining, the cut
surfaces were analysed in two stages (i) geometry of the kerf generated at different jet
impingement angles; and (ii) dimensional characteristics of the kerf, such as erosion depth,
kerf width, slope of the kerf trailing wall. To enable these investigations, sections across the
kerfs have been cut, followed by diamond polishing (# 60µm grit / 10min and 15µm grit /
15min.) to ensure their flatness and to allow accurate measurement of geometry of JFP and
its geometrical measurements, such as top width, depth, slope of walls using fibre optic
digital microscope (Keyence-VHX) and profilometer. Once the jet footprints were generated
they have been 3D scanned (Fig. 4) using a Talysurf CLI 1000 from which the ten kerf
profiles were extracted at equal spaced intervals (along jet feed direction) to allow the
evaluation of the averaged profiles and their variability at various experimental conditions.
The average profiles have then been fed into the geometrical models (developed in
MATLAB codes) for their calibration and validation.
Constant operating parameters
d
f
(mm) 1.06 P (MPa) 345 d
o
(mm) 0.3
m
f
(kg/min) 0.7 (Garnet, 80 mesh) SOD (mm) 3.0
Variable operating parameters
S. No. Objective Operating parameters
I
Influence of v on top with of
jet footprint
v (mm/min) 100, 500, 900, 1300, 1700
α (deg) 90
II
Influence of α on top width of
jet footprint
v (mm/min) 100, 900
α (deg) 50, 60, 70, 80 , 90
Table 1. Overview of experimental plan to study the influence of jet impingement angle and
jet feed rate on top width of the jet footprint on SiC material
3 Analysis and modelling of abrasive waterjet footprint
3.1 Physical phenomenon involved in the formation of jet footprint
(Srinivasu et al., 2009)
Understanding the influence of jet footprint at various impingement angles can be done by
analyzing the 2D cross-sectional view of the kerf in the plane of the focusing nozzle/jet tilt.
Hence, in the following sections, the variation in 2D geometry of the kerf by considering the
key kinematic operating parameters (α and v) is discussed with the help of schematic
illustrations and the experimental results on kerf geometry and dimensional characteristics,
such as erosion depth, top kerf width and slope of kerf walls.
Properties and Applications of Silicon Carbide476
3.1.1 Influence of kinematic operating parameters (α and v) on kerf geometry
a) Influence of jet impingement angle on kerf geometry
For better understanding of the kerf generation phenomena at different jet impingement
angles, the experimental results are analysed in two distinct situations: (a) normal jet
impingement angle (α = 90
0
) and (b) shallow jet impingement angle (40
0
< α < 90
0
)
(i) Normal jet impingement (α = 90
0
)
Figure 2a presents the photographs of the kerf cross sectional geometry generated at normal
jet impingement angle at various jet feed rates in the range of 100-1700 mm/min while Fig.
2b shows their measured 2D cross-sectional profiles. The geometry of the kerf generated at α
= 90
0
is symmetric about the vertical axis, which coincides with the jet axis, in this case. The
observations are explained with the help of a schematic illustration of jet-material
interaction in kerf generation at normal jet impingement (Fig. 3). The kerf geometry is
dictated by: (i) jet energy across the jet-material interaction site (
AB ); (ii) local impact angles
of abrasive particles (θ) across the JFP. Energy of the jet across the jet footprint varies
depending on the jet impingement angle (α) and the jet plume divergence, which in turn
influences the velocities of water/abrasive particles.
As the exact energy distribution in the jet is not known clearly, uniform (Leber & Junkar,
2003) and Gaussian distributions (Henning & Westkamper, 2003) have been considered by
the researchers. On the other hand, by using flow separation technique (Simpson, 1990) and
Laser Doppler Anemometry (Chen & Siores, 2003) these distributions are experimentally
determined as double slope distribution. Furthermore, it is found that at higher abrasive
flow rates and high water pressures, the abrasive flow increases at the core region and
decreases towards walls of the focusing nozzle (Simpson, 1990). As higher water pressure
and abrasive flow rates were employed in this study, the velocity of water and abrasive
particles were assumed to follow the shape of Gaussian distribution. At any cross-section of
jet plume (perpendicular to jet axis), velocity profile of water follows nearly Gaussian
distribution (Henning & Westkamper, 2003); Yanaida & Ohashi, 1978; Gropetti & Capello,
1992; Kovacevic & Momber, 1995). On the other hand, with the increase in axial distance
from the focusing nozzle, the divergence of jet plume increases which in turn cause decrease
in axial velocity (Fig. 3). As the velocity distribution in the radial direction of the jet footprint
when α = 90
0
is symmetric, the erosion energy which is proportional to the velocity (velocity
exponent) of water/abrasive particles also follows the same profile. This leads to maximum
erosion at centre of jet axis and gradual decrease on either side. At normal jet impingement
angle, due to jet plume divergence (Fig. 3), the local impact angle of abrasive particles (θ)
with the target surface decreases gradually on either side of the jet axis across the JFP. Thus,
the local impact angle varies from θ = 90
0
at centre of jet axis to a critical angle θ
c
(where
there is no significant erosion of target material) on either side of the JFP. Furthermore, for
brittle materials, the maximum erosion is typically observed at normal impact angle (θ =
90
0
) and it reduces gradually with the decreasing in θ (Ruff & Wioderborn, 1979). Hence, the
comprehensive effect of reduction in (i) velocity of water/abrasive particles (ii) impact angle
of abrasive particles, on either side of jet axis contributes to the symmetric nature of the kerf
geometry at α = 90
0
.
0 0.5 1 1.5 2 2.5 3
-2
-1.5
-1
-0.5
0
0.5
Scanning Length (mm)
Depth of penetration (mm)
100 mm/min
500 mm/min
900 mm/min
1300 mm/min
1700 mm/min
(b)
Fig. 2. Kerfs generated at different jet feed rates (α = 900) (a) photograph of cross-section, (b) 2D cross-sectional profile.
�
v�=�100�mm/min� v�=�500�mm/min� v�=�900�mm/min� v�=�1300�mm/min� v�=�1700�mm/min�
(a)�
76
0
61
0
�
52
0
�
42
0
34
0
�
X100
X100
X100
X100
X100
Investigations on Jet Footprint Geometry and its Characteristics
for Complex Shape Machining with Abrasive Waterjets in Silicon Carbide Ceramic Material 477
3.1.1 Influence of kinematic operating parameters (α and v) on kerf geometry
a) Influence of jet impingement angle on kerf geometry
For better understanding of the kerf generation phenomena at different jet impingement
angles, the experimental results are analysed in two distinct situations: (a) normal jet
impingement angle (α = 90
0
) and (b) shallow jet impingement angle (40
0
< α < 90
0
)
(i) Normal jet impingement (α = 90
0
)
Figure 2a presents the photographs of the kerf cross sectional geometry generated at normal
jet impingement angle at various jet feed rates in the range of 100-1700 mm/min while Fig.
2b shows their measured 2D cross-sectional profiles. The geometry of the kerf generated at α
= 90
0
is symmetric about the vertical axis, which coincides with the jet axis, in this case. The
observations are explained with the help of a schematic illustration of jet-material
interaction in kerf generation at normal jet impingement (Fig. 3). The kerf geometry is
dictated by: (i) jet energy across the jet-material interaction site (
AB ); (ii) local impact angles
of abrasive particles (θ) across the JFP. Energy of the jet across the jet footprint varies
depending on the jet impingement angle (α) and the jet plume divergence, which in turn
influences the velocities of water/abrasive particles.
As the exact energy distribution in the jet is not known clearly, uniform (Leber & Junkar,
2003) and Gaussian distributions (Henning & Westkamper, 2003) have been considered by
the researchers. On the other hand, by using flow separation technique (Simpson, 1990) and
Laser Doppler Anemometry (Chen & Siores, 2003) these distributions are experimentally
determined as double slope distribution. Furthermore, it is found that at higher abrasive
flow rates and high water pressures, the abrasive flow increases at the core region and
decreases towards walls of the focusing nozzle (Simpson, 1990). As higher water pressure
and abrasive flow rates were employed in this study, the velocity of water and abrasive
particles were assumed to follow the shape of Gaussian distribution. At any cross-section of
jet plume (perpendicular to jet axis), velocity profile of water follows nearly Gaussian
distribution (Henning & Westkamper, 2003); Yanaida & Ohashi, 1978; Gropetti & Capello,
1992; Kovacevic & Momber, 1995). On the other hand, with the increase in axial distance
from the focusing nozzle, the divergence of jet plume increases which in turn cause decrease
in axial velocity (Fig. 3). As the velocity distribution in the radial direction of the jet footprint
when α = 90
0
is symmetric, the erosion energy which is proportional to the velocity (velocity
exponent) of water/abrasive particles also follows the same profile. This leads to maximum
erosion at centre of jet axis and gradual decrease on either side. At normal jet impingement
angle, due to jet plume divergence (Fig. 3), the local impact angle of abrasive particles (θ)
with the target surface decreases gradually on either side of the jet axis across the JFP. Thus,
the local impact angle varies from θ = 90
0
at centre of jet axis to a critical angle θ
c
(where
there is no significant erosion of target material) on either side of the JFP. Furthermore, for
brittle materials, the maximum erosion is typically observed at normal impact angle (θ =
90
0
) and it reduces gradually with the decreasing in θ (Ruff & Wioderborn, 1979). Hence, the
comprehensive effect of reduction in (i) velocity of water/abrasive particles (ii) impact angle
of abrasive particles, on either side of jet axis contributes to the symmetric nature of the kerf
geometry at α = 90
0
.
0 0.5 1 1.5 2 2.5 3
-2
-1.5
-1
-0.5
0
0.5
Scanning Length (mm)
Depth of penetration (mm)
100 mm/min
500 mm/min
900 mm/min
1300 mm/min
1700 mm/min
(b)
Fig. 2. Kerfs generated at different jet feed rates (α = 900) (a) photograph of cross-section, (b) 2D cross-sectional profile.
�
v�=�100�mm/min� v�=�500�mm/min� v�=�900�mm/min� v�=�1300�mm/min� v�=�1700�mm/min�
(a)�
76
0
61
0
�
52
0
�
42
0
34
0
�
X100
X100
X100
X100
X100
Properties and Applications of Silicon Carbide478
X
Z
O
SOD
t
= 90
0
h
w
t
A
B
A
B
- Jet footprint
Diverged
AWJ plume
d
f
C
l
2
V
2
1
V
1
1
>
2
V
1
> V
2
Fig. 3. Schematic illustration of kerf generation at normal jet impingement angle (α = 90
0
)
(ii) Shallow angle jet impingement (40
0
< α < 90
0
)
Figure 4 presents the photographs of kerf cross-sections generated at the different jet
impingement angles, i.e. 90
0
-40
0
, in steps of 10
0
at both lower v = 100 mm/min (Fig. 4a (ii)) and
higher v = 900 mm/min (Fig. 4a (iii)). From Fig. 4, it can be observed that at α = 90
0
, the kerf
geometry is symmetric about the vertical axis (which is the same as the jet axis) as discussed
earlier (Fig. 3). However, as the jet impingement angle decreases, the kerf geometry becomes
asymmetric. This is explained as follows by the use of Figures 5 and 6 that show the schematic
illustration of kerf generation at shallow jet impingement angles. The top view of the kerf
gradually transforms from circular (at α = 90
0
) to elliptical (at 0
0
< α < 90
0
) whereas the side
cross-sectional view moves towards the right deviating from the symmetry (Fig. 4(i), Fig. 5).
Furthermore, along the jet footprint (
AB
), the erosion depth decreases at a slow rate from
‘C’ to ‘B’ and at a fast rate from ‘C’ to ‘A’. These issues can be attributed to: (i) the interaction
of various zones of the jet plume which are at varying axial distances from the tip of
focusing nozzle and radial distances from jet axis, at footprint and (ii) variation in ‘effective’
impact angle of abrasive particles at jet footprint.
With the decrease in jet impingement angle, the width of footprint increases
(
'B''A'B'A'AB in Fig. 5) in the direction of XO due to jet plume divergence. However, as
α varies in the XZ plane, the increase in the width of JFP in the direction of the XY plane is
not significant compared to that on the XZ plane. Hence, the top-view of the kerf gradually
transforms from circle (at
α = 90
0
) to an ellipse (at 0
0
< α < 90
0
) with the decrease in α.
Maximum erosion depth,
OC or OC' or 'OC' , is observed along the jet axis, OZ' or 'OZ' or
''OZ' (Fig. 5). This is due to high velocity of water/abrasive particles along the jet axis.
However, the depth decreased rapidly from point ‘C’ to point ‘A’ where the forward edge of
the jet in the XZ plane meets the target surface (Figures. 5 and 6) and decreases slowly from
point ‘C’ to ‘B’ where the trailing edge of the jet meets the target surface and that results in
asymmetric geometry of kerf. This is explained in the following way: in contrast to normal
jet impingement, the footprint on target surface
B'A' or 'B''A' (Fig. 5) at shallow jet
impingement angle occurs at different axial distances (D5 > D4 > D3 > D2 > D1, etc. (Fig. 6)
from the tip of the focusing nozzle. As the distance Di increases, the velocity of jet decreases
due to jet plume divergence that can be explained with decrease in height of Gaussian
profile which in turn causes the decrease in erosive capability of the abrasive particles. The
rapid decrease in depth of penetration across the forward part of the footprint (
OA ) from
‘C’ to ‘A’ can be attributed to the increase in radial distance from jet axis (
OZ' or
'OZ' or ''OZ' ) and the longitudinal distance (D1, D2, D3 D4, D5 etc.), in the direction of the
jet axis, across the jet footprint (
AB ) from the tip of focusing nozzle. In addition to this, the
impact angle of abrasive particles in the direction of footprint
OA decreases due to
shallower α (Fig. 6). Hence, the cumulative negative influence, i.e. increase in radial and
axial distances as well as reduction in impact angle of abrasive particles, results drastic
decreases in the velocity of abrasive particles which in turn cause decrease in erosion depth
at higher rate towards ‘A’. The decreased rate of erosion depth, in the trailing part of the jet
footprint (
OB ), can be attributed to decrease in axial distance along the jet axis (D2 < D1)
and the increase in impact angle of abrasive particles in the direction
OB . The impact angle
of abrasive particles increases gradually in the
OB direction that increases the erosion
capability of the abrasive particles in brittle materials. Further, the axial distance across the
trailing part of the jet footprint (
OB ) from the tip of the focusing nozzle decreases which in
turn increases the erosion capability of the abrasive particles. However, the increase in
radial distance in the direction of
OB due to divergence of jet plume reduces the velocity of
abrasive particles. Moreover, the divergence along the trailing part of jet plume is
geometrically less compared to that in the forward edge of the jet. Hence, the slow rate of
decrease in depth of erosion is due to the comprehensive result of positive effect of increase
in θ, decrease in axial distance and the negative effect of increase in radial distance from jet
axis. The rate of decrease of depth of penetration in forward part and trailing part depends
on
α. This is in contrast to the case of normal jet impingement where, across the footprint,
the distance from the tip of the focusing nozzle is the same (= SOD) which results in
symmetric geometry.
Investigations on Jet Footprint Geometry and its Characteristics
for Complex Shape Machining with Abrasive Waterjets in Silicon Carbide Ceramic Material 479
X
Z
O
SOD
t
= 90
0
h
w
t
A
B
A
B
- Jet footprint
Diverged
AWJ plume
d
f
C
l
2
V
2
1
V
1
1
>
2
V
1
> V
2
Fig. 3. Schematic illustration of kerf generation at normal jet impingement angle (α = 90
0
)
(ii) Shallow angle jet impingement (40
0
< α < 90
0
)
Figure 4 presents the photographs of kerf cross-sections generated at the different jet
impingement angles, i.e. 90
0
-40
0
, in steps of 10
0
at both lower v = 100 mm/min (Fig. 4a (ii)) and
higher v = 900 mm/min (Fig. 4a (iii)). From Fig. 4, it can be observed that at α = 90
0
, the kerf
geometry is symmetric about the vertical axis (which is the same as the jet axis) as discussed
earlier (Fig. 3). However, as the jet impingement angle decreases, the kerf geometry becomes
asymmetric. This is explained as follows by the use of Figures 5 and 6 that show the schematic
illustration of kerf generation at shallow jet impingement angles. The top view of the kerf
gradually transforms from circular (at α = 90
0
) to elliptical (at 0
0
< α < 90
0
) whereas the side
cross-sectional view moves towards the right deviating from the symmetry (Fig. 4(i), Fig. 5).
Furthermore, along the jet footprint (
AB
), the erosion depth decreases at a slow rate from
‘C’ to ‘B’ and at a fast rate from ‘C’ to ‘A’. These issues can be attributed to: (i) the interaction
of various zones of the jet plume which are at varying axial distances from the tip of
focusing nozzle and radial distances from jet axis, at footprint and (ii) variation in ‘effective’
impact angle of abrasive particles at jet footprint.
With the decrease in jet impingement angle, the width of footprint increases
(
'B''A'B'A'AB in Fig. 5) in the direction of XO due to jet plume divergence. However, as
α varies in the XZ plane, the increase in the width of JFP in the direction of the XY plane is
not significant compared to that on the XZ plane. Hence, the top-view of the kerf gradually
transforms from circle (at
α = 90
0
) to an ellipse (at 0
0
< α < 90
0
) with the decrease in α.
Maximum erosion depth,
OC or OC' or 'OC' , is observed along the jet axis, OZ' or 'OZ' or
''OZ' (Fig. 5). This is due to high velocity of water/abrasive particles along the jet axis.
However, the depth decreased rapidly from point ‘C’ to point ‘A’ where the forward edge of
the jet in the XZ plane meets the target surface (Figures. 5 and 6) and decreases slowly from
point ‘C’ to ‘B’ where the trailing edge of the jet meets the target surface and that results in
asymmetric geometry of kerf. This is explained in the following way: in contrast to normal
jet impingement, the footprint on target surface
B'A' or 'B''A' (Fig. 5) at shallow jet
impingement angle occurs at different axial distances (D5 > D4 > D3 > D2 > D1, etc. (Fig. 6)
from the tip of the focusing nozzle. As the distance Di increases, the velocity of jet decreases
due to jet plume divergence that can be explained with decrease in height of Gaussian
profile which in turn causes the decrease in erosive capability of the abrasive particles. The
rapid decrease in depth of penetration across the forward part of the footprint (
OA ) from
‘C’ to ‘A’ can be attributed to the increase in radial distance from jet axis (
OZ' or
'OZ' or ''OZ' ) and the longitudinal distance (D1, D2, D3 D4, D5 etc.), in the direction of the
jet axis, across the jet footprint (
AB ) from the tip of focusing nozzle. In addition to this, the
impact angle of abrasive particles in the direction of footprint
OA decreases due to
shallower α (Fig. 6). Hence, the cumulative negative influence, i.e. increase in radial and
axial distances as well as reduction in impact angle of abrasive particles, results drastic
decreases in the velocity of abrasive particles which in turn cause decrease in erosion depth
at higher rate towards ‘A’. The decreased rate of erosion depth, in the trailing part of the jet
footprint (
OB ), can be attributed to decrease in axial distance along the jet axis (D2 < D1)
and the increase in impact angle of abrasive particles in the direction
OB . The impact angle
of abrasive particles increases gradually in the
OB direction that increases the erosion
capability of the abrasive particles in brittle materials. Further, the axial distance across the
trailing part of the jet footprint (
OB ) from the tip of the focusing nozzle decreases which in
turn increases the erosion capability of the abrasive particles. However, the increase in
radial distance in the direction of
OB due to divergence of jet plume reduces the velocity of
abrasive particles. Moreover, the divergence along the trailing part of jet plume is
geometrically less compared to that in the forward edge of the jet. Hence, the slow rate of
decrease in depth of erosion is due to the comprehensive result of positive effect of increase
in θ, decrease in axial distance and the negative effect of increase in radial distance from jet
axis. The rate of decrease of depth of penetration in forward part and trailing part depends
on
α. This is in contrast to the case of normal jet impingement where, across the footprint,
the distance from the tip of the focusing nozzle is the same (= SOD) which results in
symmetric geometry.
Properties and Applications of Silicon Carbide480
Fig. 4. Photographs of the 3D jet footprints generated at various jet impingement angles (40
0
< α < 90
0
) (i) top view, and 2D cross
sections at (ii)
v = 100 mm/min, (iii) v = 900 mm/min
(i)
= 90
0
= 80
0
= 70
0
= 60
0
= 50
0
= 40
0
(ii) v = 100 mm/min
= 90
0
= 80
0
= 70
0
= 60
0
= 50
0
= 40
0
(iii) v = 900 mm/min
75
0
65
0
57
0
49
0
37
0
27
0
X100
X100
X100
X100
X100
X100
59
0
57
0
48
0
36
0
24
0
15
0
X100
X100
X100
X100
X100
X100
=90
0
=80
0
=70
0
=60
0
=50
0
=40
0
Fig. 5. Schematic illustration of variation in jet structure at various jet impingement angles (0
< α < 90
0
) on kerf generation
In addition to the change in geometry, the following changes in dimensional characteristics
were observed which influence the geometry of the kerf significantly. From Fig. 4a, it can be
observed that the slope of the kerf trailing edge is decreasing with the decrease in
α. This
can be attributed to the shift of jet axis towards the workpiece surface at shallower
α. In
addition to this, with the decrease in α, the depth of erosion was decreased and the top kerf
width was increased (Fig. 7) which results in decrease in slope of kerf wall. Further, the
slope (
β) of kerf trailing wall is less than the jet impingement angle (α) employed. This can
be attributed to the velocity profile that is similar to Gaussian distribution across the jet
cross-section. When the jet impinges at a shallow angle, the maximum erosion is along the
jet axis
'
OZ
(Fig. 6) and the erosion depth in the direction of jet axis across OB decreases as
the velocity of water/abrasive particle decreases due to its Gaussian nature. This makes the
slope of the kerf trailing edge less than the jet impingement angle.
θ
3
> θ
4
(θ
2
> θ
4
)
V
3
> V
4
(V
2
= V
4
)
Z
X
Y
Z’
Z’’
X
O
J
A
A’
A’’
B’’
B
B
’
C’’
C’
C
c
J’
J’
C’’
C’
AB A'B' A''B'': Jet footprint
OJ OJ' OJ'' SOD
A’’
B’
B’’B
O
Diverged
A
WJ
p
lume
d
f
α’
α’’
γ
> α
α
Investigations on Jet Footprint Geometry and its Characteristics
for Complex Shape Machining with Abrasive Waterjets in Silicon Carbide Ceramic Material 481
Fig. 4. Photographs of the 3D jet footprints generated at various jet impingement angles (40
0
< α < 90
0
) (i) top view, and 2D cross
sections at (ii)
v = 100 mm/min, (iii) v = 900 mm/min
(i)
= 90
0
= 80
0
= 70
0
= 60
0
= 50
0
= 40
0
(ii) v = 100 mm/min
= 90
0
= 80
0
= 70
0
= 60
0
= 50
0
= 40
0
(iii) v = 900 mm/min
75
0
65
0
57
0
49
0
37
0
27
0
X100
X100
X100
X100
X100
X100
59
0
57
0
48
0
36
0
24
0
15
0
X100
X100
X100
X100
X100
X100
=90
0
=80
0
=70
0
=60
0
=50
0
=40
0
Fig. 5. Schematic illustration of variation in jet structure at various jet impingement angles (0
< α < 90
0
) on kerf generation
In addition to the change in geometry, the following changes in dimensional characteristics
were observed which influence the geometry of the kerf significantly. From Fig. 4a, it can be
observed that the slope of the kerf trailing edge is decreasing with the decrease in
α. This
can be attributed to the shift of jet axis towards the workpiece surface at shallower
α. In
addition to this, with the decrease in α, the depth of erosion was decreased and the top kerf
width was increased (Fig. 7) which results in decrease in slope of kerf wall. Further, the
slope (
β) of kerf trailing wall is less than the jet impingement angle (α) employed. This can
be attributed to the velocity profile that is similar to Gaussian distribution across the jet
cross-section. When the jet impinges at a shallow angle, the maximum erosion is along the
jet axis
'
OZ
(Fig. 6) and the erosion depth in the direction of jet axis across OB decreases as
the velocity of water/abrasive particle decreases due to its Gaussian nature. This makes the
slope of the kerf trailing edge less than the jet impingement angle.
θ
3
> θ
4
(θ
2
> θ
4
)
V
3
> V
4
(V
2
= V
4
)
Z
X
Y
Z’
Z’’
X
O
J
A
A’
A’’
B’’
B
B
’
C’’
C’
C
c
J’
J’
C’’
C’
AB A'B' A''B'' : Jetfootprint
OJ OJ' OJ'' SOD
A’’
B’
B’’B
O
Diverged
A
WJ
p
lume
d
f
α’
α’’
γ
> α
α
Properties and Applications of Silicon Carbide482
Fig. 6. Schematic illustration of local impact angles of abrasive particles and standoff
distance at shallow (40
0
< α < 90
0
) jet impingement angle on kerf geometry
Maximum erosion depth was observed in the range of 70
0
-80
0
jet impingement angle, i.e. for
v = 100 mm/min erosion is maximum at α = 80
0
and v = 900 mm/min erosion is maximum at
α = 70
0
(Fig. 7). This is a slightly different observation compared to the well known observation
of maximum erosion at normal impingement (
α = 90
0
) in gas-solid particle erosion for brittle
materials (Ruff & Wioderborn, 1979). Similar shift of peak in erosion rate has been reported
previously for sodalime glass w11x and WC–Co alloys w12x in certain erosion conditions
(Chen et al., 1998; Kim & Park, 1998; Anand et al., 1986; Konig et al., 1988). This can be
attributed to the effective average impact angle of abrasive particles and hardness of
workpiece (Oka et al., 1997). The effective average impact angle (
θ) of particles cannot be 90
0
at
α = 90
0
and approaches 90
0
at α < 90
0
. Furthermore, with the increase in hardness, the
maximum erosion occurs at higher impact angles. Hence, the shift in maximum erosion was in
the range of 70
0
-80
0
(α < 90
0
). The width of the kerf increased with the decrease in α (Fig. 7).
This is due to the combined effect of jet impingement angle and jet plume divergence. At
lower
α, the abrasive particles along the forward edge of the jet plume impinges on workpiece
Z’
O
X
A
B
C
Z
β < α
α<90
0
w
t
h
l
t
SOD
d
f
D
3
D
4
D
5
D
1
D
2
P
Q
γ > α
Trailing edge
Forward edge
A
’
θ
4
V
4
θ
3
V
3
Diverged
AWJ plume
at a farther distance compared to higher jet impingement angle, due to divergence, which
results in increase in width of jet footprint (
'B''A'
>
B'A'
>
AB
) as was shown in Fig. 5.
40 50 60 70 80 90
0
0.5
1
1.5
2
2.5
Jet im
p
in
g
ement an
g
le
[
de
g]
Depth of penetration [mm]
40 50 60 70 80 90
0
0.5
1
1.5
2
2.5
Kerf width [mm]
40 50 60 70 80 90
0
0.5
1
1.5
2
2.5
Kerf width [mm]
h(v=100mm/min)
w
t
(v=100mm/min)
h(v=900mm/min)
w
t
(v=900mm/min)
100 500 900 1300 1700
0
0.5
1
1.5
2
Jet feed rate
[
mm/min
]
Depth of penetration [mm]
100 500 900 1300 1700
0
0.5
1
1.5
2
Kerf width [mm]
w
t�
h
w
t�
h
�
Fig. 7. Influence of jet impingement angle
(40
0
< α < 90
0
) on (a) erosion depth and (b)
top kerf width
Fig. 8. Influence of jet feed rate (
α = 90
0
) on
(a) erosion depth and (b) top kerf width
b) Influence of jet feed rate on kerf geometry
(i) Normal jet impingement (α = 90
0
)
From the Fig. 2a (v = 100-1700 mm/min), it can be observed that the symmetric nature of the
kerf geometry is maintained at different v when
α = 90
0
. However, there is a significant
variation in the geometry of kerf at different jet feed rates. This can be explained with the
change in dimensional characteristics of the kerf geometry, such as depth of penetration (
h),
top kerf width (
w
t
) (Fig. 8) and slope of kerf walls (β) (Fig. 2a) with the variation in v. The
well known decreasing trend of
h with the increase in v can be attributed to the increased
exposure time of the material to the jet at lower
v (Fig. 8). As the exposure time increases,
more abrasive particles participate in erosion and penetrate more into the material which
result in increased erosion depth. However, it can be observed that the
h is not uniformly
increased along the kerf geometry with the decrease in
v as the increase in erosion along the
kerf corner/walls is smaller than the increase in erosion along jet axis (Fig. 2b). This is
explained in the following: As the abrasive particles along the trailing edge of jet plume are
at shallower impact angle and the abrasive particles along the jet axis are nearly normal, the
scaling of erosion is less for the same time. Furthermore, water/particle velocity along the
jet axis is higher than jet plume edges. Moreover, at lower
v, at an instantaneous time of
‘t+1’, the abrasive particles interacts with the kerf generated at an instantaneous time ‘t’
which is not a flat surface and cause decrease in ‘effective’ abrasive particle impact angle
from the bottom of the kerf towards the edges of the kerf which results in decreased erosion
in this direction. Hence the kerf geometry deviates from the sinusoidal curve and be
approximated using simple ‘cosine function’ approximation. Further, rounding of edges on
right side of kerf can be seen from Fig. 4a. This effect was significant at lower feed rates. This
may be due to passage of rebounded jet along the left edge (
CA ) of the kerf from the
bottom as the jet enters from the left side (
BC ) of the kerf. The kerf width decreased with
the increase in jet feed rate, although the difference is insignificant (Fig. 8). This is explained
in the following: when a cut is made, at an instantaneous time of ‘t’ sec, the jet footprint,
AB
(Fig. 3), first pass through the material and generates a kerf with top width, which is nearly
equal to the width of the JFP. Following that (at infinitesimally small incremental time,
Investigations on Jet Footprint Geometry and its Characteristics
for Complex Shape Machining with Abrasive Waterjets in Silicon Carbide Ceramic Material 483
Fig. 6. Schematic illustration of local impact angles of abrasive particles and standoff
distance at shallow (40
0
< α < 90
0
) jet impingement angle on kerf geometry
Maximum erosion depth was observed in the range of 70
0
-80
0
jet impingement angle, i.e. for
v = 100 mm/min erosion is maximum at α = 80
0
and v = 900 mm/min erosion is maximum at
α = 70
0
(Fig. 7). This is a slightly different observation compared to the well known observation
of maximum erosion at normal impingement (
α = 90
0
) in gas-solid particle erosion for brittle
materials (Ruff & Wioderborn, 1979). Similar shift of peak in erosion rate has been reported
previously for sodalime glass w11x and WC–Co alloys w12x in certain erosion conditions
(Chen et al., 1998; Kim & Park, 1998; Anand et al., 1986; Konig et al., 1988). This can be
attributed to the effective average impact angle of abrasive particles and hardness of
workpiece (Oka et al., 1997). The effective average impact angle (
θ) of particles cannot be 90
0
at
α = 90
0
and approaches 90
0
at α < 90
0
. Furthermore, with the increase in hardness, the
maximum erosion occurs at higher impact angles. Hence, the shift in maximum erosion was in
the range of 70
0
-80
0
(α < 90
0
). The width of the kerf increased with the decrease in α (Fig. 7).
This is due to the combined effect of jet impingement angle and jet plume divergence. At
lower
α, the abrasive particles along the forward edge of the jet plume impinges on workpiece
Z’
O
X
A
B
C
Z
β < α
α<90
0
w
t
h
l
t
SOD
d
f
D
3
D
4
D
5
D
1
D
2
P
Q
γ > α
Trailing edge
Forward edge
A
’
θ
4
V
4
θ
3
V
3
Diverged
AWJ plume
at a farther distance compared to higher jet impingement angle, due to divergence, which
results in increase in width of jet footprint (
'B''A'
>
B'A'
>
AB
) as was shown in Fig. 5.
40 50 60 70 80 90
0
0.5
1
1.5
2
2.5
Jet im
p
in
g
ement an
g
le
[
de
g]
Depth of penetration [mm]
40 50 60 70 80 90
0
0.5
1
1.5
2
2.5
Kerf width [mm]
40 50 60 70 80 90
0
0.5
1
1.5
2
2.5
Kerf width [mm]
h(v=100mm/min)
w
t
(v=100mm/min)
h(v=900mm/min)
w
t
(v=900mm/min)
100 500 900 1300 1700
0
0.5
1
1.5
2
Jet feed rate
[
mm/min
]
Depth of penetration [mm]
100 500 900 1300 1700
0
0.5
1
1.5
2
Kerf width [mm]
w
t�
h
w
t�
h
�
Fig. 7. Influence of jet impingement angle
(40
0
< α < 90
0
) on (a) erosion depth and (b)
top kerf width
Fig. 8. Influence of jet feed rate (
α = 90
0
) on
(a) erosion depth and (b) top kerf width
b) Influence of jet feed rate on kerf geometry
(i) Normal jet impingement (α = 90
0
)
From the Fig. 2a (v = 100-1700 mm/min), it can be observed that the symmetric nature of the
kerf geometry is maintained at different v when
α = 90
0
. However, there is a significant
variation in the geometry of kerf at different jet feed rates. This can be explained with the
change in dimensional characteristics of the kerf geometry, such as depth of penetration (
h),
top kerf width (
w
t
) (Fig. 8) and slope of kerf walls (β) (Fig. 2a) with the variation in v. The
well known decreasing trend of
h with the increase in v can be attributed to the increased
exposure time of the material to the jet at lower
v (Fig. 8). As the exposure time increases,
more abrasive particles participate in erosion and penetrate more into the material which
result in increased erosion depth. However, it can be observed that the
h is not uniformly
increased along the kerf geometry with the decrease in
v as the increase in erosion along the
kerf corner/walls is smaller than the increase in erosion along jet axis (Fig. 2b). This is
explained in the following: As the abrasive particles along the trailing edge of jet plume are
at shallower impact angle and the abrasive particles along the jet axis are nearly normal, the
scaling of erosion is less for the same time. Furthermore, water/particle velocity along the
jet axis is higher than jet plume edges. Moreover, at lower
v, at an instantaneous time of
‘t+1’, the abrasive particles interacts with the kerf generated at an instantaneous time ‘t’
which is not a flat surface and cause decrease in ‘effective’ abrasive particle impact angle
from the bottom of the kerf towards the edges of the kerf which results in decreased erosion
in this direction. Hence the kerf geometry deviates from the sinusoidal curve and be
approximated using simple ‘cosine function’ approximation. Further, rounding of edges on
right side of kerf can be seen from Fig. 4a. This effect was significant at lower feed rates. This
may be due to passage of rebounded jet along the left edge (
CA ) of the kerf from the
bottom as the jet enters from the left side (
BC ) of the kerf. The kerf width decreased with
the increase in jet feed rate, although the difference is insignificant (Fig. 8). This is explained
in the following: when a cut is made, at an instantaneous time of ‘t’ sec, the jet footprint,
AB
(Fig. 3), first pass through the material and generates a kerf with top width, which is nearly
equal to the width of the JFP. Following that (at infinitesimally small incremental time,
Properties and Applications of Silicon Carbide484
(t+Δt), the jet that has lower width than the footprint (due to divergence of jet plume) passes
through the kerf already formed at an instantaneous time of ‘t’ sec and cannot result in any
further increase in kerf top width. However, at lower
v, the abrasive particles along the
boundary of jet, which have low erosion capability, gets enough time to interact with the
material and enhance the erosion which results in slight increase in kerf width where these
particles cannot make significant erosion at higher
v. Hence, a slight decrease in kerf width
was observed at higher
v (Fig. 8). As a comprehensive view, with the increase in v, the
erosion depth of the kerf is decreased and the width of kerf is nearly constant which results
in a decrease in the slope of the kerf wall (Fig. 8 and Fig. 4a(i)). The slope of the kerf walls
has direct influence on the geometry of the kerf generated. Hence, the jet feed rate plays a
significant role in generating the desired kerf geometrical characteristics.
(ii) Shallow angle jet impingement (40
0
< α < 90
0
)
It can be observed from Fig. 4a that, for the same jet impingement angles, the cross sectional
geometry of the kerf generated at higher jet feed rates (
v = 900 mm/min) is considerably
different in terms of erosion depth, top kerf width and slope of kerf trailing edge from the
same generated at lower
v (= 100 mm/min). This is also due to the fact, that was observed
for normal jet impingement angle at lower v, i.e. interaction of the jet at an instantaneous
time of ‘t+1’ on the surface generated at time ‘t’ which is a non-flat surface; and increase in
exposure time with the decrease in
v. Furthermore, the slope of the kerf trailing wall (β) is
decreased at lower
v for the same α (Fig. 4a). This can be attributed to the increase in erosion
capability of abrasive particles along the jet plume trailing edge
PQ (Fig. 6) at lower v. The
water/abrasive particles have low energy along the trailing edge of diverged jet plume (Fig.
6). At higher
v, due to low exposure time of material to the low energy abrasive particles,
material cannot be eroded in the direction of jet plume trailing edge
PQ (Fig. 6). The
water/abrasive particles along the jet axis
'
OZ , which is less steep than jet plume trailing
edge, i.e.
γ > α, are responsible for material removal. Hence, β is smaller. In contrast to this,
at lower
v, the exposure time of material to the low energy particles increase which
enhances the erosion of material in the direction of jet trailing edge which is steeper than jet
axis. Hence, at lower jet feed rate, the slope of kerf trailing edge is higher than higher
v.
3.1.2 Variation in depth of penetration along jet feed direction
From the bottom of the kerf cross sectional views presented in Figs. 2a and 4a, it is clear that
the
h along the jet feed direction is not uniform. Figure 9a presents an example of a 3D
axonometric plot of the kerf generated at
α = 900, P = 345 MPa (= 50,000 psi), v = 500
mm/min and
m
f
= 0.7 kg/min, where it can be noted the variation in the direction of jet
feed. The same behaviour was observed at all jet impingement angles. In order to analyze
further, the kerf generated at
α = 90
0
was considered. Kerf profiles taken at five equally
distanced sections along the jet feed direction are presented in Fig. 9b. Figure 9c presents the
errorbar graph (1 standard deviation) of the 3D kerf that presents the variation of kerf
profile around the mean profile. From the errorbar graph, it is evaluated that the depth of
erosion along the jet feed direction was varying with a standard deviation of 0.015 mm
around the mean erosion depth of 0.704 mm. The variation in kerf profile can be attributed
to the fluctuations in the pump pressure, jet feed rate employed, abrasive particle mass flow,
transverse feed of milling etc. (Hashish, 1989; Oka et al., 1997; Ansari & Hashish, 1993;
Hashish, 1989; Paul et al., 1998). From the previous studies it is observed that the low energy
jet (at low
P and at higher v levels) generates uniform kerf (Hashish, 1989; Ansari &
Hashish, 1993).
(a)
0.8 1 1.2 1.4 1.6 1.8 2 2.2 2.4 2.5
-0.8
-0.7
-0.6
-0.5
-0.4
-0.3
-0.2
-0.1
0
0.1
Scanning length (mm)
Depth of Erosion (mm)
(b)
0.8 1 1.2 1.4 1.6 1.8 2 2.2 2.4 2.5
-0.8
-0.7
-0.6
-0.5
-0.4
-0.3
-0.2
-0.1
0
0.1
Scanning length (mm)
Depth of Erosion (mm)
(c)
Fig. 9. (a) 3D axonometric plot of kerf generated by AWJ (v=500mm/min), (b) kerf profiles
at different regions in the direction of jet feed, (c) Error bar graph of the kerf
3.1.3 Influence of multi-pass on kerf generation
Figure 10 presents the experimental kerf profiles obtained in single (blue profile) and double
pass (red profile) operations by keeping all the other operating parameters constant.
Intuitively, the double pass is expected to generate the kerf with erosion depth of H =‘2xh’
(green profile) whereas in reality the generated depth is less than ‘2xh’.The decrease in
depth of penetration in double pass can be attributed to the combined effect of (i) change in
local impact angles (θ) of the abrasive particle due to non-flat kerf geometry generated in the
first pass and (ii) increase in SOD due to kerf generated in the first pass. The kerf formation
in double pass approach is schematically illustrated in Fig. 11. ACB is the kerf geometry
generated in single pass with an erosion depth of ‘
h’ and A’C’B’ is the kerf geometry
generated in double pass operation by considering all the other operating parameters
constant.
Influence of kerf geometry generated on the following pass
In a second (or subsequent) pass, erosion is taking place on the previously generated kerf
which is a non-flat surface (ACB) (Fig. 11). This differs from a single pass where erosion
starts on a flat surface (AB). As explained earlier, at α = 90
0
, the impact angle of the abrasive
particles (θ) is 90
0
on the jet axis (OZ ) and decreases in value on either side of jet axis across
the footprint ( AB ). However, in erosion by subsequent (e.g. second) passes, the abrasive
particles interact with a (non-flat) kerf surface formed in the previous passes. Hence, for
subsequent passes, the impact angle of abrasive particles is the angle between the kerf
surface formed by the previous passes and abrasive particles impact direction (Fig. 11)
which decreases away from the centreline and causes decrease in erosion rate, since erosion
is lower at shallower
θ for brittle materials.
Investigations on Jet Footprint Geometry and its Characteristics
for Complex Shape Machining with Abrasive Waterjets in Silicon Carbide Ceramic Material 485
(t+Δt), the jet that has lower width than the footprint (due to divergence of jet plume) passes
through the kerf already formed at an instantaneous time of ‘t’ sec and cannot result in any
further increase in kerf top width. However, at lower
v, the abrasive particles along the
boundary of jet, which have low erosion capability, gets enough time to interact with the
material and enhance the erosion which results in slight increase in kerf width where these
particles cannot make significant erosion at higher
v. Hence, a slight decrease in kerf width
was observed at higher
v (Fig. 8). As a comprehensive view, with the increase in v, the
erosion depth of the kerf is decreased and the width of kerf is nearly constant which results
in a decrease in the slope of the kerf wall (Fig. 8 and Fig. 4a(i)). The slope of the kerf walls
has direct influence on the geometry of the kerf generated. Hence, the jet feed rate plays a
significant role in generating the desired kerf geometrical characteristics.
(ii) Shallow angle jet impingement (40
0
< α < 90
0
)
It can be observed from Fig. 4a that, for the same jet impingement angles, the cross sectional
geometry of the kerf generated at higher jet feed rates (
v = 900 mm/min) is considerably
different in terms of erosion depth, top kerf width and slope of kerf trailing edge from the
same generated at lower
v (= 100 mm/min). This is also due to the fact, that was observed
for normal jet impingement angle at lower v, i.e. interaction of the jet at an instantaneous
time of ‘t+1’ on the surface generated at time ‘t’ which is a non-flat surface; and increase in
exposure time with the decrease in
v. Furthermore, the slope of the kerf trailing wall (β) is
decreased at lower
v for the same α (Fig. 4a). This can be attributed to the increase in erosion
capability of abrasive particles along the jet plume trailing edge
PQ (Fig. 6) at lower v. The
water/abrasive particles have low energy along the trailing edge of diverged jet plume (Fig.
6). At higher
v, due to low exposure time of material to the low energy abrasive particles,
material cannot be eroded in the direction of jet plume trailing edge
PQ (Fig. 6). The
water/abrasive particles along the jet axis
'
OZ , which is less steep than jet plume trailing
edge, i.e.
γ > α, are responsible for material removal. Hence, β is smaller. In contrast to this,
at lower
v, the exposure time of material to the low energy particles increase which
enhances the erosion of material in the direction of jet trailing edge which is steeper than jet
axis. Hence, at lower jet feed rate, the slope of kerf trailing edge is higher than higher
v.
3.1.2 Variation in depth of penetration along jet feed direction
From the bottom of the kerf cross sectional views presented in Figs. 2a and 4a, it is clear that
the
h along the jet feed direction is not uniform. Figure 9a presents an example of a 3D
axonometric plot of the kerf generated at
α = 900, P = 345 MPa (= 50,000 psi), v = 500
mm/min and
m
f
= 0.7 kg/min, where it can be noted the variation in the direction of jet
feed. The same behaviour was observed at all jet impingement angles. In order to analyze
further, the kerf generated at
α = 90
0
was considered. Kerf profiles taken at five equally
distanced sections along the jet feed direction are presented in Fig. 9b. Figure 9c presents the
errorbar graph (1 standard deviation) of the 3D kerf that presents the variation of kerf
profile around the mean profile. From the errorbar graph, it is evaluated that the depth of
erosion along the jet feed direction was varying with a standard deviation of 0.015 mm
around the mean erosion depth of 0.704 mm. The variation in kerf profile can be attributed
to the fluctuations in the pump pressure, jet feed rate employed, abrasive particle mass flow,
transverse feed of milling etc. (Hashish, 1989; Oka et al., 1997; Ansari & Hashish, 1993;
Hashish, 1989; Paul et al., 1998). From the previous studies it is observed that the low energy
jet (at low
P and at higher v levels) generates uniform kerf (Hashish, 1989; Ansari &
Hashish, 1993).
(a)
0.8 1 1.2 1.4 1.6 1.8 2 2.2 2.4 2.5
-0.8
-0.7
-0.6
-0.5
-0.4
-0.3
-0.2
-0.1
0
0.1
Scanning length (mm)
Depth of Erosion (mm)
(b)
0.8 1 1.2 1.4 1.6 1.8 2 2.2 2.4 2.5
-0.8
-0.7
-0.6
-0.5
-0.4
-0.3
-0.2
-0.1
0
0.1
Scanning length (mm)
Depth of Erosion (mm)
(c)
Fig. 9. (a) 3D axonometric plot of kerf generated by AWJ (v=500mm/min), (b) kerf profiles
at different regions in the direction of jet feed, (c) Error bar graph of the kerf
3.1.3 Influence of multi-pass on kerf generation
Figure 10 presents the experimental kerf profiles obtained in single (blue profile) and double
pass (red profile) operations by keeping all the other operating parameters constant.
Intuitively, the double pass is expected to generate the kerf with erosion depth of H =‘2xh’
(green profile) whereas in reality the generated depth is less than ‘2xh’.The decrease in
depth of penetration in double pass can be attributed to the combined effect of (i) change in
local impact angles (θ) of the abrasive particle due to non-flat kerf geometry generated in the
first pass and (ii) increase in SOD due to kerf generated in the first pass. The kerf formation
in double pass approach is schematically illustrated in Fig. 11. ACB is the kerf geometry
generated in single pass with an erosion depth of ‘
h’ and A’C’B’ is the kerf geometry
generated in double pass operation by considering all the other operating parameters
constant.
Influence of kerf geometry generated on the following pass
In a second (or subsequent) pass, erosion is taking place on the previously generated kerf
which is a non-flat surface (ACB) (Fig. 11). This differs from a single pass where erosion
starts on a flat surface (AB). As explained earlier, at α = 90
0
, the impact angle of the abrasive
particles (θ) is 90
0
on the jet axis (OZ ) and decreases in value on either side of jet axis across
the footprint (
AB ). However, in erosion by subsequent (e.g. second) passes, the abrasive
particles interact with a (non-flat) kerf surface formed in the previous passes. Hence, for
subsequent passes, the impact angle of abrasive particles is the angle between the kerf
surface formed by the previous passes and abrasive particles impact direction (Fig. 11)
which decreases away from the centreline and causes decrease in erosion rate, since erosion
is lower at shallower
θ for brittle materials.
Properties and Applications of Silicon Carbide486
0 0.5 1 1.5 2 2.5 3
-1.6
-1.4
-1.2
-1
-0.8
-0.6
-0.4
-0.2
0
0.2
Scanning Length [mm]
Depth of Penetration [mm]
Exp-Singlepass(SOD
1
=3mm)
Expected-Doublepass(2XSOD
1
)
Exp-Doublepass(SOD
2
=SOD
1
+h
1
)
SOD Correctedpass(SOD
2
-h
1
)
Fig. 10. Influence of number of passes and standoff distance on kerf generation (α = 90
0
)
b) Influence of SOD on characteristics of kerf generated in double pass
Furthermore, the actual standoff distance (SOD
actual
) in a second (or subsequent) pass is the
sum of SOD set in the first pass and the erosion depth (h), i.e. SOD
actual
= SOD + h. In order
to support the intuition experimentally, SOD correction experiments were conducted:
1st pass achieved a maximum penetration depth of 0.45 mm (
P = 50,000 PSI, m
f
= 0.7
kg/min,
v = 500 mm/min, d
f
= 1.06 mm, d
o
= 0.3 mm, SOD = 3 mm). After the first pass, the
SOD becomes 3.45 mm as the depth of penetration achieved in single pass was 0.45 mm, i.e.
SOD
actual
= 3+0.45. Hence, the focusing nozzle was moved down by 0.45 mm which makes
the SOD again to 3mm that was employed for a single pass cut. Figure 10 presents the kerf
profiles of (a) single pass, (b) intuitive/expected double pass (two folds depth of penetration
in single pass cut), (c) experimentally achieved double pass and (d) corrected double pass
(cut made after moving down the focusing nozzle by 0.45 mm). All the other operating
parameters were kept constant throughout the study. From the results, it can be observed
that there is very little change in erosion depth due to the movement of focusing nozzle
down by 0.45 mm. However, when the number of passes increases, the small effect of SOD
becomes cumulative. From this, it can be concluded that although the increased SOD has
influence on the reduction of depth of penetration in following passes, it is not significant.
However, it has to be considered for tight dimensional control. Hence, in a comprehensive
view, to control the erosion depth in multi-passes, the influence of kerf generated in
previous pass and the SOD have to be considered for control over the surface to be
generated.
With the knowledge gained from the experimental investigation on the jet footprints, in the
following section, development and validation of an analytical model for prediction of JFP
at normal jet impingement angle is presented.
Z
X
= 90
0
�
B
�
A
�
C
h
w
t
t
SOD
Diverged
AWJ plume
d
f
SOD + h
H < 2
h
A
B
C
�
l
Fig. 11. Schematic illustration of kerf generation in multi-pass operation (α = 90
0
)
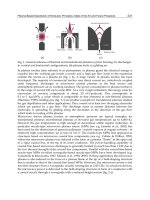
3.2 Model for the jet footprint geometry (Axinte et al., 2010)
For this model it was assumed that an abrasive waterjet jet, with radius a, impacts at 90º a
flat workpiece surface while moving with a constant feed speed v
f
in the y-direction. This
means that, for the time being, the proposed model is more applicable to brittle target
workpiece materials on which normal jet impingement angle has been found to give higher
material removal rates (Hashish, 1993). The jet footprint (Fig. 12a) is a function z= Z(x, y, t)
in which x - distance from the jet axis, y - the direction in which the jet moves and t - dwell
(exposure) time. For brittle materials, maximum erosion occurs when the jet is
perpendicular to the workpiece so this model assumes that the etching rate is proportional
to some power (k) of the impingement velocity (Slikkerveer, 1999; Getu et al., 2008;
Ghobeity et al., 2008) Eq. (1), of the jet in the direction of the inwards unit normal, Eq. (2), of
the surface being etched.
Investigations on Jet Footprint Geometry and its Characteristics
for Complex Shape Machining with Abrasive Waterjets in Silicon Carbide Ceramic Material 487
0 0.5 1 1.5 2 2.5 3
-1.6
-1.4
-1.2
-1
-0.8
-0.6
-0.4
-0.2
0
0.2
Scanning Length [mm]
Depth of Penetration [mm]
Exp-Singlepass(SOD
1
=3mm)
Expected-Doublepass(2XSOD
1
)
Exp-Doublepass(SOD
2
=SOD
1
+h
1
)
SOD Correctedpass(SOD
2
-h
1
)
Fig. 10. Influence of number of passes and standoff distance on kerf generation (α = 90
0
)
b) Influence of SOD on characteristics of kerf generated in double pass
Furthermore, the actual standoff distance (SOD
actual
) in a second (or subsequent) pass is the
sum of SOD set in the first pass and the erosion depth (h), i.e. SOD
actual
= SOD + h. In order
to support the intuition experimentally, SOD correction experiments were conducted:
1st pass achieved a maximum penetration depth of 0.45 mm (
P = 50,000 PSI, m
f
= 0.7
kg/min,
v = 500 mm/min, d
f
= 1.06 mm, d
o
= 0.3 mm, SOD = 3 mm). After the first pass, the
SOD becomes 3.45 mm as the depth of penetration achieved in single pass was 0.45 mm, i.e.
SOD
actual
= 3+0.45. Hence, the focusing nozzle was moved down by 0.45 mm which makes
the SOD again to 3mm that was employed for a single pass cut. Figure 10 presents the kerf
profiles of (a) single pass, (b) intuitive/expected double pass (two folds depth of penetration
in single pass cut), (c) experimentally achieved double pass and (d) corrected double pass
(cut made after moving down the focusing nozzle by 0.45 mm). All the other operating
parameters were kept constant throughout the study. From the results, it can be observed
that there is very little change in erosion depth due to the movement of focusing nozzle
down by 0.45 mm. However, when the number of passes increases, the small effect of SOD
becomes cumulative. From this, it can be concluded that although the increased SOD has
influence on the reduction of depth of penetration in following passes, it is not significant.
However, it has to be considered for tight dimensional control. Hence, in a comprehensive
view, to control the erosion depth in multi-passes, the influence of kerf generated in
previous pass and the SOD have to be considered for control over the surface to be
generated.
With the knowledge gained from the experimental investigation on the jet footprints, in the
following section, development and validation of an analytical model for prediction of JFP
at normal jet impingement angle is presented.
Z
X
= 90
0
�
B
�
A
�
C
h
w
t
t
SOD
Diverged
AWJ plume
d
f
SOD + h
H < 2
h
A
B
C
�
l
Fig. 11. Schematic illustration of kerf generation in multi-pass operation (α = 90
0
)
3.2 Model for the jet footprint geometry (Axinte et al., 2010)
For this model it was assumed that an abrasive waterjet jet, with radius a, impacts at 90º a
flat workpiece surface while moving with a constant feed speed v
f
in the y-direction. This
means that, for the time being, the proposed model is more applicable to brittle target
workpiece materials on which normal jet impingement angle has been found to give higher
material removal rates (Hashish, 1993). The jet footprint (Fig. 12a) is a function z= Z(x, y, t)
in which x - distance from the jet axis, y - the direction in which the jet moves and t - dwell
(exposure) time. For brittle materials, maximum erosion occurs when the jet is
perpendicular to the workpiece so this model assumes that the etching rate is proportional
to some power (k) of the impingement velocity (Slikkerveer, 1999; Getu et al., 2008;
Ghobeity et al., 2008) Eq. (1), of the jet in the direction of the inwards unit normal, Eq. (2), of
the surface being etched.
Properties and Applications of Silicon Carbide488
(a) (b)
Fig. 12. Schematic of the jet footprint: cross section (a) and top view (b)
V
1-
0
0
)(rV
where V(r) is the velocity profile of the impinging jet (1)
n
1-
1
1
2
1
2
2
y
Z
x
Z
y
Z
x
Z
(2)
The component of the jet's velocity in the direction of the inwards unit normal of the surface
is now given by the dot product of V and n (Slikkerveer, 1999; Getu et al., 2008; Ghobeity et
al., 2008; Ten Thije Boonkamp & Jansen, 2002; Hashish, 1993) as shown in Eq. 3. where, n is
normal to the kerf surface.
V
n
2
1
2
2
1
V(r)
y
Z
x
Z
(3)
As the jet moves along the y axis (Fig. 12b), a point situated at distance x from the jet axis (-
a≤ x ≤ a) will be impinged by the abrasive jet when
2222
xatvxa
f
at which
times the jet footprint follows Eq. (4).
t
Z
(Vn)
k
(4)
Considering that the etching (material specific erosion) rate, E, is dependent only on the
radial position r ≤ a and defining it as E(r) = C(V
n)
k
(Slikkerveer, 1999; Getu et al., 2008;
Ghobeity et al., 2008), C and k positive constants, and then substituting Eq. (3), the jet
footprint becomes Eq. (5).
atvxaxatva
xatvxa
y
Z
x
Z
tvxE
y
Z
x
Z
rE
t
Z
ff
f
k
f
k
2222
2222
2
2
2
2
2
2
2
2
2
and for 0
for
1
1
(5)
As the etching rate E is dependent on the properties of the workpiece material and other
process parameters (e.g. pressure, mass flow of abrasives) it is treated as a function that
needs to be calibrated using experimental data; note also that for this simple geometry and
jet motion, the final surface will be a trench, with no variation in the y-direction. The
problem can be made dimensionless by defining:
tvyEvEt
v
a
tZaZxax
ff
f
; ; ; ;
;
note that in the following ‘barred notations’ (e.g.
x ) represent dimensionless measures.
Here
vf is the maximum etching rate, so that the dimensionless etching rate function
E
has
a maximum value of one. In dimensionless terms the geometrical model, Eq. (5), of the kerf
becomes as described in Eq. (6).
11 and 11for 0
11for
1
22
22
2
22
22
txxt
xtx
t
Z
x
Z
txE
t
Z
k
(6)
This is a nonlinear partial differential equation, and has no obvious analytical solution.
However, if
is small (obtained at high jet feed speeds), the kerf slope is small and the
equation can be linearized Eq. (7).
1x1-with
11 and 11for 0
11for
22
2222
txxt
xtxtxE
t
Z
(7)
If now this simple equation is integrated, the shape of the eroded shallow kerf can be
obtained as in Eq. (8).
rd
xr
rEr
xZ
x
o
1
22
)(
2)(
(8)
After some manipulation, this integral equation can be inverted to obtain Eq. (9).
2
1
2
3
22
1
)()()(
1
)(
r
rZ
dR
rR
rZRZR
rE
o
r
oo
(9)
Investigations on Jet Footprint Geometry and its Characteristics
for Complex Shape Machining with Abrasive Waterjets in Silicon Carbide Ceramic Material 489
(a) (b)
Fig. 12. Schematic of the jet footprint: cross section (a) and top view (b)
V
1-
0
0
)(rV
where V(r) is the velocity profile of the impinging jet (1)
n
1-
1
1
2
1
2
2
y
Z
x
Z
y
Z
x
Z
(2)
The component of the jet's velocity in the direction of the inwards unit normal of the surface
is now given by the dot product of V and n (Slikkerveer, 1999; Getu et al., 2008; Ghobeity et
al., 2008; Ten Thije Boonkamp & Jansen, 2002; Hashish, 1993) as shown in Eq. 3. where, n is
normal to the kerf surface.
V
n
2
1
2
2
1
V(r)
y
Z
x
Z
(3)
As the jet moves along the y axis (Fig. 12b), a point situated at distance x from the jet axis (-
a≤ x ≤ a) will be impinged by the abrasive jet when
2222
xatvxa
f
at which
times the jet footprint follows Eq. (4).
t
Z
(Vn)
k
(4)
Considering that the etching (material specific erosion) rate, E, is dependent only on the
radial position r ≤ a and defining it as E(r) = C(V
n)
k
(Slikkerveer, 1999; Getu et al., 2008;
Ghobeity et al., 2008), C and k positive constants, and then substituting Eq. (3), the jet
footprint becomes Eq. (5).
atvxaxatva
xatvxa
y
Z
x
Z
tvxE
y
Z
x
Z
rE
t
Z
ff
f
k
f
k
2222
2222
2
2
2
2
2
2
2
2
2
and for 0
for
1
1
(5)
As the etching rate E is dependent on the properties of the workpiece material and other
process parameters (e.g. pressure, mass flow of abrasives) it is treated as a function that
needs to be calibrated using experimental data; note also that for this simple geometry and
jet motion, the final surface will be a trench, with no variation in the y-direction. The
problem can be made dimensionless by defining:
tvyEvEt
v
a
tZaZxax
ff
f
; ; ; ;
;
note that in the following ‘barred notations’ (e.g.
x ) represent dimensionless measures.
Here
vf is the maximum etching rate, so that the dimensionless etching rate function
E
has
a maximum value of one. In dimensionless terms the geometrical model, Eq. (5), of the kerf
becomes as described in Eq. (6).
11 and 11for 0
11for
1
22
22
2
22
22
txxt
xtx
t
Z
x
Z
txE
t
Z
k
(6)
This is a nonlinear partial differential equation, and has no obvious analytical solution.
However, if
is small (obtained at high jet feed speeds), the kerf slope is small and the
equation can be linearized Eq. (7).
1x1-with
11 and 11for 0
11for
22
2222
txxt
xtxtxE
t
Z
(7)
If now this simple equation is integrated, the shape of the eroded shallow kerf can be
obtained as in Eq. (8).
rd
xr
rEr
xZ
x
o
1
22
)(
2)(
(8)
After some manipulation, this integral equation can be inverted to obtain Eq. (9).
2
1
2
3
22
1
)()()(
1
)(
r
rZ
dR
rR
rZRZR
rE
o
r
oo
(9)
Properties and Applications of Silicon Carbide490
It is now possible to calibrate the model using an experimentally obtained shallow kerf
shape
)x(
o
Z in Eq. (9) to find the specific etching rate )r(E . With )r(E known, the Eq. (6) can
be integrated numerically, using Newton method to find
t
Z
at each time step and
ultimately to determine Z(x) for any value of
, and hence predict the profile of any kerf,
including those whose slope is not small (obtained at various jet feed speeds). Therefore, to
find the kerf profile at any jet feed speed the following successive steps should be followed:
1. Generate a shallow profile (i.e.
)x(
o
Z ) with small kerf slopes.
2. Knowing
)x(
o
Z , the specific etching rate )r(E can be numerically evaluated using
Eq. (9).
3. Once
)r(E is known, the kerf profile, Z(x), can be obtained for any jet feed speed by
solving Eq. (5).
Using process parameters (mf= 0.7 kg/min; P= 345 MPa; D0= 3 mm) mentioned in the
previous section at a high value of jet feed speed (vf = 1700 mm/min) a shallow kerf on SiC
target workpiece was generated and its scanned profile (i.e.
)x(Z
o
) has been used as calibrated
(Fig. 13a) input into Eq. (9) from where employing a MATLAB code the specific etching rate
)r(E was evaluated. Then, with )r(E known, predictions of the kerf profiles for smaller jet feed
speeds (vf = 100, 500, 900 and 1300 mm/min) have been generated and compared with those
experimentally obtained; this revealed that only for small jet feed speed (i.e. vf = 100
mm/min), the model predicts noticeably deeper (approx. 30 µm) kerf than the experimental
one (see Model 1 – Fig. 13e). This is somehow an expected finding since with deeper kerf
profiles, the real stand-off distance (D) increases considerably (40%) with the increase of jet
dwell time (decrease of vf). Therefore, the bottom of the kerf is situated at larger values of
stand-off distance from the jet nozzle and consequently less erosion than the theoretical one
occurs here. To account for this phenomenon, it has been thought that the distance between
the jet and the workpiece should be included in the model.
If D0 is the initial SOD between the centre of the nozzle and the point (x, z) = (0, 0), then the
distance from the opening of the jet to any point on the kerf surface is given by D(x, t) = D0
Z(x, t). Preliminary experimental trials on SiC target workpiece showed that the maximum
jet penetration occurs at a stand-off distance of 3 mm but if the jet is any closer then cracks
or breaks may occur on the target surface. This suggests that:
),(
t
Z
txDF
(10)
where F is the linear function F(D(x, t)) = 1 b[D(x, t) 3], and b 0 should be determined
by fitting the model to experimental data. Combining this with Eq. (4), the new kerf profile
dependence it is obtained, Eq. (11).
2
2
2
1
),()(
t
Z
k
y
Z
x
Z
txDFrE
(11)
Hence, after applying the same non-dimensionalization procedure, Eq. (6) now becomes the
corrected jet footprint dependence as shown in Eq. (12).
11 and 11for 0
11for
1
),(
22
22
2
22
22
txxt
xtx
t
Z
x
Z
txDFtxE
t
Z
k
(12)
(a) (b)
(c) (d)
(e)
Fig. 13. Experimental vs. predicted kerfs at various jet feed speeds
Investigations on Jet Footprint Geometry and its Characteristics
for Complex Shape Machining with Abrasive Waterjets in Silicon Carbide Ceramic Material 491
It is now possible to calibrate the model using an experimentally obtained shallow kerf
shape
)x(
o
Z in Eq. (9) to find the specific etching rate )r(E . With )r(E known, the Eq. (6) can
be integrated numerically, using Newton method to find
t
Z
at each time step and
ultimately to determine Z(x) for any value of
, and hence predict the profile of any kerf,
including those whose slope is not small (obtained at various jet feed speeds). Therefore, to
find the kerf profile at any jet feed speed the following successive steps should be followed:
1. Generate a shallow profile (i.e.
)x(
o
Z ) with small kerf slopes.
2. Knowing
)x(
o
Z , the specific etching rate )r(E can be numerically evaluated using
Eq. (9).
3. Once
)r(E is known, the kerf profile, Z(x), can be obtained for any jet feed speed by
solving Eq. (5).
Using process parameters (mf= 0.7 kg/min; P= 345 MPa; D0= 3 mm) mentioned in the
previous section at a high value of jet feed speed (vf = 1700 mm/min) a shallow kerf on SiC
target workpiece was generated and its scanned profile (i.e.
)x(Z
o
) has been used as calibrated
(Fig. 13a) input into Eq. (9) from where employing a MATLAB code the specific etching rate
)r(E was evaluated. Then, with )r(E known, predictions of the kerf profiles for smaller jet feed
speeds (vf = 100, 500, 900 and 1300 mm/min) have been generated and compared with those
experimentally obtained; this revealed that only for small jet feed speed (i.e. vf = 100
mm/min), the model predicts noticeably deeper (approx. 30 µm) kerf than the experimental
one (see Model 1 – Fig. 13e). This is somehow an expected finding since with deeper kerf
profiles, the real stand-off distance (D) increases considerably (40%) with the increase of jet
dwell time (decrease of vf). Therefore, the bottom of the kerf is situated at larger values of
stand-off distance from the jet nozzle and consequently less erosion than the theoretical one
occurs here. To account for this phenomenon, it has been thought that the distance between
the jet and the workpiece should be included in the model.
If D0 is the initial SOD between the centre of the nozzle and the point (x, z) = (0, 0), then the
distance from the opening of the jet to any point on the kerf surface is given by D(x, t) = D0
Z(x, t). Preliminary experimental trials on SiC target workpiece showed that the maximum
jet penetration occurs at a stand-off distance of 3 mm but if the jet is any closer then cracks
or breaks may occur on the target surface. This suggests that:
),(
t
Z
txDF
(10)
where F is the linear function F(D(x, t)) = 1 b[D(x, t) 3], and b 0 should be determined
by fitting the model to experimental data. Combining this with Eq. (4), the new kerf profile
dependence it is obtained, Eq. (11).
2
2
2
1
),()(
t
Z
k
y
Z
x
Z
txDFrE
(11)
Hence, after applying the same non-dimensionalization procedure, Eq. (6) now becomes the
corrected jet footprint dependence as shown in Eq. (12).
11 and 11for 0
11for
1
),(
22
22
2
22
22
txxt
xtx
t
Z
x
Z
txDFtxE
t
Z
k
(12)
(a) (b)
(c) (d)
(e)
Fig. 13. Experimental vs. predicted kerfs at various jet feed speeds
Properties and Applications of Silicon Carbide492
This can again be solved as before by linearizing the problem which approximates D(x, t) =
D0 when vf is large (vf= 1700 mm/min). Therefore, F(D(x, t)) is just a constant and
)r(E is
the same as in Eq. (9). Utilising the same calibration method as before and the corrected jet
footprint model, Eq. (12), the comparison between the predicted (modelled) kerf profiles
and the experimental data is presented in Fig. 13 where the notations Model 1 and Model 2
refer to footprint mathematical predictions on which the correction of stand-off distance was
omitted (Eq. (5) for k=1.24) and included (Eq. (12) for k=0.72, b=0.4) respectively. The
summarised results in Fig. 13 clearly show that the corrected jet footprint model is capable
to predict at high degree of accuracy (error <5%) the kerf profile at various jet feed speeds.
The model presented, in this section, can only approximate the geometry of the JFP and
cannot effectively predict the jet footprint’s top width, which is one of the critical parameters
in controlling the dimensions of the final component milled as mentioned in earlier sections.
Hence, in the following section, a model developed exclusively for prediction of top width
of the JFP is presented.
3.3 Model for top width of jet footprint (Srinivasu, D.S. & Axinte, D.A.)
3.3.1 Development of model for top width of jet footprint
In 2-axis machining, the top width (w
t
) of the JFP can be determined by considering the
diameter of focusing nozzle (
d
f
), jet plume divergence in air (
) and SOD. The development
of model for the
w
t
of the JFP involves two stages: Firstly, an expression for the jet plume
divergence (
) at normal jet impingement angle is derived by considering the d
f
, SOD and
the
w
t
generated at a jet feed rate of 1700mm/min. Secondly, an expressions for the w
t
(α) at
shallow jet impingement angles is derived based on the geometry of the tilted structure of
the jet plume at shallow
α (Fig. 14b), by considering the previously evaluated
.
a) Expression for jet plume divergence,
The jet plume diverges in air with an angle of
after emerging from the focusing nozzle of
bore diameter,
d
f
, before interacting with the target workpiece situated at a distance of SOD
(Fig. 14a). Due to the divergence of the jet plume at normal jet impingement angle, the width
of the jet increases gradually from
d
f
(at the tip of focusing nozzle) to w
t
(at a distance of
SOD) depending on the jet plume divergence angle. The expression for the
can be
derived as follows:
From Δ
le
AEC (Fig. 14a),
2(SOD)
f
d
t
w
1
tan
(13)
b) Expression for width of jet footprint at normal jet impingement, w
t
The top width of the JFP at a distance x, at normal jet impingement, can be approximated by
the width (diameter) of jet plume at that distance (Fig. 14a). As the width of the jet depends
on the distance between workpiece and the tip of focusing nozzle, initial diameter of
focusing nozzle and jet plume divergence, the
w
t
can be derived as follows:
From Δ
le
MNC (Fig. 14a), w
t
at a distance of X = )(2 MN
f
d
x
d =
tanx2
f
d
x
d (14)
c) Expression for width of jet footprint at shallow jet impingement, w
t
(α)
The jet plume divergence angle is constant and will not change with the change in jet
impingement angles. Hence, at shallower jet impingement angles (
α < 90
0
), the width of the
JFP can be approximated geometrically from the consistent structure of the jet plume as the
summation of three parts on the target workpiece surface (Fig. 14b): (i) leading part of the
top width of JFP generated by leading portion of jet plume (a -
A
'E' ), (ii) right part of the
top width of JFP generated by trailing portion of jet plume (b -
F
'B'
) and (iii) middle part
generated by the diameter of focusing nozzle (
E'O' + O'F' ).
w
t
(α) =
A
'B
'
=
A
'E' + E'O' + O'F' +
F
'B' (15)
Evaluation of
A
'E' : (a)
From Δ
le
C’A’E’ (Fig. 14b),
A
'E' =
αα
d
SOD
f
sin
sin
tan2
(15.1)
Evaluation of
E'O' :
From Δ
le
J’E’O’ (Fig. 14b),
α
f
d
E'O'
sin2
(15.2)
Evaluation of
O'F'
:
From Δ
le
I’O’F’(Fig. 14b), O'F' =
αsin
F'I'
=
α
d
f
sin2
(15.3)
Evaluation of
F
'B'
:(b)
From Δ
le
D’F’B’ (Fig. 14b), F'B' =
φα
φ
F'D'
sin
sin
=
φα
φ
α
d
SOD
f
sin
sin
tan2
(15.4)
Finally, from Eq. (3.1), Eq. (3.2), Eq. (3.3) and Eq. (3.4)
w
t
(α) =
A
'B
'
=
A
'E' + E'O' + O'F' +
F
'B'
=
φα
φ
α
d
SOD
f
sin
sin
tan2
+
α
d
f
sin
+
φα
φ
α
d
SOD
f
sin
sin
tan2
(16)
Investigations on Jet Footprint Geometry and its Characteristics
for Complex Shape Machining with Abrasive Waterjets in Silicon Carbide Ceramic Material 493
This can again be solved as before by linearizing the problem which approximates D(x, t) =
D0 when vf is large (vf= 1700 mm/min). Therefore, F(D(x, t)) is just a constant and
)r(E is
the same as in Eq. (9). Utilising the same calibration method as before and the corrected jet
footprint model, Eq. (12), the comparison between the predicted (modelled) kerf profiles
and the experimental data is presented in Fig. 13 where the notations Model 1 and Model 2
refer to footprint mathematical predictions on which the correction of stand-off distance was
omitted (Eq. (5) for k=1.24) and included (Eq. (12) for k=0.72, b=0.4) respectively. The
summarised results in Fig. 13 clearly show that the corrected jet footprint model is capable
to predict at high degree of accuracy (error <5%) the kerf profile at various jet feed speeds.
The model presented, in this section, can only approximate the geometry of the JFP and
cannot effectively predict the jet footprint’s top width, which is one of the critical parameters
in controlling the dimensions of the final component milled as mentioned in earlier sections.
Hence, in the following section, a model developed exclusively for prediction of top width
of the JFP is presented.
3.3 Model for top width of jet footprint (Srinivasu, D.S. & Axinte, D.A.)
3.3.1 Development of model for top width of jet footprint
In 2-axis machining, the top width (w
t
) of the JFP can be determined by considering the
diameter of focusing nozzle (
d
f
), jet plume divergence in air (
) and SOD. The development
of model for the
w
t
of the JFP involves two stages: Firstly, an expression for the jet plume
divergence (
) at normal jet impingement angle is derived by considering the d
f
, SOD and
the
w
t
generated at a jet feed rate of 1700mm/min. Secondly, an expressions for the w
t
(α) at
shallow jet impingement angles is derived based on the geometry of the tilted structure of
the jet plume at shallow
α (Fig. 14b), by considering the previously evaluated
.
a) Expression for jet plume divergence,
The jet plume diverges in air with an angle of
after emerging from the focusing nozzle of
bore diameter,
d
f
, before interacting with the target workpiece situated at a distance of SOD
(Fig. 14a). Due to the divergence of the jet plume at normal jet impingement angle, the width
of the jet increases gradually from
d
f
(at the tip of focusing nozzle) to w
t
(at a distance of
SOD) depending on the jet plume divergence angle. The expression for the
can be
derived as follows:
From Δ
le
AEC (Fig. 14a),
2(SOD)
f
d
t
w
1
tan
(13)
b) Expression for width of jet footprint at normal jet impingement, w
t
The top width of the JFP at a distance x, at normal jet impingement, can be approximated by
the width (diameter) of jet plume at that distance (Fig. 14a). As the width of the jet depends
on the distance between workpiece and the tip of focusing nozzle, initial diameter of
focusing nozzle and jet plume divergence, the
w
t
can be derived as follows:
From Δ
le
MNC (Fig. 14a), w
t
at a distance of X = )(2 MN
f
d
x
d =
tanx2
f
d
x
d
(14)
c) Expression for width of jet footprint at shallow jet impingement, w
t
(α)
The jet plume divergence angle is constant and will not change with the change in jet
impingement angles. Hence, at shallower jet impingement angles (
α < 90
0
), the width of the
JFP can be approximated geometrically from the consistent structure of the jet plume as the
summation of three parts on the target workpiece surface (Fig. 14b): (i) leading part of the
top width of JFP generated by leading portion of jet plume (a -
A
'E' ), (ii) right part of the
top width of JFP generated by trailing portion of jet plume (b -
F
'B'
) and (iii) middle part
generated by the diameter of focusing nozzle (
E'O' + O'F' ).
w
t
(α) =
A
'B
'
=
A
'E' + E'O' + O'F' +
F
'B' (15)
Evaluation of
A
'E' : (a)
From Δ
le
C’A’E’ (Fig. 14b),
A
'E' =
αα
d
SOD
f
sin
sin
tan2
(15.1)
Evaluation of
E'O' :
From Δ
le
J’E’O’ (Fig. 14b),
α
f
d
E'O'
sin2
(15.2)
Evaluation of
O'F'
:
From Δ
le
I’O’F’(Fig. 14b), O'F' =
αsin
F'I'
=
α
d
f
sin2
(15.3)
Evaluation of
F
'B'
:(b)
From Δ
le
D’F’B’ (Fig. 14b), F'B' =
φα
φ
F'D'
sin
sin
=
φα
φ
α
d
SOD
f
sin
sin
tan2
(15.4)
Finally, from Eq. (3.1), Eq. (3.2), Eq. (3.3) and Eq. (3.4)
w
t
(α) =
A
'B
'
=
A
'E' + E'O' + O'F' +
F
'B'
=
φα
φ
α
d
SOD
f
sin
sin
tan2
+
α
d
f
sin
+
φα
φ
α
d
SOD
f
sin
sin
tan2
(16)
Properties and Applications of Silicon Carbide494
Fig. 14. Schematic illustration of jet plume structure in air before impingement onto the target surface (a) normal impingement,
(b) shallow angle impingement
)b( )a(
w
t( )
effective
b
a
d
f
D�
C�
F
w
t
( )
E
�
O�
I�
J�
d
f
SOD
Forward edge of jet plume
Trailing edge
of
j
et
p
lume
Jet plume
Jet plume
d
f
w
t
SOD
d
f
A
B
D
C
E
x
d
x
NM
B�
A
�
F
However, this model cannot be employed at jet feed rates higher than 100 mm/min as the
effective divergence of jet plume, that is responsible for erosion, decreases at higher jet feed
rates, although the jet plume divergence angle does not change with
v as discussed earlier.
Hence, the prediction of
w
t
(α) at desired jet feed rates, higher than 100 mm/min, needs the
evaluation of
at that desired v, and is termed in this modelling study as effective
divergence angle,
v
. The
v
replaces the jet plume divergence angle (
) in the above
model for evaluation of top width of JFP at any jet impingement angle at desired
v.
3.3.2 Assessment of the proposed model for the top width of jet footprint
a) Without considering the ‘effective jet plume divergence’
40 50 60 70 80 90
1
1.5
2
2.5
3
Jet impingement angle [deg]
Top kerf width [mm]
Model
v=900mm/min
v=100mm/min
Fig. 15. Variation in top width of jet footprint with the jet impingement angle without
considering the ‘effective jet plume divergence’
Figure 15 presents the w
t
predicted by the proposed model without considering the
parameter:
‘effective jet plume divergence’, along with the experimentally achieved values at
lower (
v = 100mm/min) and higher (v = 900mm/min) jet feed rates. The predicted values
are in well agreement with the experimental values at
v = 100 mm/min. However, the
difference is considerable at higher jet feed rate (
v = 900 mm/min). Furthermore, this
difference increased at shallower jet impingement angles. This may be explained as follows:
(i) With the increase in
v, the exposure time of the material to the jet plume decreases.
Furthermore, the erosion capability of the abrasive particles along the jet plume edges is
less due to low impact angle of abrasive particles (Fig. 6 and Fig. 3). Because of the
combined effect of exposure time and low impact angle, the erosion capability of the
abrasive particles along the jet plume edges decreases with the increase in jet feed rate.
Hence, the ‘
effective jet plume divergence’ is, indirectly, a function of jet feed rate.
However, the proposed model evaluated the erosion at higher jet feed rate (
v =
900mm/min) according to the jet plume divergence angle (
) that was evaluated at
lower jet feed rate (
v = 100mm/min) which results in increase in difference between
predicted and experimental values.
Investigations on Jet Footprint Geometry and its Characteristics
for Complex Shape Machining with Abrasive Waterjets in Silicon Carbide Ceramic Material 495
Fig. 14. Schematic illustration of jet plume structure in air before impingement onto the target surface (a) normal impingement,
(b) shallow angle impingement
)b( )a(
w
t( )
effective
b
a
d
f
D�
C�
F
w
t
( )
E
�
O�
I�
J�
d
f
SOD
Forward edge of jet plume
Trailing edge
of
j
et
p
lume
Jet plume
Jet plume
d
f
w
t
SOD
d
f
A
B
D
C
E
x
d
x
NM
B�
A
�
F
However, this model cannot be employed at jet feed rates higher than 100 mm/min as the
effective divergence of jet plume, that is responsible for erosion, decreases at higher jet feed
rates, although the jet plume divergence angle does not change with
v as discussed earlier.
Hence, the prediction of
w
t
(α) at desired jet feed rates, higher than 100 mm/min, needs the
evaluation of
at that desired v, and is termed in this modelling study as effective
divergence angle,
v
. The
v
replaces the jet plume divergence angle (
) in the above
model for evaluation of top width of JFP at any jet impingement angle at desired
v.
3.3.2 Assessment of the proposed model for the top width of jet footprint
a) Without considering the ‘effective jet plume divergence’
40 50 60 70 80 90
1
1.5
2
2.5
3
Jet impingement angle [deg]
Top kerf width [mm]
Model
v=900mm/min
v=100mm/min
Fig. 15. Variation in top width of jet footprint with the jet impingement angle without
considering the ‘effective jet plume divergence’
Figure 15 presents the w
t
predicted by the proposed model without considering the
parameter:
‘effective jet plume divergence’, along with the experimentally achieved values at
lower (
v = 100mm/min) and higher (v = 900mm/min) jet feed rates. The predicted values
are in well agreement with the experimental values at
v = 100 mm/min. However, the
difference is considerable at higher jet feed rate (
v = 900 mm/min). Furthermore, this
difference increased at shallower jet impingement angles. This may be explained as follows:
(i) With the increase in
v, the exposure time of the material to the jet plume decreases.
Furthermore, the erosion capability of the abrasive particles along the jet plume edges is
less due to low impact angle of abrasive particles (Fig. 6 and Fig. 3). Because of the
combined effect of exposure time and low impact angle, the erosion capability of the
abrasive particles along the jet plume edges decreases with the increase in jet feed rate.
Hence, the ‘
effective jet plume divergence’ is, indirectly, a function of jet feed rate.
However, the proposed model evaluated the erosion at higher jet feed rate (
v =
900mm/min) according to the jet plume divergence angle (
) that was evaluated at
lower jet feed rate (
v = 100mm/min) which results in increase in difference between
predicted and experimental values.