Waste Water Evaluation and Management Part 4 doc
Bạn đang xem bản rút gọn của tài liệu. Xem và tải ngay bản đầy đủ của tài liệu tại đây (622.16 KB, 30 trang )
Flow-Through Chronopotentiometry in Waste Water Analysis
79
techniques (Crompton, 1996). Mercury and mercury film electrodes have frequently been
used for sulphide determination. Mercury coated platinum microelectrode was employed
for in-situ determination of sulphides in water and sediment samples (Daniele et al., 2002).
Most of the above methods require the removal of sulphides from the interfering matrix
prior to the measurement either through precipitation or evaporation which makes the
procedures laborious and time consuming.
The presented procedure makes use of the formation of the negligibly soluble mercury
sulphide on the electrode surface from the alkaline sample during the deposition step. In the
next step the deposit is stripped into a slightly acidic electrolyte solution by applying a
constant negative current, whereas the potential of the porous electrode is measured and
evaluated. The main goal was to elaborate a simple, fast and reliable procedure not
demanding a pre-separation step.
The low solubility of some sulphides facilitates the electrochemical determination of
sulphides through stripping analysis by making use of an electrode material forming such a
sulphide. Mercury and silver electrodes offer the best performance. However, silver
electrodes, especially porous ones, have high background currents deteriorating their
applications for low sulphide contents. Mercury and mercury coated electrodes are more
suitable in this context, but are vulnerable to matrix interferences. It was found that the
mercury coated bare porous electrode operated properly with waste water samples few
hours only. Covering the surface with Nafion
®
prior to coating with mercury improved
significantly its performance. The same electrode could be used for several days virtually
without loss of the sensitivity. On deposition the cell is flushed with the carrier electrolyte
consisting of sodium sulphate and acetate buffer at a pH of about 4.8 and the deposit is
stripped through reducing the mercury sulphide to elemental mercury and hydrogen
sulphide, the latter is washed from the electrode during the rinsing step. Porous electrodes
possess a unique feature, absent in non-porous structures, namely there is a possibility to
strip and deposit the analyte many times in a stopped flow regime. This can be used for
signal accumulation in order to increase the signal to noise ratio (Beinrohr et al., 1994), or to
shift the signal to a potential range with lower background level. In the case of sulphides it
was found, that the background level is lower and signal reproducibility is higher if the
stripping is made in the so called deposition-stripping-deposition-stripping sequence. Here,
after deposition and rinsing with the carrier electrolyte the flow is stopped, the potential is
shifted to a negative value (-600 mV for 10 s) causing the stripping (reduction) of HgS to Hg
and HS
-
, as well as the complete reduction of dissolved oxygen in the solution in the pores
of the electrode. In the next step the potential is shifted again to a more positive value (0 mV
for 30 s) where the HgS deposit is formed repeatedly from the HS
-
ions in the electrode bulk.
In the last step, this deposit is stripped again into the same but now the oxygen-free
electrolyte by constant negative current and the stripping chronopotentiogram is measured.
Owing to such in-situ reduction of oxygen there is no need for its preliminary removal,
which makes the procedure simple and straightforward (
a
Manova et al., 2007).
The deposition potential influences significantly the signal response. Below –500 mV and
above 100 mV no stripping signal was observed, the highest sensitivity was observed in the
potential window of –350 mV to –50 mV. At potentials more negative than –500 mV no
mercury sulphides is formed, at potentials above –50 mV sulphide is probably oxidised to
sulphur, hence, no mercury sulphide is formed again.
For a sample volume of 1 mL taken for preconcentration the response is linear up to about
400-500
μg/L (regression data: slope 0.0095, intercept 0.017, correlation coefficient 0.9994)
Waste Water - Evaluation and Management
80
with a limit of detection and quantification (Mocak et al., 1997) of 1.6 μg/L and 5 μg/L,
respectively. At a sample volume of 5 mL the detection limit was found to be about 0.5
μg/L.
The repeatability and reproducibility were evaluated from data obtained in a short
measurement sequence of 15 analyses, and by repeating the measurement daily with a fresh
sulphide solution of the same concentration (200
μg/L) during ten days, respectively.
Hence, the repeatability and reproducibility were found to be 2.6 % and 4.8 %, respectively.
Owing to the large electrode surface, stripping current larger than –200
μA should be used.
The measurement time at lower currents is longer than 5 min. The current of –500
μA
ensured the best signal to noise ratio and fast measurement.
The waste water samples from a tannery contained dispersed colloidal substances and
solids, so the key question was whether the sample preparation procedure (see
Experimental) would ensure repeatable results. Sample volumes of 50
μL and 100 μL from
the sedimented sample were pipetted to the 0.1 mol/L NaOH solution and analysed. The
relative standard deviation of the results for these volumes was found to be 5.8 % and 2.4 %,
respectively. Hence, the repeatability did not differed significantly from that for
homogenous sulphide solutions. A typical signal of a diluted waste water sample is
depicted in Fig. 3.
A possible interferent commonly present in waste waters from tanneries is sulphite. It was
found that a 1000-fold excess of sulphites do not influence the signal of sulphide at all, and a
5000-fold excess causes a 8 % drop of the signal only.
The elaborated procedure was used for analyses of waste water samples taken from
different locations of a tannery (Tab. 2). In most cases satisfactory agreement was found
between the results obtained by the proposed procedure and the control method. However,
in samples No 3 and No 6 the chronopotentiometric method provided much lower sulphide
content than the control method. Theses samples spiked with known amounts of sulphides
gave recoveries of the spikes near 100 %. Hence, the sample matrix virtually did not
interfere. These samples, diluted with NaOH, were then heated in a microwave oven to a
temperature of 80-95
o
C and on cooling analysed again. The results obtained in such a way
were significantly higher and correlated well with the control measurement (Tab. 2).
Fig. 3. Stripping signal of a real sample from a tannery containing 85 mg/L sulphide (50
μL
of the sample diluted to 50 mL) (
a
Manova et al., 2007)
Flow-Through Chronopotentiometry in Waste Water Analysis
81
Sample Laboratory A
mg/L
Laboratory B
mg/L
Control analysis
mg/L
1
107.6
± 4.6 95.1 ± 6.1
99.1
± 7.2
a
97.3
± 7.8
2
84.8
± 10.8 89.3 ± 13.3
81.8
± 9.2
a
76.1
± 6.3
3
1.5
± 0.3 3.5 ± 1.3
28.2
± 1.8
a
27.5
± 2.7
4
25.8
± 3.2 21.1 ± 3.5
20.9
± 2.9
a
28.5
± 2.8
5
3.5
± 0.4 3.9 ± 0.5
4.1
± 0.6
a
4.7
± 0.6
6
3.0
± 0.5 2.9 ± 0.3
17.5
± 1.5
a
16.5
± 1.7
7
15.8
± 2.4 17.8 ± 2.5
18.9
± 3.5
a
18.5 ± 1.9
8
86.0
± 1.7 85.6 ± 2.0
88.2
± 2.5
a
91.3
± 7.4
9
4.3
± 1.8 3.0 ± 0.7
3.3
± 1.1
a
3.15
± 0.42
Table 2. Analyses of waste water samples from a tannery.
a
Sample heated prior to analysis
(
a
Manova et al., 2007)
For the other samples, a heating did not influenced significantly the result. A plausible
explanation is that the reference method evaluates also such sulphide species in some
samples, which are not dissolved in the sodium hydroxide solution at laboratory
temperatures.
4. Trace lead in waste waters
Electrochemical stripping techniques have been proved to be the most sensitive methods for
some electroactive elements such as lead, cadmium, mercury and some others. In these
techniques, the trace elements are deposited on a suitable electrode and then are stripped
either potentiostatically, galvanostatically or chemically. The galvanostatic stripping
(galvanostatic stripping chronopotentiometry) exerts some special features making this
technique more suitable for routine use. The electronic control is simpler compared to
voltammetric systems and the signal resolution is better due to smaller peak widths.
However, the overlapping chronopotentiometric signals are not additive making signal
deconvolution known in voltammetry virtually impossible.
Stripping analysis with matrix exchange can easily be performed by making use of a flow-
through electrochemical cell (Bard & Faulkner, 2001; Stulik & Pacakova, 1987). Moreover,
porous flow-through working electrodes may open the way to achieve complete
electrochemical conversions both during the deposition and the stripping steps and hence to
provide calibrationless analysis just by making use of the combined Faraday's laws for
signal evaluation (Blaedel & Wang, 1979; Curran & Tougas, 1984). An alternative way to
provide calibrationeless determination in stripping analysis is to deposit completely the
Waste Water - Evaluation and Management
82
analyte from a small sample volume to a vibrating working electrode (Jagner & Wang, 1995;
Jagner et al., 1996).
Flow-through porous electrodes with pore size comparable to diffusion layer thickness
possess some special advantages: high electrochemical yields, virtually up to 100 %, fast
electrolysis in the electrode bulk, signal accumulation through repeated deposition-
stripping cycles inside the electrode (Beinrohr et al., 1994), and direct coulometric titration in
the pores of the electrode. However, owing to the large electrode surface, capacitive currents
would deteriorate the measurement of low Faradayic currents. To compensate for this,
electrode materials with low inherent background currents should be used and the
background signal should be subtracted from the total signal.
Assuming an exhaustive deposition of the analyte at the working electrode during the
deposition step, the transition time
τ corresponding to the dissolution of the deposit during
the stripping step is given by the Faraday’s laws of electrolysis. Provided that the
dissolution is done completely by the applied current, Eq. 1 and Eq. 2 can serve to calculate
the analyte concentration directly from the analytical signal
τ, i.e. the method is in principle
calibrationless.
Trace concentrations of lead have usually been determined by AAS preferably making use
of electrothermal atomisation. Lead can also be determined by electrochemical methods
such as stripping voltammetry (Wang, 1985) and stripping chronopotentiometry. These
methods exert excellent sensitivity, even better than GF AAS, robustness a low costs.
Lead can easily and virtually completely be deposited on mercury coated porous glassy
carbon electrode (
b
Beinrohr et al., 1992). The lifetime of the mercury coating enhances
significantly by pre-coating of the carbon surface by a thin layer of Nafion, which,
additionally, makes the electrode surface more resistive against interfering organics. The
lifetime of an electrode surface coated in such a way is at least one day and up to 100
measurements could be performed with the same coating.
The deposition of lead can be done either at a constant deposition potential or by using a
constant deposition current. The former offers more selectivity the latter enhances
robustness especially when analysing samples with significantly different matrices. Since
the treated samples were similar in matrices, the potentiostatic pre-concentration mode was
used in these experiments.
The sensitivity of the measurement is governed by two principal parameters: i) sample
volume taken for analysis, and ii) stripping current. Obviously, the sensitivity increases by
enhancing the sample volume and/or by decreasing the stripping current. The lowest
sample volume taken for deposition is limited by an accepted precision of the sample
injection with the applied instrument and is usually 0.3 – 0.5 mL. The largest sample volume
is given by a reasonable duration of an analysis (5-10 min), hence being 5 – 15 mL. The
stripping should be in the range of 50 to 400
μA, 100 μA was used in further experiments.
In diluted nitric acid media, the deposition efficiency was significantly lower then 100 %.
Hence, the samples were acidified with hydrochloric acid, which ensures complete
depositions.
The flow system enables a simple adjustment of the sample volume taken to the analysis
and there is a possibility to match the parameters to samples with low and high lead
contents simply by setting an adequate sample volume. The linearity of the method was
evaluated by analysing a series of Pb solutions prepared in concentration range of 0.1 to
2000
μg/L. Obviously, the sample volume taken for pre-concentration should be matched to
the expected concentration range.
Flow-Through Chronopotentiometry in Waste Water Analysis
83
The limit of detection (LOD) and limit of quantification (LOQ) values were calculated from
the concentration dependence for the low concentration range (Fig. 4) and sample volume of
5 mL. The concentration dependence was evaluated by linear regression according to
IUPAC recommendations (Mocak et al., 1997). The LOD and LOQ values were found to be
0.07
μg/L and 0.22 μg/L, respectively.
0,0 0,2 0,4 0,6 0,8 1,0 1,2
0,0
0,1
0,2
0,3
0,4
0,5
0,6
0,7
0,8
0,9
1,0
1,1
1,2
Data
Linear Fit
Upper 99% Confidence Limit
Lower 99% Confidence Limit
signal
concentration μg.dm
-3
Signal = 0,02919 + 0,97342c
R
2
= 0,9956
Fig. 4. Assessment of LOD and LOQ values. Sample volume 5 mL. Other parameters are
listed in Tab. 1 (Strelec et al., 2007)
The repeatability and reproducibility were tested on the same standard solutions prepared
once and stored in a 1000 mL volumetric flask at laboratory temperature, dark. The
repeatability test was done with the same instrument by the same operator in a short
sequence. The reproducibility test was carried out by different operators and in a daily pace.
The repeatability and reproducibility for 11 measurements was found to be 1.1% and 3.7 %,
respectively.
The accuracy of the method was checked by analysis of a certified reference material CRM
12-3-10 (SMU Bratislava, Slovakia; certified value for Pb and uncertainty: 0.029 mg/L and
0.006 mg/L, resp.). The elaborated method gave a value of (0.030
± 0.001) mg/L.
Real water samples may contain various heavy metal ions, which could interfere. As Fig. 5
implies, only Cd affects the signal of lead, and that at concentration ratios higher than 1:50
(Pb:Cd), presumably owing to a coalescence of their signals (Fig. 6). The other tested species,
Cu, As, Zn, Hg, Bi virtually do not interfere. Sn can only interfere in more concentrated
hydrochloric acid solutions (over 0.5 mol/L), in the 0.1 mol/L HCl solutions used here its
deposition is negligible.
The elaborated procedure was used for analyses of water samples from a water treatment
plant of a galvaniser. The results are collected in Tab. 3 together with control data obtained
by GF AAS. Notwithstanding the complex character of the sample matrix (salts, organics,
sulphides, etc.), a reasonable correlation between the chronopotentiometric and AAS data
was observed. The lower value found by chronopotentiometry in the sample No 3 may be
attributed to the high concentration of complexing agents in this sample. This can partially
be assigned to the high Pb contents in the samples enabling a higher dilution of the sample,
which, favourably, minimises possible matrix interferences owing to the dilution of the
matrix.
Waste Water - Evaluation and Management
84
1:1
1:2
1:5
1:10
1:20
1:50
1:100
Cd
As
Bi
Cu
Sb
0
10
20
30
40
50
60
70
80
90
100
Recovery (%)
ratio
Cd
As
Bi
Cu
Sb
Fig. 5. Influence of some metal ions on the found values of Pb. Sample volume 5 mL, lead
concentration 5
μg/L (Strelec et al., 2007)
Fig. 6. Stripping chronopotentiogram of Pb (lower peak on the right) in the presence of an
excess of Cd (left). Sample volume 5 mL, Pb and Cd concentrations 5
μg/L and 50 μg/L,
resp. (Strelec et al., 2007)
Sample
No
Chronopotentiometry
mg/L
GF AAS
mg/L
1
1.79
± 0.03 1.75 ± 0.06
2
0.991
± 0.011 0.989 ± 0.021
3
0.099
± 0.005 0.118 ± 0.012
4
0.767
± 0.012 0.794 ± 0.030
5
0.656
± 0.025 0.661 ± 0.030
6
14.9
± 0.2 14.7 ± 0.3
Table 3. Analysis of the waste water samples by flow-through chronopotentiometry and GF
AAS. Results obtained from 5 repeated measurements (Strelec et al., 2007)
Flow-Through Chronopotentiometry in Waste Water Analysis
85
5. Chromium in water samples
Chromium is one of the most abundant elements on Earth. The amount of chromium in the
environment has gradually been increased predominantly by industrial activities especially
from tanneries, mines and incinerators. The toxicity of Cr(VI) to living organisms is well
known and therefore a considerable interest has developed in its determination in
environmental and industrial sites.
Chromium(VI) is usually determined by UV-VIS spectrophotometry by means of
diphenylcarbazide in acidic solutions (Rudel & Terytze, 1999). Atomic absorption
spectrometry with electrothermal atomisation (GF AAS) is one of the most sensitive
methods for chromium determination in aquatic samples. Unfortunately, a direct
measurement of Cr(VI) is not feasible with this and other atomic spectroscopic techniques. A
separation of Cr species prior to the measurement is therefore inevitable either by means of
a minicolumn (Cespon-Romero et al., 1996; Rao et al., 1998) or HPLC (Allen & Koropchak,
1993; Lintschinger et al., 1995; Andrle et al., 1997; Luo & Berndt, 1998). The procedure can be
simplified by making use of a flow cell coupled in-line to a flame AAS instrument (Beinrohr
et al., 1996), consisting of a porous electrode for oxidising Cr(III) to Cr(VI) and a sorbent for
trapping Cr(VI). Cr(VI) is collected without electrolysis and on elution measured by AAS.
Total Cr is measured after oxidising Cr(III) electrochemically to Cr(VI) which is collected
together with the original Cr(VI) in the sorbent and then measured.
Electrochemical methods provide a simple tool for direct speciation of chromium. The most
commonly used technique is based on adsorptive accumulation of the product of the
reaction between Cr(VI) and diethyltriaminepentaacetic acid (DTPA) on the hanging
mercury drop electrode. The adsorbed deposit is then cathodically stripped, mostly in the
presence of nitrate giving rise to an intense catalytic current (Golimowski et al., 1985). Only
Cr(VI) species give this product which enables the selective determination of chromate also
in the presence of Cr(III). To bypass the use of the toxic mercury electrode, bismuth-film
electrodes have recently been used (Chatzitheodorou et al., 2004; Lin et al., 2005).
In-electrode coulometric titrations facilitate the direct determination of Cr(VI) in water
samples. The method makes use of a direct electrochemical reduction of chromate ions to
Cr(III) in a porous glassy carbon electrode by constant current according to the electrode
reaction given below:
23
42
CrO 8 H Cr 4 H O – 3 e
−
++ −
+=+ (3)
The potential of the electrode is monitored during the reduction indicating the end of the
coulometric titration. The influences of experimental parameters, metrological figures and
possible interferences will be investigated.
A new porous electrode exhibited low sensitivity which enhanced and stabilised gradually
after few measurements of Cr(VI) samples. To avoid this initialisation period, the electrode
was flushed with a Cr(VI) solution first and then the electrode was used for analyses. The
lifetime of the electrode was limited by clogging the pores with solids and/or by a gradual
and irreversible increase of the background signal due to a slow oxidation of the electrode
surface. When an in-line filter was used to minimise electrode clogging, an average lifetime
of an electrode was found to be at least three days, or several hundreds of measurements.
The value of the current forced to the electrode during a chronopotentiometric experiment
affects significantly the sensitivity of the signal. In general, the lower the current the higher
Waste Water - Evaluation and Management
86
is the sensitivity, but the signal to background ratio is virtually not influenced. Theoretically,
in a porous electrode with pore diameters near to the diffusion layer thickness an exhaustive
electrolysis proceeds, the electrical charge consumed for the electrochemical change is given
by the amount of the electrolysed species inside the pores of the electrode. The electrical
charge consumed for the reduction of chromate is virtually independent on the value of the
current used in the range of -10 to -1000
μA, being at the level of 40 μC and the function can
be described by y = 0.0004x + 39.454 (R
2
= 0.081). However, the noise level enhances
significantly at currents larger than -200
μA. Owing to the ohmic resistance of the solutions,
the reduction peak is shifted to more negative potentials when enhancing the reduction
current. At currents smaller than -10
μA the duration of a single measurement may exceed 5
– 10 min. Hence, reduction currents of –50 to -100
μA were used in further experiment
ensuring low noise level and short measurement times.
The electrochemical reduction of chromate proceeds in acidic solutions. Nitric acid interferes
(see below), in sulphuric acid media the reduction of frequently present Fe(III) totally
coalesces with that for Cr(VI). Hence, hydrochloric acid was chosen as electrolyte for the
reduction. Its content influences the peak position and especially the peak area. However,
the sensitivity of the signal is not significantly improved at HCl concentrations above 0.2
mol/L, so such a concentration was used in further work.
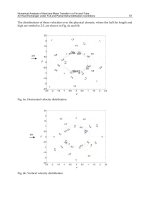
The concentration range was tested up to several mg/L of Cr(VI) (Fig. 7). The response was
found linear up to 500
μg/L. The lower concentration range was used for estimation of
limits of detection and quantification (Table 4). The repeatability of the measurement was
calculated from 10 measurements of Cr(VI) solutions with different concentrations in a short
sequence. For reproducibility assessment, solutions the same concentrations were analysed
in an interval of ten days.
Fig. 7. Concentration dependence of the chromium signal. Reduction current –50
μA (
b
Manova et al., 2007)
Numerous substances may interfere in the reduction of chromate including species, which
can be reduced at similar potentials, species adsorbing at the electrode surface or substances
which would reduce chromate chemically prior to the measurement.
The influence of humic acids proved to be significant at contents higher than 0.5 – 1 mg/L
(Fig. 8). The Cr(VI) signal decreases with increasing humic acid concentration which can be
accounted for by chemical reduction of chromate to Cr(III) by humic substances in the acidic
Flow-Through Chronopotentiometry in Waste Water Analysis
87
Parameter Value
Detection limit
1.9
μg/L
Limit of determination
6.0
μg/L
Linear range
(5 – 500)
μg/L
Repeatability at 10 μg/L
5.9 %
100 μg/L
1.2 %
500 μg/L
0.6 %
Reproducibility at 10 μg/L
8.8 %
100 μg/L
1.8, %
500 μg/L
0.8, %
Measurement duration 3 min
Table 4. Analytical figures of merit for chromium determination (
b
Manova et al., 2007)
solution. As a proof of it, measurement of total Cr in the same sample solution gave the
added content of Cr in the sample.
Iron(III), a common species in water samples interferes owing to its reduction at similar
potentials as Cr(VI). This interference can partially be suppressed by addition of EDTA to
the sample which forms a more stable complex with Fe(III) than that with Fe(II), shifting the
reduction peak of Fe(III) to more negative potentials. The reduction peak of Cr(VI) is
virtually not influenced by EDTA. The higher the EDTA concentration the larger is the shift
of the Fe peak.
Fig. 8. Influence of humic acids (HA), Fe(III) and Mn(II) on the recovery of Cr(VI). Cr(VI)
concentration 100
μg/L (
b
Manova et al., 2007)
Unfortunately, the concentration of EDTA is limited by its solubility in acidic solutions, here
at concentrations above 0.001 mol/L, a white precipitate of EDTA was formed in the
solutions after several hours. Nevertheless, in this way, Fe(III) concentrations up to 500 –
1000
μg/L can be tolerated. The interfering effect of higher Fe(III) concentrations can only be
minimised by removing Fe(III) from the original sample, e.g. by making use of cation
exchanger. Calcium and magnesium ions do not interfere.
Sulphate ions do not interfere. On the contrary, the signal of Cr(VI) decreased significantly
with increasing concentration of nitrate ions or nitric acid above 0.1 mol/L. This can be
Waste Water - Evaluation and Management
88
assigned to a partial electrochemical reduction of nitric acid being in large excess which
coalesces with the reduction peak of Cr(VI).
The influence of the tested surfactants is totally different. The neutral Triton X-100 virtually
exerts no influence on the signal. Moreover, its addition to the solutions improves the
reproducibility owing to easier removal of air bubbles from the flow system. The anionic
sodium dodecylsulphate decreases the Cr(VI) signal already at concentrations above
3-5 mg/L. Sorption of the anionic surfactant on the positively charged electrode surface may
be a plausible explanation. On the contrary, the cationic Hyamine enhances the signal
significantly. In the presence of Hyamine is the coulombic content of the reduction peak
much higher than expected from the Cr(VI) content in the porous electrode, so a sorption of
Cr(VI) during the filling of the electrode with the sample seems to occur. However, the
explanation of this phenomenon would need further investigation.
Total Cr can only be assessed with this method after oxidising Cr(III) to Cr(VI) and measuring
it with the above procedure. The oxidation of Cr(III) with hydrogen peroxide in alkaline
solution is simple and fast. However, on acidifying the resulting solution the formed Cr(VI) is
immediately reduced back by the excess of hydrogen peroxide remaining in the solution after
oxidation. Oxidation with K
2
S
2
O
8
in acidic media produced Cr(VI) as well but the excess
persulphate interfered in the Cr(VI) measurement giving an intense reduction peak completely
obscuring the Cr signal. The only applicable procedure found was the oxidation with
permanganate in solutions acidified with HCl. The procedure is simple but time consuming
owing to the need of a long boiling of the reaction mixture. The excess of permanganate is
automatically removed by addition of EDTA after completing the oxidation.
The completeness of the oxidation and recovery were checked by means of synthetic
samples in the concentration range of 10 to 500
μg dm
-3
, as well as by means of real water
samples spiked with known amounts of Cr. Satisfactory recoveries (90-110 %) were achieved
in all cases.
Tap water, mineral water and river water samples were analysed by the elaborated
procedure. The accuracy for total Cr content was checked by GF AAS measurements (Table
5). No values above the detection limit of the methods were found in these samples so the
samples were spiked with Cr(VI) and Cr(III) for recovery tests. Recoveries about 100 % were
obtained in all cases.
Sample Cr(VI) found
μ
g/L
Total Cr found
μ
g/L
Spike recovery
%
Total Cr
a
μ
g/L
Tap water < 1.9 < 1.9 < 0.8
+ 50μg/L Cr(VI)
49.6 ± 1.9 99.2 46.7 ± 3.1
+ 50μg/L Cr(III)
< 1.9 49.8 ± 2.0 99.6
Mineral water
b
< 1.9 < 1.9 < 0.8
+50μg/L Cr(VI)
48.5 ± 2.1 97.0 47.9 ± 3.8
+50μg/L Cr(III)
< 1.9 51.5 ± 2.2 103
River water
c
< 1.9 < 1.9 < 0.8
+ 50μg/L Cr(VI)
51.0 ± 2.4 102 48.3 ± 4.1
+ 50μg/L Cr(III)
< 1.9 48.6 ± 2.8 97.2
Table 5. Recovery test with water samples. a Found by GF AAS; b Mineral water “Miticka
ticha” (Slovakia); c River L
′ Arve at Geneve, Switzerland (b Manova et al., 2007)
Flow-Through Chronopotentiometry in Waste Water Analysis
89
6. Conclusions
The stripping chronopotentiometric determination of sulphides provided reliable results for
waste water samples from a tannery. The sample preparation is simple, even if in some
cases the prepared sample should be heated prior to the measurement to obtain values
corresponding with the control method. There is no need for a pre-separation step such as in
titrimetric and photometric methods. The automatic on-line matrix exchange in the flow
system after deposition minimises possible interferences from the sample matrix making
this technique advantageous over the static batch ones. In general, the presented procedure
allows the measurement of sulphide compounds, which form soluble sulphide in alkaline
solution. It is evident, that different sample preparation procedures, e.g. boiling with
mineral acids and distillation, may address some sulphide species not measured by this
technique. The main advantages of the elaborated procedure are the simple sample
preparation, no interference from dissolved oxygen and sample matrix, low detection limit,
fast and full automatic measurement.
The determination of lead by flow-through chronopotentiometry proved to be a simple,
sensitive, and accurate method for waste water analysis. The measurement, including
sample preparation is fast, an average measurement cycle does not exceed 3-6 min. Due to
the broad linear concentration range and low detection limit the method can successfully
deal with samples with different lead concentrations.
The in-electrode coulometric titration of Cr(VI) in porous electrodes proved to deliver
reproducible and accurate results in a concentration range of about 5 to 500
μg/L. Owing
to the preconcentration effect the detection limits of the adsorptive stripping methods are
much lower (Table 1) but the presented procedure offers some significant advantages. The
limit of detection enables to use the method for assessment of chromium content in
drinking water below the threshold value (50
μg/L). The sample preparation for Cr(VI)
determination is simple and fast and dissolved oxygen need not to be removed. Owing to
the long lifetime of the porous carbon electrode, the procedure is also suitable for field
applications and long-term unattended measurements, e.g. in process systems. Compared
to photometric methods for Cr(VI), coloured species do not interfere. However, total Cr
can only be assessed after a chemical oxidation of Cr(III) to chromate. Colloidal and solid
particles in the solutions may clog the pores of the electrode and therefore must be
removed. High contents of organic substances in some waste waters may interfere and the
elimination of such interferences is the main goal in the improvement of the presented
procedure.
The intrinsic simplicity of chronopotentiometric measurements, especially in flow-through
mode has made this method a suitable tool for routine and on-line control of
electrochemically active species in environment, waste water treatment and chemical
technologies. Heavy metals, some anions and simple compounds can be targeted by the
technique. Obviously, the direct contact of the sensor (electrode) with the sample may be a
source of various interferences not only due to possible presence of electrochemically similar
species but predominantly due to electrode failure caused by sorption and deposition of
matrix components on the electrode surface. Yet, proper sample pre-treatment and adequate
experimental parameters minimize or even completely eliminate these effects. As a
consequence, this measurement principle is becoming preferred now predominantly in
industrial applications for unattended on-line monitoring purposes.
Waste Water - Evaluation and Management
90
7. Acknowledgement
The author appreciates the financial support of the Slovak Grant Agency VEGA (Project No
1/0500/08).
8. References
Allen L. B. & Koropchak J. A. (1993). Comparison of the effects of extra-column aerosol and
liquid-phase volumes on high-performance liquid chromatographic separations
with inductively-coupled plasma detection.
J. Chromatogr. A, 657, 192-198, ISSN
0021-9673
Andrle C. M., Jakubowski N. & Broekaert J. A. C. (1997). Speciation of chromium using
reversed phase-high performance liquid chromatography coupled to different
spectrometric detection methods.
Spectrochim. Acta Part B, 52, 189-200, ISSN 0584-
8547
Bard, A. J. & Faulkner, L. R. (2001).
Electrochemical Methods. Fundamentals and Applications,
2nd Ed.,
Wiley, ISBN 0-471-04372-9, New York
a
Beinrohr E., Nemeth M., Tschöpel P. & Tölg G. (1992). Design and characterization of flow-
through coulometric cells with porous electrodes made of crushed vitreous carbon.
Fresenius J. Anal. Chem., 343, 566- 575, ISSN 0937-0633
b
Beinrohr E., Nemeth M., Tschöpel P. & Tölg G. (1992). Anodic stripping coulometry with
collection for absolute trace analysis of lead, using flow-through electrochemical
cells with porous working electrodes.
Fresenius J. Anal. Chem., 344, 93-99, ISSN 0937-
0633
Beinrohr E., Csemi P., Manova A. & Dzurov J. (1994). Absolute analysis of trace metals
through galvanostatic stripping chronopotentiometry with signal accumulation.
Fresenius Z. Anal. Chem., 349, 625-632, ISSN 0937-0633
Beinrohr E., Manová A. & Dzurov J. (1996). Preconcentration of Cr(III) and total Cr in waters
for flame AAS in a flow-through electrochemical/sorption cell.
Fresenius J. Anal.
Chem., 355, 528-531, ISSN 0937-0633
Beinrohr E. (2001).
Flow-through coulometry as a calibrationless method in inorganic trace
analysis.
Accred. Qual. Assur., 6, 321-324, ISSN 0949-1775
Blaedel, W.J. & Wang, J. (1979). Anodic stripping voltammetry at a reticulated mercury
vitreous carbon electrode.
Anal. Chem., 51, 1724-1728, ISSN 0003-2700
Blaedel W. J. & Wang J. (1980). Characteristics of a rotated porous flow-through electrode.
Anal. Chem., 52, 1697–1700, ISSN 0003-2700
Cespon-Romero R. M., Yebra-Biurrun M. C. & Bermejo-Barrera M. P. (1996).
Preconcentration and speciation of chromium by the determination of total
chromium and chromium(III) in natural waters by flame atomic absorption
spectrometry with a chelating ion-exchange flow injection system.
Anal. Chim. Acta,
327, 37-45 , ISSN 0003-2670
Chatzitheodorou E., Economou A. & Voulgaropoulos A. (2004). Trace determination of
chromium by square-wave adsorptive stripping voltammetry on bismuth film
electrodes.
Electroanalysis, 16, 1745-1754, ISSN 1521-4109
Crompton T.R. (1996).
Determination of Anions, Springer, ISBN 3-540-60162-7, Berlin
Flow-Through Chronopotentiometry in Waste Water Analysis
91
Curran D. J. & Tougas T. P. (1984). Electrochemical detector based on a reticulated vitreous
carbon working electrode for liquid chromatography and flow injection analysis.
Anal. Chem., 56, 672-678, ISSN 0003-2700
Daniele S., Baldo M. A. & Bragato C. (2002). In situ monitoring of electroactive species by
using voltammetry at microelectrodes,
J. Braz. Chem. Soc., 13 , 425–432, ISSN 0103-
5053
Golimowski J., Valenta P. & Nurnberg H. W. (1985). Trace determination of chromium in
various water types by adsorption differential pulse voltammetry.
Fresenius Z. Anal.
Chem.,
322, 315-322, ISSN 0937-0633
Hu A., Dessy R. E. & Graneli A. (1983). Potentiometric stripping with matrix exchange
techniques in flow injection analysis of heavy metals in groundwaters.
Anal. Chem.,
55, 320-328, ISSN 0003-2700
Jagner, D. & Graneli A. (1976). Potentiometric stripping analysis.
Anal. Chim. Acta 83, 19-26,
ISSN 0003-2670
Jagner D. & Wang Y. D. (1995). Coulometric stripping potentiometry.
Electroanalysis, 7, 614-
618, ISSN 1521-4109
Jagner D., Wang Y. D. & Ma F. (1996). Automatic chemical current determination in
coulometric stripping potentiometry facilitating calibration-free trace metal
determinations.
Electroanalysis, 8, 862-869, ISSN 1521-4109
Lazar B., NishriA. & Ben-Yaakov S. (1981). Mutual interferences in the determination of
Zn(II) and Cu(II) in seawater by anodic stripping voltammetry.
J. Electroanal. Chem.,
125, 295-306, ISSN 0022-0728
Lin L., Lawrence N. S., Thongngamdee S., Wang J. & Lin Y. ( 2005). Catalytic adsorptive
stripping determination of trace chromium(VI) at the bismuth film electrode.
Talanta, 65, 144-148, ISSN 0039-9140
Lintschinger J., Kalcher K., Giossler W. & Novic M. (1995). Simultaneous determination of
chromium(III) and chromium (VI) by reversed-phase ion-pair HPLC with
chromium-specific detection.
Fresenius J. Anal. Chem., 351, 604-609, ISSN 0937-0633
Luo S. K. & Berndt H. (1998). Cr(III)/Cr(VI) determination in waste water by ICP/AES with
on-line HPLC (HHPN) sample introduction.
Fresenius J. Anal. Chem., 360, 545-549 ,
ISSN 0937-0633
a
Manova A., Strelec M., Cacho F., Lehotay J. & Beinrohr E. (2007). Determination of
dissolved sulphides in waste water samples by flow-through stripping
chronopotentiometry with a macroporous mercury-film electrode.
Anal. Chim. Acta,
588, 16-19, ISSN 0003-2670
b
Manova A., Humenikova S., Strelec M. & Beinrohr E. (2007). Determination of
chromium(VI) and total chromium in water by in-electrode coulometric titration in
a porous glassy carbon electrode.
Microchim. Acta, 159, 41-47, ISSN 0026-3672
Mocak J., Bond A. M, Mitchell S., & Scollary G. (1997). A statistical overview of standard
(IUPAC and ACS) and new procedures for determining the limits of detection and
quantification: Application to voltammetric and stripping techniques (technical
report).
Pure Appl. Chem., 69, 297-328, ISSN 0033-4545
Nakata R., Okazakia S., Horia T.& Fujinaga T. (1983). Collection of trace metals from sea
water by column electrolysis for neutron activation—γ-spectrometry.
Anal. Chim.
Acta, 149, 67-75, ISSN 0003-2670
Waste Water - Evaluation and Management
92
Rao T. P., Karhikeyan S., Vijayalekshmy B. & Lyer C. S. P. (1998). Speciative determination
of chromium(VI) and chromium(III) using flow-injection on-line preconcentration
and flame atomic-absorption spectrometric detection.
Anal. Chim. Acta, 369, 69-77,
ISSN 0003-2670
Rudel R. & Terytze K. (1999). Determination of extractable chromium(VI) in soils using a
photometric method.
Chemosphere, 39, 697-708, ISSN 0045-6535
STN 83 0530-31 (1999).
Chemical and physical analysis of surface water. Determination of sulfides
and hydrogen sulfide,
SUTN, Bratislava
Strelec M., Cacho F., Manova A., Hlubikova S. & Beinrohr E. (2007). Calibrationless
determination of lead in waste water samples by flow-through stripping
chronopotentiometry.
Chem. Anal. (Warsaw), 52, 377-385, ISSN 0009-2223
Stulik K. & Pacakova V. (1987).
Electroanalytical Measurements in Flowing Liquids, Ellis
Horwood, ISBN 0-85312-945-2, Chichester
Thomsen K. N., Skov H. .J & Dam Mer (1994). A flexible instrument for voltammetry,
amperometry and stripping potentiometry.
Anal. Chim. Acta, 293, 1-17, ISSN 0003-
2670
5
The Chemical Oxygen Demand Modelling Based
on a Dynamic Structure Neural Network
Junfei Qiao, Qili Chen and Honggui Han
Beijing University of Technology,
China
1. Introduction
Wastewater treatment process aims at achieve the purpose of purification by degradation of
organic matter in water. To ensure the effluent water quality, some indicators should be
measured, including chemical oxygen demand (COD), Biochemical oxygen demand (BOD),
etc. Through the prediction on effluent indicators can provide effective guidance for the
operation of wastewater treatment plant.
Wastewater treatment process itself is a nonlinear, time-delay process with complex
reactions. Thus, when using traditional mathematical model there is often a lack of accuracy,
large amount of calculation and lack of flexibility in system simulation, while the prediction
based on neural network model can effectively eliminate these disadvantages because of its
learning mechanism. Nowadays, applying neural network in wastewater treatment process
has become a research hotpot, and some breakthroughs were achieved in terms of
algorithms or modelling.
zhu, et al. used MLP model to reduce the data dimension, then used the time-delay neural
network to predict the effluent BOD online. Chang, et al. reduced data dimension through
principal component analysis(PCA), then used extracted system inherent characteristics
from data by fuzzy C clustering, at last, TSK-type fuzzy inference system was used to
predict the effluent COD. Chai et al. proposed a activated sludge process mechanism model
based on hierarchical neural network, connecting the mechanism model and neural network
in cascade way and with the neural network identifying the reaction rate of nonlinear
components in activated sludge process model to predict the effluent COD.
The above evidences show that artificial neural networks can directly establish the model
according to the input / output data without prior knowledge of the condition object, and
has strong online correction ability. For the process with a large amount of data information
which can not be described by rules or formulas, the artificial neural network shows great
flexibility and adaptability which is ideal for wastewater treatment systems. However, these
network models have the same shortcomings that the network structure would no longer
able to modify after finalized in the early stage of designing. For the different cases of
wastewater treatment process, the re-design of neural network prediction model is
necessary. To solve this problem, meet the needs of the object by dynamically adjusting the
neural network structure is an available approach.
Huang et al. proposed a simple sequential learning algorithm called the “RBF growing and
pruning algorithm” (GAP-RBF), which was later developed into the GGAP-RBF algorithm.
Waste Water - Evaluation and Management
94
The GAP-RBF and GGAP-RBF methods use the “significance” of a hidden node to decide
whether to add new nodes or reduce the number of redundant nodes. The “significance” of
the node is also linked to the learning accuracy. However, since these algorithms are on-line
procedures, they do not optimize the network over all past training data. Moreover,
network initialization of the GAP-RBF algorithm requires a priori knowledge of the data
which may not be available.
This chapter presented a repair algorithm for the design of a Radial Basis Function (RBF)
neural network. The proposed repair RBF (RRBF) algorithm starts from a single prototype
randomly initialized in the feature space. The algorithm has two main phases: an
architecture learning phase and a parameter adjustment phase. The architecture learning
phase uses a repair strategy based on a sensitivity analysis (SA) of the network’s output to
judge when and where hidden nodes should be added to the network. New nodes are
added to repair the architecture when the prototype does not meet the requirements. The
parameter adjustment phase uses an adjustment strategy where the capabilities of the
network are improved by modifying all the weights. The algorithm is shown to be effective
by approximating a non-linear function, so it is used to model the key parameter, chemical
oxygen demand (COD) in the waste water treatment process. The results of simulation show
that the algorithm provides an efficient solution to problems.
The chapter is organized as follows. Section2 introduces the methods and problems of the
modelling the key parameter, chemical oxygen demand (COD) in the waste water treatment
process, and gives the methods of measuring COD. Section3 gives a short description of the
RBF neural network and the SA output model; briefly analyses the repair method which is
used to add hidden nodes and describes the algorithm which adjusts the parameters; the
proposed method is benchmarked against some well-known dynamic RBF algorithms. In
order to demonstrate the superior performance of the proposed RRBF neural network, the
algorithm is applied to approximating a nonlinear function. Section4 finishes the Soft
measurement technique for COD in the waste water treatment process. The conclusion and
Future work are given in Sec. 5.
2. Wastewater treatment process
2.1 The problem in COD measurement
Wastewater treatment plants are complex nonlinear systems, subject to large disturbances,
where different physical (such as settling) and biological phenomena are taking place. Many
models have been proposed in the literature for wastewater treatment process but their
evaluation and comparison are difficult. To ensure the good condition and effluent quality
during wastewater treatment operation process, the key parameters should be obtained in
time. On the one hand, wastewater treatment aims on reducing the environmental pollution,
which requires detecting the effluent COD, BOD, TN, TP etc. according to related national
effluent standard; on the other hand, the normal operation and control implementation of
each wastewater treatment link depends on real-time detection of controlled variables.
Among these effluent parameters, COD, which indirectly represents the water organic
pollution degree by DO consumption through microbiology metabolism, is an important
index accords with the practical self-purification situation and the routes of most
wastewater treatment processes. Therefore, the detection of COD is significant while some
The Chemical Oxygen Demand Modelling Based on a Dynamic Structure Neural Network
95
inevitable defects exist by using conventional approaches like COD on-line analyzer: the
process of COD is complicated, the time spent on detecting will greatly lags to the operating
time in practice and the results can't reflect the real situation in time [1]; COD on-line
analyzer is too expensive to extend. Thus, as a cost-effective tool for replacing expensive on-
line sensor, the research on soft-sensing became active since 1990s. Combining soft-sensing
with neural network to predict key parameters and guide, neural networks are wildly
applied in process modelling and prediction. Chang, et al. reduced data dimension through
principal component analysis(PCA), then used extracted system inherent characteristics
from data by fuzzy C clustering, at last, TSK-type fuzzy inference system was used to
predict the effluent COD. In this section, the soft-sensing technology applied in wastewater
treatment process will be introduced.
2.2 Soft-sensing technology
Soft sensors have been reported to supplement online instrument measurements for process
monitoring and control. Both model-based and data-driven soft sensors have been
developed (B. Lin et al., 2007). As solution for the above problems, the core of soft-sensing is
mathematical modelling for the objects. To obtain optimal estimation for primary variables
and set up a soft-sensing model which is suitable for wastewater treatment process,
selecting appropriate instrumental variables according to wastewater treatment
characteristics is a must. Principal component analysis can reduce the dimension and
correlation of process variables (W. Ran et al., 2004), data preprocessing can obtain the
correct data. So the design steps for soft-sensing are as follows:
a. Data preprocessing
Influenced by precision and reliability of measuring instrument and measuring
environment, the measuring errors are inevitable. Firstly, the ones with different magnitude
from others were deleted. Then the measuring samples should be handled by data
normalization using the following:
*
ij j
ij
jj
pp
p
s
−
= (1)
Where i is the number of samples, j is the component of samples,
ij
p
is the j th component of
the i th sample,
j
p
is the mean of the j th component of the samples,
jj
S
is the standard error
of the variable
j
p .
b. Principal component analysis
Wastewater treatment process is complicated, contains many variables. And there exists
quite linear correlation among those measuring variables and data.
Create a matrix
12
[, , , ]
m
ppp p
=
" , which composed of process variables and divided by
columns, to calculate its covariance matrix S. The characteristic roots of S are listed
as
12
0
m
λ
λλ
≥≥ ≥" , of which the corresponding unit orthogonal Eigenvectors are
composed of matrix
12
[, , , ]
m
LLL L
=
" (Load Matrix) Dividing x into the exterior product of
principal components’ sub-matrix T and Load Matrix
L
, added residual term E, as follows:
11 22
TTT T
nn
xTL ETL TL TL E
=
+= + +⋅⋅⋅+ +
Waste Water - Evaluation and Management
96
Then calculate
m (minimum required number of principal components) which make
cumulative variance contribution rate
11
/90%
nm
ij
ij
ηλλ
==
=>
∑∑
, select relevant n principal
components in T. Under the precondition
90%
η
>
, four instrumental variables which
mostly influenced effluent COD were chosen by analyzing the relation between principal
components and instrumental variables, they are SS, pH, oil and NH
3
-N.
c. Establishment of soft-sensing model
The well-known mathematical modelling and neural networks methods have limitations to
incorporate the key process characteristics at the wastewater treatment plants which are
complex, non-stationary, temporal correlation, and nonlinear systems (M. H. Kim et al.,
2009). To build soft-sensing model of key water quality parameters, some systematic
methods of neural networks modelling. Wang, W. (W. Wang & M. Ren, 2002) used BP
neural network to predict BOD and COD etc. key parameters by modelling wastewater
process; Guclu, D (D. Guclu & S. Dursun, 2008) used an artificial neural network to
implement the prediction of effluent COD concentrations. The common characteristic of
these techniques is that the feed forward neural network was used to model the wastewater
treatment process (J. B. Zhu et al., 1998). Used MLP model to reduce the data dimension,
then used the time-delay neural network to predict the effluent BOD online. Chai et al. (T.Y.
Chai et al., 2009) proposed a activated sludge process mechanism model based on
hierarchical neural network, connecting the mechanism model and neural network in
cascade way and with the neural network identifying the reaction rate of nonlinear
components in activated sludge process model to predict the effluent COD. Chen et al. (Q. L.
Chen et al., 2010) proposed a recurrent neural network model to identifying the BOD by
modelling wastewater process.
Researches show that artificial neural network is able to model the wastewater treatment
process. However, wastewater treatment process is a highly nonlinear and state-varying
dynamic process; the network’s dynamic performance will vary according to different
network structure because of the single and immutable mapping ability of fixed-structure
neural network. Therefore, a self-constructing neural network (J. F. Qiao & H. G. Hang,
2010) which combined RBF neural networks and principal component analysis technology
will be presented in section 3. The result of principal component analysis efficiently
included in the key modelling information of the wastewater treatment process. The above
four variables are used as the input of RBF model while effluent COD as the output, then we
choose the proper number of neurons in the hidden layer and train the network by learning
algorithm. This neural network would adjust network structure according to the complexity
of wastewater treatment process, which would significantly improve the soft sensor’s
performance.
3. A Self-constructing RBF neural network
This section will introduce a self-constructing RBF neural network which based on a repair
algorithm. Cell replacement therapy is emerging as a novel method for restoration of the
defective tissues by repairing the inactive cells. This innovative strategy has attracted
considerable attention to the human embryonic stem cell recently (Mathur A et al., 2004).
Similarly, it is well known that the connecting cells of the biological networks are repaired in
the neural systems (Noriaki Suetake & Eiji Uchino, 2007). A Radial Basis Function (RBF)
The Chemical Oxygen Demand Modelling Based on a Dynamic Structure Neural Network
97
neural network is a simple neural system model, which is often applied to machine learning
problems, because it can approximate non-linear mappings directly from input patterns (S.S.
Panda et al., 2008; Xabier Barandiaran & Alvaro Moreno, 2008). In theory, all RBF network
topologies should be able to learn any given task to some level of competency. In reality,
however, a given topology can be both a bottleneck and a constraint on a system. If the size
of the network is chosen incorrectly it becomes moribund, rendering the results meaning
less (A. Esposito et al., 2000; Wang, X. X. et al., 2004). Consequently a lot of research has
focused on the difficult problem of determining the optimal size of a RBF neural network (S.
Chen et al., 1991 & 1996). The size of the input and output layers in a RBF neural network is
fixed − only the size of the hidden layer can be modified. Two main methods, “growing“
and “pruning“, have been developed to dynamically change the size of a network. Esposito
et al. (A. Esposito et al., 2000) have proposed a growing method based on an evolutionary
optimization strategy. However, this method has a number of drawbacks: it requires a large
amount of processing power; the convergence time is very long, and the convergence is
sometimes premature. To reduce the amount of computational time an a priori clustering
method has been proposed (X. X. Wang et al., 2004). Unfortunately the proposed algorithm
is intrinsically flawed limiting its usefulness (N. Y. Liang&G. B. Huang, 2008). Orr (M. J. L.
Orr, 1995) has proposed a regularized forward selection (RFS) algorithm, based on subset
selection (S. Chen et al., 1996), which combines forward subset selection and zero-order
regularization. However, the subset selection method has several major disadvantages, the
worst of which is that in order to increase the chance of obtaining a satisfactory RBF
network; it has to use a very large set of candidate RBF nodes with different centers and
radiuses. There are a number of other growing strategies (K. Li, J. Peng & G. W. Irwin, 2005;
A. L. I. Oliveira et al., 2006 ; J. Gonzalez et al., 2003), but in all these methods the criterion for
determining growth suffers from a lack of objectivity. Many of them are also time-
consuming, sensitive to the input data, and do not consider the effect of the RBF output.
Yingwei et al. (L. Yingwei et al., 1998) have proposed a pruning strategy, based on the
relative contribution of each hidden node to the overall network output, which aims to
reduce the complexity of the RBF neural network. In theory the size of the final neural
network obtained by this method is minimal. Other methods for pruning RBF neural
networks have been proposed by Salmer’ on et al., (M. Salmer’ on et al., 2001) Rojas et al., (I.
Rojas et al.,2002) and Hao et al. (P. Hao & J. Chiang, 2006). A major problem with pruning
methods is that they often require more computational time than growing methods. In fact,
there are also quite a large number of parameters or variables that need to be preset; the
training data needs to be stored and re-used for pruning purposes. A promising alternative
is to combine growing and pruning methods together. Huang et al. (G. B. Huang et al., 2004)
proposed a simple sequential learning algorithm called the “RBF growing and pruning
algorithm“(GAP-RBF), which was later developed into the GGAP-RBF algorithm (G. B.
Huang et al., 2004; Q. Meng & M. Lee, 2008). The GAP-RBF and GGAP-RBF methods use the
“significance“ of a hidden node to decide whether to add new nodes or reduce the number
of redundant nodes. The “significance“ of the node is also linked to the learning accuracy.
However, since these algorithms are on-line procedures, they do not optimize the network
over all past training data. Moreover, network initialization of the GAP-RBF algorithm
requires a priori knowledge of the data which may not be available. Lian et al. (J. M. Lian et
al., 2008) have proposed a self-organizing RBF neural network (SORBF) for real-time
approximation of continuous-time dynamic systems. The aim of the SORBF network is to
develop an algorithm that can be used in real time processes. However, the authors do not
Waste Water - Evaluation and Management
98
investigate the failure cases for the algorithm. How to choose a suitable criterion to design
RBF neural network architecture remains an open question.
Section 3 presents a new RBF neural network design method which is called the “repair RBF
neural network algorithm“ (RRBF). RRBF performs simultaneous network architecture
design and parameter optimization within an integrated analytic framework. This approach
has two technical advantages. The first advantage is that the method is not dependent on
the input data: when the sensitivity analysis (SA) of the RBF output indicates that the
prototype is not suitable, the RBF architecture is repaired. The second advantage is that the
criterion used to determine whether the network should be repaired or not is more objective
than the criterion used in other similar time-based methods (e.g. RFS and GAF-RBF): it is
based on the sensitivity analysis (SA) value which calculates the contribution from hidden
nodes over a given time period (t + 1, t + 2, . . . , t + m, where m is the period). The learning
process starts by randomly initializing a single prototype in the feature space; then, the
prototypes undergoes adaptive repair until the most appropriate number of prototypes is
reached.
3.1 Previous and related works
a. RBF neural network
A standard RBF neural network consists of three layers: an input layer, a hidden layer, and
an output layer. Fig. 1 shows a schematic diagram of the RBF network. As the nodes in the
input layer represent the variables from input space and the nodes in the outer layer
represent the desired response, the number of nodes in the input and output layers is
configured in advance. A learning algorithm uses the defined optimization criteria to
minimize the error between the actual response and the desired response.
φ
1
(k)
∑
∑
x
2
x
n
φ
2
(k)
φ
N
(k)
y
1
y
m
Input Layer Hidden Layer Output Layer
x
1
•
•
•
•
•
•
•
•
•
•
•
•
•
•
11
w
m1
w
11
cx −
Fig. 1. Schematic diagram of RBF neural network (RBFNN)
As depicted in Fig. 1, the
r -th output node of the RBF network can be expressed as follows:
1
(),
p
ikkik
k
y
xc w
φ
=
=−⋅
∑
1,2, ,im
=
" (2)
where
[]
12
,,,
T
n
xxx x= " is an input value; n is the number of input node;
k
c is the k -th
center node in the hidden layer,
1,2, ,kp= " , and
p
is the number of hidden nodes;
The Chemical Oxygen Demand Modelling Based on a Dynamic Structure Neural Network
99
k
xc− denotes the Euclidean distance between
k
c and x ; ()
k
φ
•
is the nonlinear transfer
function of the
k-th center;
ik
w is the weighting value between the k-th center and the i-th
output node; and
m is the number of output nodes.
Equation (2) reveals that the output of the network is computed as a weighted sum of the
hidden layer outputs. The nonlinear output of the hidden layer are described as
()
k
φ
• , which
are radial symmetrical. Here the function chosen for this neural network is Gaussian
function, and the description is shown as follows:
2
2
()
()
()
xv
xe
δ
φ
−
−
= (3)
where
v and
δ
are the parameters of position and width of the centers. The activation
functions commonly used for the classification and regression problems are in the Gaussian
functions because they are continuous and differentiable; they provide softer output and
improve interpolation capabilities. The significant parameters to design an RBFNN for
solving problems are shown as:
1.
The RBF position of the centers v ;
2.
The width
δ
of the centers;
3.
The weights w ;
4.
The number of the hidden nodes
p
;
Based on 1), 2) and 4), the initializations of the centers are very important, if an incorrect
initialization of the centers is performed, the approximation error could be increased. The
reason is that during the execution of a local search algorithm to make a fine tuning of the
centers and the radius, there is a possibility of falling into a bad local minimum. An on-line
self-organizing algorithm is used for selecting the centers of the RBFNN in this chapter. This
algorithm can add new centers to repair the RBFNN, which solves the pre-set problem of
the conventional RBFNN. Meanwhile, the width of the centers is very important, if the
width is not appropriate for the RBF, the training time will be heavy. When the RBFNN
selects correct centers, the parameters of the widths and the weights will be adjusted at the
same time.
b.
The Sensitivity Analysis of Model Output (SAMO)
A thorough description of sensitivity analysis methods can be found in (Andrea Saltelli et
al., 2006). The most common SA is sampling-based. There are several steps to conduct SA.
The following steps can be identified as (the details can be found in (Andrea Saltelli et al.,
2006)):
Step 1.
Define the model, its input factors and output variable.
Step 2.
Assign probability density functions or ranges of the variation to each input factor.
Step 3.
Generate an input matrix through sampling design.
Step 4.
Evaluate the output.
Step 5.
Assess the influences or relative importance of each input factor on the output
variable.
At Step 4), an empirical probability distribution for the output can be created which may
lead to a first step of uncertainty analysis. After quantifying the variation of the output, SA
consists in apportioning the variance of the output according to the input factors. The
representation of the results can be described as the contribution to the input that describes
the variance of the output into the percentages that each factor is accounting for. In this way,
Waste Water - Evaluation and Management
100
the variance decomposition may allow the identification of the most influential factors. Then
the SA should present analyses over the full range of plausible values of key parameters and
their interactions, to assess how the change in response impacts changes in key parameters.
Sensitivity analysis (SA) is an available tool (J. Cariboni et al., 2007; A. Saltelli et al., 2000)
which may be used to study the behavior of a system, or a model, and to ascertain the
contribution ratio of the outputs depending on each or some of the input parameters.
Among the SA methods, quite often they are identified almost as a mathematical definition,
with a differentiation of the output respecting to the input. For this reason, quantitative
measure of sensitivity, such as the EFAST method (A. Saltelli et al., 1999) is described as
follows:
[( )]
()
hhh
h
Var E Y Z
S
Var Y
α
=
=
(4)
where,
h
Z denotes an input factor, 1,2, ,hp
=
" , and
h
Z represents the output connecting
value of the hidden nodes in the RBFNN in this chapter.
Y is the model response,
()
hh
EYZ
α
= is the expectation of Y conditional on a fixed value
h
α
of
h
Z and the variance
h
Var is taken over all the possible value of
h
Z . The ratio
h
S represents the main effect. It is
called the first-order index in the SA terminology. Thus, the main effect of a factor
represents the average effect of that factor on the response or conversely these methods
allow the computation of that fraction of the variance of a given model output which is due
to each input factor. In addition to the computation of the EFAST method which also
provided an estimation of the total sensitivity index
h
ST . The total effect includes the main
effect as well as all the interaction terms involving that factor. The total effect is defined by:
mod var
var
h
h
Amount of el response iance Z
ST
Model response iance
= (5)
The model is additive when the response is nonlinear but interactions are negligible. In that
case, the main effects are the suitable indexes for the sensitivity analysis of model output
(Philippe Lauret et al., 2006).
EFAST is based on the Fourier decomposition of the variance in the frequency domain. This
method is especially suited for a quantitative model independent global SA. The
computational cost of this method is the number of model evaluations required and is a
function of the number of input factors and the complexity of the model. The ever-
increasing power of computers tends to make these global methods affordable for a large
class of models. Among the SA methods, the total sensitivity index is undoubtedly the best
guide to quantitatively rank the factors by order of importance. Indeed, even if this occurs
rarely, interaction effects on a model response may dominate the main effects. So, whether
the interaction effects are taken into account or not, the analysis may result in a different
ranking of the factors’ importance.
3.2 The repair method for selecting hidden nodes of RBFNN
Considering the intrinsic structure of RBFNN, if the RBFNN consists of assured inputs,
certain hidden nodes and outputs, it can only adjust the weights
v ,
δ
and w which are in
the hidden layer or connecting the hidden nodes and the output nodes. In this chapter, the
The Chemical Oxygen Demand Modelling Based on a Dynamic Structure Neural Network
101
single response relationship between the hidden neurons and the output of the RBF is
discussed. We state that the relevance of a hidden node is related to its influence on the RBF
response. This is the key idea of the method proposed to determine the optimal architecture
for the RBF. The parameters
w of the hidden nodes are the input values of the repair
algorithm based on the sensitivity analysis (SA). And this SA is based on the Fourier
decomposition of the variance in the frequency domain.
a.
Selecting Hidden Nodes
A generic model is assumed to describe an RBF neural network system. The model is
represented by a mapping f (a deterministic or stochastic function) which relates the inputs
domain to the output space:
12
1
(,,,)
p
p
ii
i
YfZZ Z Z
β
=
==
∑
" (6)
The input factors
12
(,,,)
p
ZZ Z" are supposed to be the variables described by the
parameters w of the RBF hidden nodes,
1122
,,,
p
p
ZwZw Zw
•
••
=
==" ,
p
is the number of
the nodes in the output layer;
111121
[,,, ]
T
m
www w
•
= " , m is the number of the nodes in the
output layer. Y is taken to be a scalar even in the application we shall consider each output
variable in turn. Based on the EFAST method, the polynomial expansion can be described
again. The range of the factor
h
Z is ,
ab
⎡
⎤
⎣
⎦
, so the
h
Z performances as follows:
()
()
(2)(2)sin()
q
q
qq qq h
h
Zba ba s
ω
=+ +− (7)
where,
()
2
q
snN
π
= ,
h
ω
is the frequency,
q
is the simulation number, N is the total
simulation number. If
()
q
h
Z is straightforward to note
()
()
sin( )
q
q
h
h
zs
ω
= and that the formula
(6) should be as:
()
()
0
1
() ()
11
sin( )
sin( )sin( )
p
q
n
ii
i
pp
ij i j
ij
YY s
ss
βω
βω ω
=
==
=+
+
+
∑
∑∑
"
(8)
Based on this formula, the linear effect of
h
Z corresponds to the Fourier amplitude at the
fundamental frequency
h
ω
. In EFAST, each input factor
h
Z
is related to a frequency
h
ω
and
a set of suitable defined parametric equations:
() (sin( )) 1,2, ,
hhh
Zs G s h
p
ω
=="
(9)
The equations allow each factor to vary in a given range, as the new parameter
s
is varied.
They define a curve which explores the input factors’ space systematically. As
s
varies, all
the factors oscillate at the corresponding driving frequency
h
ω
and their range is
systematically explored. For the EFAST method, a parametric representation of the form is
often used.
Waste Water - Evaluation and Management
102
11
( ) arcsin(sin( ))
2
hh
Zs s
ω
π
=+ (10)
This transformation allows a better coverage of the factors’ apace since it generates samples
that are uniformly distributed in the range [0, 1].
If the range of variation of the factor
h
Z is [ ,ab], the parametric representation of the form
should be:
( ) arcsin(sin( ))
2
hh
baba
Zs s
ω
π
+−
=+ (11)
As each factor
h
Z oscillates periodically between [
,ab
] at the corresponding frequency
h
ω
,
the model output
Y exhibits different periodicities that result from the combination of the
different frequencies
1, ,ip
ω
= "
, whatever the model
f
is. Just for Fourier amplitudes, the
p
-
factor model can be described as follows:
12
() ( (), (), , ())
p
f
s
f
ZsZs Zs
=
"
(12)
where, the range of
s is [
,
π
π
−
], so the expanded in a Fourier series of the form:
() ( cos( ) sin( ))
jjjj
j
f
sAsBs
ωω
∞
=−∞
=+
∑
(13)
where, the Fourier coefficients are defined as:
1
()cos( )
2
jj
Afssds
π
π
ω
π
−
=
∫
,
1
()sin( )
2
jj
Bfssds
π
π
ω
π
−
=
∫
; the range of s is [ ,
π
π
− ].
Therefore, N equally spaced sample points are required to perform the Fourier analysis.
N represents the sample size and coincides with the number of model evaluations. Based on
the Fourier translation, the variance
y
D can be computed as:
22
1
() 2 ( )
y
kk
k
DVarY AB
+∞
=
== +
∑
(14)
The portion of the variance of
Y explained by
h
Z alone is:
22
1
[( )] 2 ( )
hhh
yZ h kk
k
DVarEYZ A B
ωω
+∞
=
==+
∑
(15)
where,
h
k
A
ω
and
h
k
B
ω
denote the Fourier coefficients for the fundamental frequency and its
higher harmonics
h
k
ω
. Then the expansion of the main effect is given by:
22
1
2
[( )]
() ()
hh
h
kk
Zh
k
h
AB
Var E Y Z
S
Var Y Var Y
ω
ω
+
∞
=
+
==
∑
(16)
The Chemical Oxygen Demand Modelling Based on a Dynamic Structure Neural Network
103
We stated above that in order to evaluate the main effect of
h
Z , one must calculate the
Fourier coefficients at the fundamental frequency
h
ω
and all the harmonics.
Because there is M interference factor (usually set to 4 or 6 in the SA community). So that the
first-order sensitivity index is approximated by:
22
1
2
[( )]
() ()
hh
h
M
kk
Zh
k
h
AB
Var E Y Z
S
Var Y Var Y
ω
ω
=
+
==
∑
(17)
The number of simulation runs represents the sampling frequency and, to meet the Nyquist
criterion, it must equal to:
max
21NM
ω
=
+ , (
max
max( )
i
ω
ω
=
) (18)
The variance
()Var Y can be evaluated in the frequency domain through the following
relationship:
(1)
2
22
1
() 2 ( )
N
w
Var Y A B
ω
ω
−
=
=+
∑
(19)
A
ω
and B
ω
denote the Fourier coefficients at frequency
ω
. In fact, based on this analysis the
total sensitivity index
h
ST can be shown as:
(1)
2
22
max( ) 1
(1)
2
22
1
()
()
h
N
M
h
N
AB
ST
AB
ω
ω
ωω
ωω
ω
−
=+
−
=
+
=
+
∑
∑
(20)
The advantages of the
h
ST make the judgments in this chapter much better than the
h
S .
Based on the former analysis of
h
ST , the main steps of the proposed approach for selecting
hidden nodes in the RBF are as table 1. For the proposed total sensitivity index, some points
have to be highlighted. First, usually, the sensitivity index for the ratio of the inputs is
dependent on the current time (
tm
+
). But the total sensitivity index can calculate the
contribution of period of time ( , 1, ,tt t m
+
+" ) which is more objective then the others
based on the current time (
tm
+
). Second, the computation of total sensitivity index occurs
when the FNN has been trained into a minimum of the error function or when over fitting
begins. But this proposed approach is not necessary. In other words, computation of total
sensitivity index starts when the FNN has been trained for some epochs in this chapter.
b.
Adding New Nodes
As the active nodes in the hidden layer are found by the SA, the new nodes will be inserted
to repair the prototype of the RBFNN. The parameters
v
,
δ
and
w of the new nodes are
given as follows (assuming the
h -th node is the active node and only a new node will be
inserted):