Wind Tunnels and Experimental Fluid Dynamics Research Part 13 ppt
Bạn đang xem bản rút gọn của tài liệu. Xem và tải ngay bản đầy đủ của tài liệu tại đây (6.13 MB, 40 trang )
Wind Tunnels and Experimental Fluid Dynamics Research
468
powder supply
fan
supply nozzle
filter
powder withdrawal
traverse
turn table
(Hokkaido Northern Regional Building Research Institute)
Fig. 4. Wind Tunnel for the snow simulations
Fig. 5. Vertical distribution of wind velocities in the wind tunnel
Public Square Design with Snow and Wind Simulations Using Wind Tunnel
469
The characteristic point between pure snow in Wakkanai and white soil are similar. Both of
drifting angle and shape are similar, the angle of pure snow assumes around from 45 to 50
and the angle of white soil is 46. This is the reason author adopted white soil for the snow
simulations (Fig. 6).
Drifting Angle
Pure snow in Hokkaido 45 – 50 degree
White soil 46 degree
Fig. 6. Comparison the drifting angle between pure snow and white soil
2.3 Models for snow simulation experiments
For the snow simulation tests, block models of the target area, the Wakkanai station district,
were made of styro-foam in the scale of 1 to 300. The size of the district is 540m (in the
north-south direction) by 360m (in the east-west direction); therefore the models of the
district measured 1800mm long by 1200mm wide for the snow simulation tests.
The snow models were made of white soil powder
*4
. This soil tends to have a drifting
pattern similar to that of snow in Hokkaido. It gives a static-free performance in wind
tunnels; therefore there was no friction between the powder particles themselves. The
ground model boards were painted; therefore there was no friction between the powder and
the ground models. The powder for the snow models was supplied from windward side
nozzles to the testing area of the tunnel by an air compressor. The CW models were made of
acrylic plastic board for no friction with the snow soil powder.
Photo 2. The targeted district models of Downtown Wakkanai
θ
Wind Tunnels and Experimental Fluid Dynamics Research
470
3. Assessment items depend on the planning issues
3.1 Nine planning approaches for the Wakkanai station project
On the Wakkanai Station renewal project the nine planning approaches are addressed for
the downtown revitalization program as follows.
1. Accessibility: Pedestrians and passenger are able to access easy to the station, bus
terminal and the commercial facilities even in winter.
2. Barrier Free: The accessibility is also ensured for elderly and handicapped.
3. Connection: The pedestrians’ connection between downtown and water front area is
one of the most important network for the downtown revitalization. The urban axis
along to the Wakkanai station square will be required less snow damage and
snowdrift.
4. Walk-able: Walk-able environment for pedestrian may be ensured on the no snowdrift
walkway in winter.
5. Comfortable: Even the outside on the station square comfortable environment should
be required for pedestrians and citizens during a year.
6. Community: Making community spaces for citizen will be helpful for their
communications. Some of them are inside of the building and some are outside with
better comfort environment.
7. Facilities: The Wakkanai Station renewal project promote important facilities rail station
and bus terminal. People have much chance to meet together.
8. Mixed Use: The Wakkanai Station renewal project include the development of
commercial area and elderly apartments inside the new building. The pedestrian ways
have chance that various pedestrian especially elderly people walk on the ways many
times.
9. Information: The information for tourist and citizens should be provided accurately.
The locations of the information board and signs are also important.
The CW design is also significant to contribute to the Wakkanai Station program for above
items Accessibility, Barrier Free, Connection, Walk-able and Comfortable.
3.2 Planning issues regarding the Wakkanai station square project
For planning regarding the Wakkanai Station Square
*5
, the following three issues were
addressed. They were pointed out as urban design issues before the snow simulation tests.
The Wakkanai station and Station Complex Center were planed integrally and the site was
as see Fig. 7. The height of the building was 13.5 meter (45mm heights on the model).
a) Planning for an urban axis with a desirable pedestrian mall for connecting
downtown and the port area
The downtown area and the port area are divided by the JR railway line, and Wakkanai
station is located between them. Since a big park is planned for the port area in next decade,
an urban axis with a pedestrian mall connecting them is required in the redevelopment
plan.
b) Planning for enough area for vehicular traffic in the Station Square
Enough area is required for vehicular traffic, such as public buses, taxis and private vehicles,
in the Wakkanai Station Square even in winter.
Public Square Design with Snow and Wind Simulations Using Wind Tunnel
471
c) Planning for the integration of public transportation
No barrier should be required for pedestrian to transfer between JR train and public bus.
Especially the cross point of the urban axis and the pedestrian route from JR train to Station
Square are significant no snow drifting for the desirable pedestrian networking.
Fig. 7. Planning Issues and Assessment Items on the Wakkanai Station Square Project
< a) b) c) are the planning issues, 1) 2) 3) are the assessment items for the snow simulation >
<The gray elliptic line means the site of the location of the Station Complex Center>
3.3 Assessment items regarding snow simulation
For implementing those planning objectives even in winter, the following three assessment
items were addressed regarding each issue. These assessment items were verified in snow
simulation tests using the wind tunnel. Basically, these items were based on the concept of
reducing the impingement upon pedestrian activity caused by winter snowdrifts in the new
redevelopment of Wakkanai Station Square (Fig. 7).
1. No snowdrifts are to be permitted on the pedestrian way connecting downtown and the
port area and CW. Various activities will be assumed on the pedestrian way and CW,
such as transfer among the various forms of public transportation, flow from
downtown to the port area and entrance to the station complex center. Even in winter,
snowdrifts should not be an obstacle to the pedestrian network.
2. Easy access to snow removal is to be required in the station square in winter. Enormous
piles of snow should not be left in the square because it would interfere with vehicular
and pedestrian traffic. Snow storage space is also required in the square.
3. No big snowdrifts are to be permitted on the pedestrian network among the public
transportation points in winter. People want to transfer between the JR line and a public
bus or taxi without the barrier of snowdrifts.
Wind Tunnels and Experimental Fluid Dynamics Research
472
3.4 Comparing the covered walk design for preventing from the snow
The JR Wakkanai railway station, a public bus station, a taxi bay and the requirements of
private vehicular traffic should be integrated with the station square to allow for smooth
transfer among them. At present they are separate and transfer is inconvenient.
Consideration given to pedestrian access among these transportations will be required in
the redevelopment plan.
Author focused on snow impacts of distinguish of the CW site plan between Leeward side
and Windward side type. The both general site plan showed on Fig. 8. and Fig.9. The idea of
Leeward side CW type was protecting pedestrian’s activities on the station square and
pedestrian’s activities on the pedestrian way from snow and strong wind. Windward side
CW type also had a concept protecting pedestrian’s activities from snow and strong wind.
Both CW type had sidewalls partially around one-third of the total length.
37.5m
1
8
.
5
m
3
4
.
5
m
N
Fig. 8. Site plan of Leeward side CW type
65m
40m
2
0
m
N
Fig. 9. Site plan of Windward side CW type
Public Square Design with Snow and Wind Simulations Using Wind Tunnel
473
6m
37.5m
2.3m
2.3m
2.1m
GL
Cover
GL
Cover
Gl as s Wall
Gl as s
Wall
3m 6m 3m 6m 3m 6m 3m
1.5m
Fig. 10. Section of the Covered-Walk (part) (gray parts are glass walls)
Fig. 10 shows the section plan of the both CW type. The height of the CW should be as low
as possible because of preventing from the snow storm. The length of the roof 2.1m is
similar to the height for the same reason. The CW has 3m glass walls every 9m pitch, the
walls may prevent pedestrian from snow storm. All of the side of CW covered the glass
walls is not good design because it will cause the snowdrift inside the CW.
4. Results of the snow simulation experiments
In the findings of the snow simulation tests with snow and wind, several snow problems
were observed with both of the CW designs for the new Wakkanai Station Square
planning.
4.1 Leeward side CW type (fig. 11)
1. A big snowdrift was formed around the leeward side CW comparing to Windward side
type (see point A). The snowdrifts in the station square were caused by the backlash of
snow and wind from the Station Complex Center. The backlash of snow and wind
flooded the CW, reducing its wind velocity, thereby causing the snowdrifts there.
Snowdrifts at the bus stops negatively impact passengers.
2. A big snowdrift was formed on the windward side of the station square even though
no CW is located there (see point B). It was assumed to be caused by the reduced
velocity of the wind as it streamed from the narrow street to the wide station square.
If a snowdrift forms along the CW in the square, it will negatively impact the vehicles
there.
4.2 Windward CW type (fig. 12)
1. On the windward CW type, a big snowdrift was not formed around the bus stops
comparing to Leeward side type (see point C). There was no barrier backlash of snow
and wind from the Station Complex Center, as wind streamed through to the center of
the square. No passengers or vehicles will be inconvenienced by snowdrifts in this
situation. But grass shelters will be required at the bus stops for protecting the
passengers from the strong and cold winds.
2. The snowdrift on the windward side of the square was big, but it formed smaller than
the Leeward side CW type (see point D). Author figured out the reason that the CW
prevented wind and snow from north and northeast direction for making snowdrift on
the windward side of the station square. The spread of the snowdrift would have less
impact on vehicular traffic in the square. Bus stops and taxi bays should be planned to
exclude this area.
Wind Tunnels and Experimental Fluid Dynamics Research
474
←←←Windward side (North) Leeward side (South) →→→
(Numeric values mean the height of powder draft of the model)
Fig. 11. Snow and wind simulation test of Leeward side Covered Walk (CW) type
from above (left) from windward side (right)
Photo 3. Snow simulation result of Leeward side Covered Walk type
Public Square Design with Snow and Wind Simulations Using Wind Tunnel
475
←←←Windward side (North) Leeward side (South) →→→
(Numeric values mean the height of powder draft of the model)
Fig. 12. Snow and wind simulation test of Windward side Covered Walk (CW) type
from above (left) from windward side (right)
Photo 4. Snow simulation result of Windward side Covered Walk type
Wind Tunnels and Experimental Fluid Dynamics Research
476
5. Conclusions
In the findings of the snow simulation tests with snow and wind, several snow problems were
observed with both of the CW designs for the Wakkanai Station Square renewal planning.
On the leeward side CW type simulation, a big snowdrift was formed around the leeward side
of CW (Fig. 11). On the other side, on the windward CW type, a big snowdrift was not formed
around the bus stops (Fig. 12). Comparing the two types of CW design, the Windward side
CW type is better suited to alleviate the impact of heavy snowfall in the new Wakkanai Station
Square development because the formation of snowdrifts are less likely to occur to the
passenger area that riding on the buses and pedestrian areas walking along the CW. The
finding that a big snow barrier like the CW caused snowdrifts to form around it and snow
inconveniences to pedestrian and bus transit during the winter season in Wakkanai was very
interesting. It is assumed that the CW reduced wind speed and contributed to form the
snowdrift along the CW. The CW has not to be located at right angle to the main wind
direction in winter. The CW has to be designed carefully to its site plan and section plan.
It is very important to make the snow and wind simulations using wind tunnel on the
process of the public square design project in these snowy and cold regions. The problems
caused by snow and wind are pointed out clearly and those problems should be reflected to
the public space design and urban design. The results of this simulation also should be
reflected in the square planning and design of this project.
These snow simulations were tested only two site design type of CW, then more variable CW
design e.g. wall design and height have to be tested on the snow simulations. Father more, the
snow simulation on real atmospheric phenomena should be required because this was
verifiable only through the conduction of snow simulation tests incorporating a wind tunnel.
6. Sustainable design approach relationship between urban design and
environmental planning
On the Wakkanai Station Square design studies with snow simulations author realized the
new sustainable design approaches relationship between Urban Design and Environmental
Planning. Especially in these cold and snowy cities, this sustainable design approaches
should be required on these urban design projects. Author developed the new urban design
approach with snow simulations using wind tunnel as follow steps (Table 3).
7. Notes
1. The Designing CW is one of the most important items for pedestrian network on this
project.
2. Heavy Snow Area: The local government that has 5,000 cm by days and more snowfall
in total in last 30 years. Multiplying the height of snow stock per day by snow stock
days gives the cm*days.
Particular Heavy Snow Area: The local government that has 15,000cm*days and more
snowfall in total in last 20 years.
3. Manufactured by Keyence LK2500
4. The white soil powder has 8.5% of moisture content and the average of diameter has
20μm. It means very dry and small particle powder.
5. The station square is planed four bus bays, three taxi bays and four bays for private
vehicles on the Wakkanai Station Square project.
Public Square Design with Snow and Wind Simulations Using Wind Tunnel
477
Urban Design Approaches Environmental Planning Approaches
1) Urban design approach #1
- Making planning criteria contribute to the
downtown revitalization.
- Several alternative designing plans are
proposed depend on these planning
criteria.
Urban Design Approaches
(continue)
Environmental Planning Approaches
(continue)
2) Environmental planning approach #1
- The experiments of the snow simulations
using wind tunnel for the alternative
design plans.
- Environmental evaluations to the results
of the snow simulations on the alternative
design plans.
3) Urban design approach #2
- Development to the design guidelines
depend on the results of the snow
simulations. Each alternative design plan
has good and considerable points in the
results of the simulations. For promoting
more useful to the results of the snow
simulations, the design guidelines are able
to reflect those ideas of the simulations.
4) Environmental planning approach #2
- More response to the environmental
conditions of snow problems, snow
drifting and strong wind on the detail
planning of the projects.
5) Urban design approach #3
- On the designing process of the station
square more detail designing points reflect
from the design guidelines.
Table 3. Sustainable design approach relationship between Urban Design and
Environmental Planning
8. References
[1] Bosselmann, P. (1984). Sun, wind, and comfort - A Study of Open Spaces and Sidewalks
in Four Downtown Area –. Environmental Simulation Laboratory University of
California Berkeley, USA,
[2] Bosselmann, P. and Arens, E. (1989). Wind, sun and temperature - predicting the thermal
comfort of people in outdoor spaces. Building and Environment, Vol.24, No.4,
pp315-320, USA
Wind Tunnels and Experimental Fluid Dynamics Research
478
[3] Bosselmann, P. (1998). Representation of Places - Reality and Realism in City Design -,
Downtown Toronto Urban Form and Climate, University of California Press,
USA
[4] Pressman, N. and Zepic, X. (1986), Planning in cold climates. Institute of Urban Studies,
Canada
[5] Pressman, N. (1995), Northern cityscape – linking design to climate –. Winter Cities
Association, Canada
[6] Setoguchi, T. (2003). A Study on Efficiencies for Reducing Snow Damages on Infill
Developments in Downtown Area, The proceedings of International Symposium
on City Planning, 2003.9, Japan
[7] Setoguchi, T. (2004), Efficiencies of Infill Developments against Snow Problem in Winter
Cities - The Snow Simulations for Desirable Block Designs Using Wind Tunnel -,
Journal of Asian Architecture and Building Engineering, 2004.11, pp335-340
[8] Tomabechi, T. (2002). Influence of snow around the building on evacuation activities,
Journal of Architecture, Planning and Environmental Engineering, No.560, 2002.10,
pp167-172, Japan
[9] Yoshizaka, T. (1942). The Model Study on the Snow Stock Environments Surrounding of
Buildings, Snow and Ice, Japan
Part 4
Turbulent Structure Analysis
1. Introduction
Aerodynamics is quite important for racing cyclists and particularly in time-trial competitions.
In fact, the aerodynamic resistance, i.e. the breaking action of the relative wind, increases
quadratically with the speed while the rolling resistance depends linearly on the speed (Kyle,
1989). Thus, due to the rather high velocity (in the order of 50 km/h ), the aerodynamic
resistance acting on a time-trial racer is about the 90% of the total resistance. Aerodynamics is
thus very important for the cyclists performances and many experimental studies, addressed
to find the best cyclist position as well as the best articles, have been carried out in the past
(Garcia-Lopez et al., 2008; Gibertini & Grassi, 2008; Grappe et al., 1997; Lukes et al., 2005).
Furthermore, although they are outside of the subject of the present treatise, some interesting
computational works begin to appear in literature (see for example Defraeye et al. (2010a;b)).
1.1 The aerodynamic resistance
Following a widely used notation, the component of the aerodynamic force opposite to the
bicycle motion is called Fx and its non-dimensional coefficient is Cx
= Fx/(½ ρV
b
2
S) where
ρ is the air density, V
b
the bicycle speed and S a reference area that has to be defined. In
absence of natural wind, all the relative wind is due to the bicycle motion and thus the force
Fx corresponds to the aerodynamic drag and Cx is the drag coefficient.
For the typical racing velocities the coefficient Cx slightly depends on the Reynold number
Re
= ρV
b
√
S/μ (where μ is the air viscosity) so that the drag is essentially proportional to the
air density and to the square of the velocity (Basset et al., 1999). In order to avoid the arbitrary
definition of S it can be more convenient to express the aerodynamic resistance in terms of
drag area SC x instead than in terms of non-dimensional drag coefficient. On the other hand,
in order to compare the position aerodynamic efficiency of different cyclists apart from their
different dimensions effect, the normalized resistance (i.e. the Cx) can be interesting and in
this case the projected frontal area can be taken as reference area (Heil, 2001 and 2002). More in
general, when the drag of two or more bodies (whatever they are, men or objects) is compared,
the decomposition of the drag area SCx in terms of drag coefficient Cx and reference area S
The Study of Details Effects in Cycling
Aerodynamics: Comparison Between Two
Different Experimental Approaches
Giuseppe Gibertini
1
, Gabriele Campanardi
1
, Donato Grassi
1
and Luca Guercilena
2
1
Politecnico di Milano - Dipartimento di Ingegneria Aerospaziale
2
Quick Step Pro Tour
1
Italy
2
Belgium
23
2 Will-be-set-by-IN-TECH
can help to evaluate how much a drag difference is due to a difference in the size or to a
difference in the shape efficiency.
As reported by Gibertini & Grassi (2008), the time-trial cyclist overall Cx is slightly less than 1
(typically about 0.8) denoting that the cyclist is definitively a bluff body.
1.2 The testing methodologies
The experimental study of cycling aerodynamics is made difficult by the fact that the cyclists
are not machines and their motion is not completely deterministic. As a matter of fact,
although the motion of an elite cyclist is rather controlled and repeatable, nevertheless there
are many possible differences (also in nominally equal positions) that can sensibly (and
sometime strongly) affect the aerodynamic efficiency. The problem becomes more serious
when the focus of the study is a detail effect as the effect of a bicycle part (handlebar, fork,
wheels, etc.) or the effect of a particular of the cyclist dressing (as the shoes or the suit). In
fact, the effects of that single details (Alam et al., 2008; Blair & Sidelko, 2008; Chabroux et al.,
2008; Kyle, 1989; 1990; Sayer & Stanley, 1994; Tew & Sayers, 1999; Underwood & Jeremy, 2010)
are often smaller than the global uncertainty of the drag measurement of a test involving the
athlete (Flanagan, 1996).
It could be observed that so small effects, that can be easily masked from a slightly different
position, are not so important for the cyclist performance. Nevertheless two considerations
can be done: the first one is that also a small drag reduction can produce a sensible effect
on the resulting race time (Kyle, 1989), and the second one is that an aerodynamic effect not
strictly related to the cyclist position is anyway added to the global drag, independently to the
capacity of the cyclist to keep the optimal position. Furthermore the sum of different small
detail effects can results in a considerable value. Thus the problem of the better methodology
for the study of this kind of detail effects is an important item for the cycling aerodynamics.
Generally speaking we can consider three possible experimental approaches. The fist one is
the wind tunnel testing of the single isolated detail: this way allows for very accurate and
repeatable measurements and requires a relatively small wind tunnel (which means relatively
low costs) but, on the other hand, the working condition of the isolated detail are not, in
principle, the real working conditions. In principle tests can be carried out “in-field” as it has
been done both directly on the road (Martin et al., 2006) and on a track (Gibertini, Campanardi,
Guercilena & Macchi, 2010; Grappe et al., 1997). Unfortunately this tests are unavoidably
affected by a considerable measurement uncertainty. In the middle between these two testing
approaches, a third possible way is the wind tunnel testing including the real pedaling cyclist
that surely produce more accurate results respect to the in-field testing. Nevertheless also
wind tunnel results are affected by problems of repeatability.
An evaluation of the relative advantage and disadvantage of these three approaches is not
simple. The present paper presents a reasoned comparison between the results obtained with
”manned” wind tunnel testing and a partial model test (Gibertini, Grassi, Macchi & De Bortoli,
2010) on the effect of the overshoes.
1.3 Shoe testing
The choice of the shoes is a typical problem of the aerodynamic optimization of a time trial
cyclist. Of course this choice depends on many aspects and not only on the aerodynamic
point of view, but nevertheless it is interesting to evaluate the amount of drag (and thus the
amount of power) due to the shoes. An interesting point that is a valid example to compare
the two cited wind tunnel testing approaches is the effect of the overshoes: this accessories
482
Wind Tunnels and Experimental Fluid Dynamics Research
The Study of Details Effects in Cycling Aerodynamics: Comparison Between two Different Experimental Approaches 3
are widely used in the time trial competitions with the aim of drag reduction. In the study
already mentioned here before (Gibertini, Grassi, Macchi & De Bortoli, 2010) this subject was
investigated by means of wind tunnel tests with a shank and foot model. These tests showed
that the overshoes produce a drag increasing instead of a reduction. This counter-trend results
could not be taken as conclusive because the tests were carried out on a static partial model
(reproducing just the shank and the foot) that could not include all the real effects. A recent
series of tests was carried out with an elite team of six cyclists. The aim of these tests was
mainly the optimization of cyclists position (see Gibertini, Campanardi, Guercilena & Macchi
(2010)) but it has been a precious occasion to get some confirmation of the results obtained
with the shank and foot model.
2. The reference tests of overshoe effect on a partial model of foot and shank
The leading idea of the partial model tests was to represent, as well as possible, the working
condition of the foot with a relatively simple setup (Gibertini, Grassi, Macchi & De Bortoli,
2010). The model was essentially a beam terminating with a shank model. The foot model
was hinged to the shank in the ankle position. At the other extremity the beam was hinged to
the balance interface. Thus, the model allowed to set both the angle of the shank and the angle
of the foot. The shoe, put on the foot model, included the pedal. The test layout is shown in
Fig. 1.
(a) (b)
Fig. 1. The partial model test layout in the complete model configuration (a) and in foot-off
tare configuration(b)
The test conditions have been defined on the base of shank and foot angles (defined as in
Fig. 2a) at four pedaling phases θ of a specific cyclist taken as reference example (the values
are reported in Table 1). The shank and foot angles in the four reference positions have been
deduced from the analysis of the frames of a video recorded during a previous "manned" wind
tunnel test carried out in the Large Wind Tunnel of Politecnico di Milano. The obtained values
have been taken as indicative as it was already clear that different cyclists have different angles
of shank and foot (with differences that can be in the order of some degrees).
θ = 0° θ = 90° θ = 180° θ = 270°
F
S
F
S
F
S
F
S
−22.9° 49.3° 8.6° 80.8° −16.6° 83.7° −40.7° 40.7°
Table 1. Pedaling angle values assumed for the partial model test
483
The Study of Details Effects in Cycling Aerodynamics:
Comparison Between Two Different Experimental Approaches
4 Will-be-set-by-IN-TECH
(a) (b)
Fig. 2. Geometrical and kinematical quantities definition
These measured angles have been used to set the wind tunnel test conditions taking into
account also the additional (positive or negative) incidence α
p
induced by the the foot vertical
translation due to the pedaling (see Fig. 2b). Referring again to Fig. 2a, Δ
=
S
−
F
while the
relative velocity V
r
and its incidence angle α have been determined by the following Equation
1 and 2 where f is the pedaling frequency and c is the crank arm lenght.
V
r
=
(V
b
+ 2π fccosθ)
2
+(2π fcsinθ)
2
(1)
α
=
F
+ α
p
; α
p
= arctan
2π fcsinθ
V
b
+ 2π fccosθ
(2)
The test conditions for the foot model, computed by means of Equations 1 and 2, are listed in
the Table 2. The sketch of Fig. 3 illustrates the meaning of these quantities
θ = 0° θ = 90° θ = 180° θ = 270°
V
r
α V
r
α V
r
α V
r
α
17.0 m/s −22.9° 15.1 m/s 16.1° 13.0 m/s −16.6° 15.1 m/s −48.2°
Table 2. Test conditions set for the partial model test
The aerodynamic resistance is the force component Fx opposite to the bicycle motion
(Equation 3).
Fx
= F · V
r
cos(α
p
) (3)
The average resistance was computed taking the mean value of the four resistance values
measured at the four different pedaling phases of Table 1.
Of course, the main limitation of this approach is that some interference effects with the other
real components are missing (first of all the crank arms). An other possible objection is that
also the real foot and shank dynamics is not completely reproduced: the incidence angle and
the velocity are set to taken into account the motion due to pedal rotation but the rotation of
the foot itself as well as the rotation of the shank are not reproduced. On the other hand, the
measurements were quite accurate and repeatable indeed.
The tests were carried out assuming a reference riding condition of 15 m/s (i.e. 54 km/h) speed
and 1.8 Hz pedaling frequency. Two different shoe models (one laced and one strap fastened)
and the overshoe have been tested with two different pedal models. In order to obtain the
484
Wind Tunnels and Experimental Fluid Dynamics Research
The Study of Details Effects in Cycling Aerodynamics: Comparison Between two Different Experimental Approaches 5
Fig. 3. The test parameters
aerodynamic loads acting on the foot only, previous aerodynamic tare tests with just the beam
and the shank have been carried out as can be seen in Fig. 1b. The loads measured without
the foot have been subtracted from the load measured with the complete model. One of the
most curious results was the overshoe effect. In these test it resulted that the overshoe over
a strap fastened shoe model produces an over drag for all the four tested phases as can be
seen in Fig. 4 that shows the results obtained by Gibertini, Grassi, Macchi & De Bortoli (2010)
for the strap fastened shoe model, with and without the overshoe, with a clipless single-sided
pedal (33 mm high).
Taking the arithmetic mean of the four results related to the four phases, the measured drag
area increase resulted to be equal to 0.001 m
2
for each foot. The total amount of cyclist and
bicycle drag area is in the order of 0.2 m
2
(Defraeye et al., 2010a) thus the effect of the two
overshoes is in the order of 1% of the total drag.
In order to verify the results of Gibertini, Grassi, Macchi & De Bortoli (2010), a new test
campaign has been carried out using the same test conditions (as described here before) and
using the same models (all the pictures of the partial model tests included in this chapter have
been taken during this new test campaign). The new tests confirmed the results published in
the cited journal paper. As in that refrence work, the tests have been repeated with another
pedal model obtaining essentially the same results: the drag area absolute values were slightly
different as the pedals were different but the differences between different shoe models drag,
as well as the difference due to the overshoe, were the same within a tolerance of 10
−4
m
2
.
485
The Study of Details Effects in Cycling Aerodynamics:
Comparison Between Two Different Experimental Approaches
6 Will-be-set-by-IN-TECH
Fig. 4. Comparison between the foot drag areas without and with the overshoe at four
different pedaling phases (drag areas expressed in m
2
)
3. The manned wind tunnel tests of overshoe effect
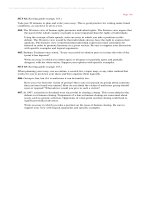
The wind tunnel tests of the ”complete system” (including the cyclist) were carried out in the
large wind tunnel of Politecnico di Milano (Campanardi et al., 2003). This facility is equipped
with a specific test rig for cycling aerodynamic tests. The test chamber is wide enough (Fig.
5) to get a negligible blockage effect: in facts, a typical value for the projected front area
of a cyclist in time trial position is about 0.3 m
2
while the test section area in cycling test
configuration is 14.5 m
2
leading to a solid blockage of about 2% thats is an unusually low value
(Defraeye et al., 2010a) assuring very low blockage effects (Barlow et al., 1999). Nevertheless,
although it was very small indeed, blockage effect correction has been applied to the results
following the procedure indicated in Barlow et al. (1999) for the case of unconventional shape.
Fig. 5. The wind tunnel test chamber
The test rig, that is in details described by Gibertini & Grassi (2008), allows to reproduce
a realistic condition with the athlete pedaling and both wheels spinning (Fig. 6). The rear
wheel axle is held by two vertical beams so that the wheel can spin over a small roller that,
by means of a toothed belt, transmits the rotation to the front roller and finally to the front
wheel; the front wheel axle is free so the cyclist has to drive the wheel as in a real condition.
A brake system provides an adjustable resistance torque to the rollers producing a realistic
effort and thus a realistic cyclist body attitude. A sketch of the test rig is shown in Fig. 7.
The drag contribution of the support system (i.e. the aerodynamic tare) is measured in a test
486
Wind Tunnels and Experimental Fluid Dynamics Research
The Study of Details Effects in Cycling Aerodynamics: Comparison Between two Different Experimental Approaches 7
run without rider and bicycle. The bicycle is equipped with a tachometer so that, during the
test run, the cyclist is able to maintain the correct rotational speed of the wheels matching the
wind velocity.
Fig. 6. Cyclist pedaling in the wind tunnel
Fig. 7. The test rig for the cyclist
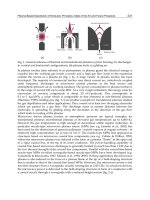
As mentioned before, the tests concerned a team of six cyclists with the aim of optimizing
their position for time trial competitions. This gave the possibility to test the overshoe effect
on a rather large base of athletes. The comparison with the reference tests of Gibertini, Grassi,
Macchi & De Bortoli (2010) was made more meaningful by the fact that the most of these
cyclists (four over six) adopted the same shoe model used in that study (Fig. 8a). The overshoe
model was the same for all the six cyclists and was of the same kind of the one used in the
partial tests (Fig. 9).
In Table 3 the anthropometric data of the six cyclists are listed, including the pedaling angles
(see Fig. 2a for the definition) measured from the wind tunnel video-camera frame as showed
in Fig. 10.
487
The Study of Details Effects in Cycling Aerodynamics:
Comparison Between Two Different Experimental Approaches
8 Will-be-set-by-IN-TECH
(a) (b)
Fig. 8. Front view of cyclist legs without (a) and with (b) the overshoes
Fig. 9. The overshoe
By Equations 1 and 2 is possible to compute, for each cyclist and for each pedaling phases,
the foot incidence α. In Fig. 11 these incidences are plotted together and compared with the
488
Wind Tunnels and Experimental Fluid Dynamics Research
The Study of Details Effects in Cycling Aerodynamics: Comparison Between two Different Experimental Approaches 9
θ = 0° θ = 90° θ = 180° θ = 270°
Cyclist Height
F
S
F
S
F
S
F
S
Shoe Size
AK 184 cm −31° 39° −2° 61° −13° 66° −52° 36° 43.5
TK 182 cm −33° 48° −6° 74° −23° 76° −59° 45° 43
KS 173 cm −29° 41° 0° 66° −21° 73° −50° 39° 42.5
∗
DD 177 cm −24° 47° 2° 72° −21° 73° −50° 42° 43.5
SD 182 cm −29° 43° −3° 67° −24° 71° −50° 41° 44
KD 182 cm −29° 39° −6° 64° −19° 73° −49° 38° 43
∗
∗
different shoe models
Table 3. Cyclists anthropometric data
Fig. 10. Frame of the wind tunnel video-camera with drawn lines highlighting the pedaling
angles
reference values used in the partial model tests.
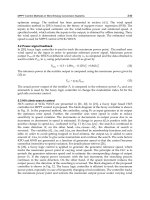
As discussed in the introduction of the present paper, the manned tests are affected by a low
degree of repeatability so that in principle, in order to obtain a result statistically meaningful,
the test should be repeated several times. On the other hand the tests number are limited
by reasons of wind tunnel costs and also by the fact that the cyclists tend to loose the
concentration after too many repetitions (so that the result is not necessarily improving).
In the present activity the cyclist position were tested twice, with any repetition test just
subsequent to the first one, while the overshoes effect has been tested, for each cyclist, with
an overshoes-on test just subsequent to an overshoe-off test at the same cyclist position (only
for the cyclist KS the overshoe-on test preceded the other one). The single results is poorly
meaningful as the chased effect is in the order of the test repeatability but the set of the all six
data (one for each cyclist) gives a reasonable estimation of its order of magnitude.
Each test consisted in a 30 s acquisition at 12.5 m/s and, except for AK and TK, in a second
acquisition at 13.9 m/s during the same wind tunnel run. As the two velocities are quite
close each to the other so that the Reynolds number is essentially the same, for each test the
489
The Study of Details Effects in Cycling Aerodynamics:
Comparison Between Two Different Experimental Approaches
10 Will-be-set-by-IN-TECH
Fig. 11. Foot incidences
drag area was averaged over the two acquisitions (when applicable). The pedaling frequency
was 1.5 Hz for 12.5 m/s and 1.7 Hz for 13.9 m/s. In Table 4 the measured values of ΔSC x
(the drag area increase due to the overshoes) are presented. The parameter RP, computed for
each cyclist, is the root mean square of the differences between the drag areas measured in
two related tests (a position tests and its repetition). Due to the small statistical base (from 3
to 5 positions tested for each cyclist) this parameter is only indicative but nevertheless gives
a rough quantification of the test repeatability. It appears clear that the measured values of
ΔSCx are in the order of the tests uncertainty but nevertheless it is remarkable that in no one
case the overshoes showed an advantage. The mean value (taking the mean of all the cyclist)
resulted to be 0.003 m
2
that, taking into account all the uncertainties, is quite well comparable
with the value of 0.002 m
2
obtained with the partial model tests. These results are summarized
in Fig. 12.
Cyclist ΔSC x RP
[m
2
] [m
2
]
AK 0.006 0.004
TK 0.004 0.006
KS 0.004 0.003
SD 0.001 0.003
KD 0.002 0.002
DD 0.001 0.002
Table 4. The overshoe effect
4. Conclusions
The results of the present experimental investigation well highlight the difficulties of
evaluating details effects by means of complete manned wind tunnel tests. The present
investigation essentially confirmed the results obtained with the partial model: the overshoes
produced an increase in the aerodynamic drag. Also the order of magnitude of the measured
effect is essentially confirmed although the present manned tests are affected by a problem
of repeatability that does not allow to estimate accurately such a small effect. Of course
this degree of uncertainty does not allow to consider the present tests as a quantitative
490
Wind Tunnels and Experimental Fluid Dynamics Research
The Study of Details Effects in Cycling Aerodynamics: Comparison Between two Different Experimental Approaches 11
!
"#"$"%&'"
Fig. 12. The overshoe effect (drag areas expressed in m
2
)
validation of the simplified test procedure but, nevertheless, the present results demonstrate
that the complete manned configuration does not produce, respect to the simplified setup, any
important aerodynamic effect that can drastically change the results. It can be concluded that,
for the case of shoes aerodynamics, the partial test in a relatively small wind tunnel is a very
reasonably way, more convenient respect to a more expensive and less accurate manned test.
Of course this results is due to the fact that the adopted procedure and setup included all the
main effects of the real condition and this was due to a reasoned approach but also to the fact
that the foots are essentially undisturbed by the wake of the other components. This is not the
case, for example, of the rear wheel that is completely immersed in the wakes of the cyclist
legs and of the bicycle itself so that the drag measured by means of isolated wheel tests result
to be not applicable to the real condition.
Generally speaking it is clear from the presented activity results that the question about the
way for an accurate experimental definition of so small aerodynamic effects is still an open
question.
5. References
Alam, F., Subic, A. & Akbarzadeh, A. (2008). Aerodynamics of bicycle helmets, in M. Estivalet
& P. Brisson (eds), The Engineering of Sport 7, vol. 1, Springer, Paris, pp. 337–344.
Barlow, J., Rae, W. & Pope, A. (1999). Low-speed wind tunnel testing, Wiley and Sons, New York.
Basset, D., Kyle, C., Passfield, L., Broker, J. & Burke, E. (1999). Comparing cycling world
hour records, 1967-1996: modeling with empirical data, Medicine & Science in Sports
& Exercise 31(11): 1665–1676.
Blair, K. & Sidelko, S. (2008). Aerodynamic performance of cycling time trial helmets, in
M. Estivalet & P. Brisson (eds), The Engineering of Sport 7, vol. 1, Springer, Paris,
pp. 371–377.
Campanardi, G., Gibertini, G., Pozzi, M. & Quici, M. (2003). La camera di prova aeronautica
della galleria del vento del politecnico di milano (in italian), Proceedings of XVII
Congresso nazionale AIDAA, Roma, Italy, pp. 2073–2077.
Chabroux, V., Barelle, C. & Favier, D. (2008). Aerodynamics of time trial bicycle helmets,
in M. Estivalet & P. Brisson (eds), The Engineering of Sport 7, vol. 2, Springer, Paris,
pp. 401–410.
Defraeye, T., Blocken, B., Koninckx, E., Hespel, P. & Carmeliet, J. (2010a). Aerodynamic study
of different cyclist positions: Cfd analysis and full-scale wind-tunnel tests, Journal of
Biomechanics 43(7): 1262–1268.
491
The Study of Details Effects in Cycling Aerodynamics:
Comparison Between Two Different Experimental Approaches