Wind Tunnels and Experimental Fluid Dynamics Research Part 3 doc
Bạn đang xem bản rút gọn của tài liệu. Xem và tải ngay bản đầy đủ của tài liệu tại đây (8.7 MB, 40 trang )
Wind Tunnels and Experimental Fluid Dynamics Research
68
microns Stokes relations will be valid as indicated by the low Reynolds number (<0.1). Dust
grains can typically be assumed to follow the fluid flow well (the same wind speed and
turbulence). Under the action of external forces (F) such as gravitation, electrostatic or
magnetic affects, the particulates can be assumed to accelerate within a short period of time
(<<1s) and therefore given a uniform field achieve terminal velocity, that is to say reach a
drift velocity at which the external force is balanced by the drift induced drag (U
T
) (Hall
1988, Fay & Sonwalker 1991). Values of the electric field induced drift velocity U
T
have
typically been calculated to be around 1cm/s for fields of order 10KV/m.
The value of this terminal velocity is given in equation 1;
Equation 1 (field induced drift velocity);
=×
Here µ is the molecular viscosity (for air µ = 1.8×10
-5
kg/ms) and r is the dust grain radius.
At the low pressures used in most Mars simulation studies the suspended particulate size is
smaller than the collision distance between gas molecules (the scattering length, λ). Here an
empirical relation can be used to correct for the non uniform nature of the gas, called the slip
factor;
()
1 1257 04 11
λ
λ
=+ + ⋅ − exp(.)
r
S
r
. This factor is of the order of 10 in most Mars
simulation studies, though is typically negligible at ambient pressure.
The simplicity of this relation allows the accumulation of dust within a wind tunnel
environment to be used to quantify (estimate) the force(s) applied to the dust particulates.
This simplicity however relies on the assumption of average particulate properties such as
size, mass, morphology as well as the external forces applied. It also neglects effects of the
flow such as turbulence.
4.4 Dust deposition
At low turbulent flows dust deposition is dominated by gravitational settlement as turbulent
wind speed is small compared to the gravitational terminal velocity. In this case dust deposition
within a wind tunnel will be dominated by settlement onto upward facing surfaces. At higher
wind turbulence it becomes more likely that suspended grains can impact surfaces and
deposition on wind facing surfaces begins to occur. This process of dust deposition is
dependent upon details of the boundary layer flow around surfaces within the wind tunnel.
This near surface boundary layer is conventionally divided into two regions. A region close to
the surface within which the flow velocity increases linearly from zero (at the surface) and shear
stress is transferred by viscous interaction. Outside this region turbulence becomes dominant as
the mechanism for transferring shear stress and the flow velocity increases logarithmically. The
transfer of stress through turbulence occurs through variations in the properties of
macroscopically sized volumes of the fluid. Turbulence is a fundamental property of fluids and
related to variations in velocity, pressure, temperature, etc. Turbulence occurs on all spatial and
temporal scales above the molecular level (Monin & Yaglom 1973.) The concept of an ideal
viscous region (of molecular flow) at the surface is likely to be a simplification and at odds with
the inherently statistical nature of turbulence such that in reality suspended particulates can still
be transported to a surface though with low probability.
At higher wind shear the boundary layer is expected to shrink (spatially) and the turbulence
is expected to increase in agreement with the observed increase in surface impacts by
suspended grains. It is interesting here to note that increased dust deposition (due to high
turbulence) and increased dust removal (due to high surface shear stress) can occur, and in
fact is expected, at the same regions within the wind tunnel.
Wind Tunnels for the Study of Particle Transport
69
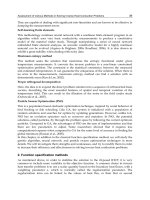
Fig. 14. Aggregated quartz grains (<2µm) deposited on an upward facing surface after wind
tunnel aerosol exposure.
4.5 Dust capture and sensing
Experimentally it is useful to collect suspended dust onto a surface. This could be for use in
compositional or structural analysis or for the determination of concentration. It is not
always sufficient to rely on gravitational or turbulent deposition of dust either because of
the amount of material required or the flow conditions. Methods of enhancing dust
accumulation include applying (attractive) force to the particulates. This could involve the
use of electrical or magnetic fields in the case of electrified or magnetic particulates. This
technique has been used to great effect to study the electrical/magnetic properties of
suspended dust on Mars and in wind tunnel simulators. An alternative technique which is
used industrially and in environmental sciences is the use of a pump system to extract
specific volumes of gas. Suspended particulates can then be accumulated within filters or
onto surfaces. Such systems have not as yet been used in wind tunnel studies, however an
important application of wind tunnels is in the testing and calibration of environmental
sensors and it seems likely therefore that wind tunnels will be used for this purpose in the
future.
Different techniques can be used to quantify the amount of dust captured onto a surface.
Microbalances can be used to determine the accumulated mass (and therefore mass density)
of the suspended dust, this however requires a high degree of detector sensitivity.
Alternatively optical systems could be used to quantify dust deposition. This could involve
the use of imaging or the reflection/transmission of light using optoelectronic systems.
Optical (also laser based) systems have been used successfully here (Merrison et al. 2006).
Wind Tunnels and Experimental Fluid Dynamics Research
70
Fig. 15. Left dust capture on a NASA Phoenix camera calibra-tion-target magnets and a
model of the MSL calibration-target magnets for uni-directional wind. Right quartz dust
capture on an electrostatic electrode (voltage 300V).
4.6 Suspended dust sensing
The scattering of light by suspended particulates is the obvious and by far the most
widespread technique for studying suspended dust aerosols. Modern techniques which are
applied in meteorology include determination of the optical opacity (scattering of sun light).
Such measurements tend to be simple to carry out, however detailed modelling of angular
scattering intensities are required to determine suspended grain size, morphology and
concentration. More advanced and direct systems for determining the spatial distribution of
dust aerosols include the laser based technique LIDAR which is successful both
commercially and in research for example in the study of clouds. This technique is,
however, not well suited for wind tunnel operation.
Within wind tunnels other laser based techniques are used to study dust aerosols. Laser
Doppler Anemometers (LDA) are primarily used for wind velocity sensing. They function
by scattering light from suspended particulates and hence have the added benefit of being
able to quantify the aerosol concentration (number density) typically for particulates of
above around one micron. Further modifications of LDA systems enable the spatial
distribution (multiple dimensions) and grain size to be quantified. In addition to such
commercial sensor systems prototype (miniaturized) instruments are being developed in
order to detect suspended dust and measure flow rates (Figure 16) (Merrison et al. 2004b,
Merrison et al. 2006).
5. Modelling
Computational Fluid Dynamic modelling is in principle a useful technique for identifying
and solving problems with the design of a wind tunnel by detailing the wind flow. It is
however extremely time consuming (compared to typical measurement and even
construction time scales) especially if three dimensional modelling is employed (Peric and
Ferziger 1999). CFD models are also prone to inaccuracies resulting from insufficiently high
time/space resolution (pixelisation). A combination of measurement and modelling is
however a powerful combination to achieve a full understanding of the flow dynamics
within a system (Kinch et al 2005).
Wind Tunnels for the Study of Particle Transport
71
Fig. 16. Prototype laser based sensor system operating in a dust aerosol within the 40 cm Ø
diameter environmental wind tunnel.
As explained in the preceding sections there are fundamental differences in the physics that
control the movement of sand and dust. Therefore the approach to model (analytically or
numerically) the transport of dust and sand follows different principles. In aeolian
transport, saltation is an important link by which momentum is transmitted from the air to
the bed through grain impact, but momentum transfer, impact and subsequent entrainment
take place in a very shallow layer at the air-bed interface with large velocity gradients.
Consequently, in addition to experimental evidence obtained from few and simplified
studies of the splash (e.g. Willetts & Rice 1986, 1989, Mitha et al. 1986) theoretical reasoning
and numerical modelling has played an important role (e.g. Owen 1964, Sørensen 1985,
Anderson & Haff 1988, 1991, McEwan & Willetts 1991, 1993, Shao & Li 1999, Spies &
McEwan 2000). After the sand grains have left the surface they are accelerated by the wind
with trajectories influenced by fluid drag, gravity, particle spin and fluid shear, and electric
forces. This process has been modeled by several authors (e.g. Anderson & Haff 1991,
McEwan & Willetts 1991, Sørensen, 1991, Sørensen 1995, Sørensen 2005 and Kok and Renno
2009). The physics governing the splash, the grain trajectories and the momentum exchange
between the fluid flow and saltating particles has been specifically formulated in the models
mentioned above and is not traditionally dealt with in a CFD-context.
For aerosols where with CFD modelling it is possible to inject virtual particulates within the
flow and trace their transport. It may then be possible to apply external force fields
(gravitational, electrostatic or magnetic) and thereby perform a faithful reconstruction of the
physical conditions within the wind tunnel. In this case an extremely detailed physical
description of an observed phenomenon can be obtained and therefore the dependency
Wind Tunnels and Experimental Fluid Dynamics Research
72
upon for example grain size, mass, electric charge, magnetisation, etc. Also physical
parameters not easily varied in laboratory experiments may be modelled such as varying
gravity (Kinch et al. 2005).
6. Acknowledgements
The authors would like to thank the Villum Kann Rasmussen Foundation, the Villum
Foundation, the Danish Science Research Council and the European Space Agency (ESA)
(Contract No. 21285/08/NL/GLC) for finansial support to building of wind tunnels and
instruments.
7. References
Anderson, R.S. & Haff, P.K. (1991) Wind modification and bed response during saltation of
sand in air. In O.E.Barndorff-Nielsen & B.B.Willetts(Eds) Acta Mechanica Suppl. 1,
21-51.
Bagnold, R.A. (1941) The physics of blown sand and desert dunes. Methuen, London.
Beuselinck, L.; Govers, G.; Poesen, J.; Degraer, G.; Froyen, L. (1998) Grain-size analysis by
laser diffractometry: comparison with the sieve-pipette method. Catena, 32, 193-208.
Chepil, W.S. (1959) Equilibrium of soil grains at the threshold of movement by wind, Soil
Science Society of America Proceedings, 422-428.
Counihan, J. (1975) Adiabatic atmospheric boundary layers: A review and analysis of the
data from the period 1880-1972. Atmospheric environment, Vol.9, 871-905.
Esthel, G.; Levy, G.J.; Mingelgrin,U.; Singer, M.J. (2004) Critical Evaluation of the Use of
Laser Diffraktion for Particle-Size Distribution Analysis. Soil Science Society America
Journal, 68, 736-743.
Fay, J.A. & Sonwalkar, N., (1991) “Fluid Mechanics”, MIT, Boston.
Gartshore, I.S. (1973) A relationship between roughness geometry and velocity profile for
turbulent boundary layers. National Establishment of Canada, Report LTR-LA-140.
Gilbert, J.S., Lane, S.J., Sparks, R.S.J., Koyaguchi, T. (1991) Nature 349, 598.
Greeley, R. & Iversen, J.D. (1985) Wind as a Geological Process on Earth, Mars and Venus.
Cambridge Planetary Science Series. Cambridge University Press, Cambridge.
Greeley, R.; White, B.R.; Pollack, J.B.; Iversen, J.D.; Leach, R.N. (1981) Dust storms on Mars:
Considerstions and simulations. In Péwé, T., editor, Desert Dust: Origin,
Characteristics, and Effect on Man, Geological Society of America Special Paper, 186,
pp.101-21.
Hall, D. J. (1988) Fluid Mechanics. 187, 451-466.
Irwin, H.P.A.H. (1981) The design of spires for wind simulation. J. Wind Eng. Industrial
Aerodynamic, 7, 361-366.
Iversen, J.D. & Rasmussen, K.R. (1999) The effect of wind speed and bed slope on sand
transport. Sedimentology 46, 723 -731.
Iversen, J.D. and Rasmussen, K.R. (1994) The effect of surface slope on saltation threshold.
Sedimentology, 41, 721-728.
Iversen, J.D., Greeley, R., Marshall, J.R. and Pollack, J. (1987) Aeolian saltation threshold:
effect of density ratio. Sedimentology 34, 699-706.
Iversen, J.D., Greeley, R. and Pollack, J.B. (1976) Windblown dust on Earth, Mars and Venus.
The Journal of the Atmospheric Sciences 33, 2425-2429.
Wind Tunnels for the Study of Particle Transport
73
Iversen, J.D. and White, B.R. (1982) Saltation threshold on Earth, Mars, and Venus.
Sedimentology 29, 111-119.
Kinch, K. M. Merrison, J.P., Gunnlaugsson, H. P., Bertelsen, P. Madsen, M. B., Nørnberg, P.
(2005) Preliminary analysis of the MER magnetic properties experiment using a
CFD model. Planetary and Space Science. 54, 28-44.
Klute A. (1986) Methods of Soil Analysis, Part 1, Physical and Mineralogical Methods, SSSA
Book Series,
Madison, Wisc. USA.
Krumbein, W.C. ; Pettijohn, F.J. (1938) Manual of sedimentary petrography. Appelton-
Century-Crofts, N.Y.
Marlow, J.J.; Martins, Z.; Sephton, M.A. (2008) Mars soil analogues. Astronomy and
Geophysics, 49, 2, 2.20-2.23.
Merrison, J.P., Bechtold, H., Gunnlaugsson, H., Jensen, A., Kinch, K., Nornberg, P. and
Rasmussen, K. (2008) An Environmental Simulation Wind Tunnel for Studying
Aeolian Transport on Mars, Planetary and Space Science, 56, 426-437.
Merrison, J.P., Gunnlaugsson, H.P., Nørnberg, P., Jensen, A.E., Rasmussen, K.R. (2007)
Determination of the Wind Induced Detachment Threshold for Granular Material
on Mars using Wind Tunnel Simulations, Icarus, 191, 568-580.
Merrison, J.P., Gunnlaugsson, H.P., Kinch, K., Jacobsen, T.L., Jensen, A.E., Nørnberg, P.,
Wahlgreen, H. (2006) An integrated laser anemometer and dust accumulator for
studying wind induced transport on Mars, Planetary and Space Science, 54, 1065-
1072.
Merrison, J.; Jensen, J.; Kinch, K.; Mugford, R.; Nørnberg, P., (2004a) The electrical properties
of Mars analogue dust, Planetary and Space Science; 52: 279-290
Merrison, J.P.; Gunnlaugsson, H.P.; Jensen, J.; Kinch, K.; Nørnberg, P.; Rasmussen, K.R.
(2004b) A Miniature Laser Anemometer for Measurement of wind speed and dust
suspension on Mars, Planetary and Space Science; 52(13): 1177-1186.
Merrison, J.P.; Bertelsen, P.; Frandsen, C.; Gunnlaugsson, H.P.; Knudsen, J.M.; Lunt, S.;
Madsen, M.B., Mossin, L.A.; Nielsen, J.; Nørnberg, P.; Rasmussen, K.R. ; Uggerhøj,
E. J. (2002) Simulation of the Martian Aerosol at Low Wind Speed. J. Geophysical
Research-Planets, 107, 5133-5141.
Monin, A.S. & Yaglom, A.M. (1973) Statistical Fluid Mechanics: Mechanics of Turbulence
Volume 1, MIT Press.
Morris, R.V.; Golden, D.C. Ming, D.W.; Shelfer, T.D.; Jørgensen, L.C.; Bell III, J.F.; Graff,
T.G.; Mertzman, S.A. (2001) Phyllosilicate-poor palagoniteic dust from Mauna Kea
Volcano (Hawaii): A mineralogical analogue for magnetic Martian dust? Journal of
Geophysical Research-Planets, 106, E3, 5057-5083.
Moroz, L.V.; Basilevsky, A.T.; Hiroi, T.; Rout, S.S.; Baither, D.; van der Bogert, C.H.;
Yokovlev, O.I.; Fisenko, A.V.; Semjonova, L.F.; Rusakov, V.S.; Khramov, D.A.;
Zinovieva, N.G.; Arnold, G.; Pieters, C.M. (2009) Spectral properties of simulated
impact glasses produced from martian soil analogue JSC Mars-1. Icarus, 202, 336-
353.
Nørnberg, P.; Gunnlaugsson, H.P.; Merrison, J.P.; Vendelboe, A.L. (2009) Salten Skov I: A
Martian magnetic dust analogue. Planetary and Space Science, 57, 628-631.
Wind Tunnels and Experimental Fluid Dynamics Research
74
Nørnberg, P.; Schwertnamm, U.; Stanjek, H.; Andersen, T.; Gunnlaugsson, H.P. (2004)
Mineralogy of a burned soil compared with four anomalously red Quaternary
deposits in Denmark. Clay Minerals, 39, 85-98.
Nørnberg, P. (2002) Particle comminution and aeolian addition in young dune sand soils.
Transactions, 17
th
. World Congress of Soil Science, Bankok, Thailand, Symp. No
25,Paper no 1124.
Owen, P.R., 1964. Saltation of uniform grains in air. Journal of Fluid Mechanics 20, 225-242.
Peric, M. & Ferziger, J.H. (1999) Computational Methods for Fluid Dynamics, Springer, 2 Ed.
Pettijohn F.J. (1957) Sedimentary Rocks, Harper and Row, N.Y
Rasmussen, K.R., Kok, J.F., Merrison, J.P. (2009) Enhancement in wind driven sand transport
by electric fields, Planetary and Space Science, 57, 804-808.
Rasmussen, K.R. & Sorensen, M. (2008) Vertical variation of particle speed and flux density
in Aeolian saltation measurement and modeling, J. Geophysical Research- Earth
Surface 113(F2), F02S12.
Rasmussen, K.R., Iversen, J.D. and Rautaheimo, P. (1996) Saltation and wind flow
interaction in a variable slope wind tunnel. Geomorphology, 17, 19-28.
Rasmussen, K.R. & Iversen, J.D. (1993) A variable slope wind tunnel for testing wind-blown
sand. Proc. 7
th
U.S. National Conference on Wind Engineering. Vol. 2, pp. 643-552.
University of California at Los Angeles.
Rasmussen, K.R. and Mikkelsen, H.E. (1991) Wind tunnel observations of aeolian transport
rates. In: O.E. Barndorff-Nielsen and B.B. Willetts (eds) Acta Mechanica, Suppl. 1,
135-144.
Raupach, M.R. (1991) Saltation Layers, Vegetation Canopies and Roughness Lengths. In
O.E.Barndorff-Nielsen & B.B.Willetts(Eds) Acta Mechanica Suppl. 1, 135-144.
Scheffer & Schachtschabel (1998) Lehrbuck der Bodenkunde, Ferd. Enke Verlag, Stuttgart.
Stow, C.D. (1969) Weather 24, 134.
Schmidt, D.S., Schmidt, R.A., Dent, J.D. (1999) Electrostatic force in blowing snow. Boundary-
Layer Meteorology, 93 (1), 29–45.
Tanner, W.F. (1969). The particle size scale. Journal of Sedimentary Petrology, 39,2, 809-812.
Ulery, A.L. & Drees R. (2008) Methods of Soil Analysis, Part 5 – Mineralogical Methods,
SSSA Book Series, Madison Wisc. USA.
Williams, G., (1964) Some aspects of the eolian saltation load. Sedimentology 3, 257-287.
Wooding, R.A., Bradley, E.F. and Marshall, J.K. (1973) Drag due to regular arrays of
roughness elements of varying geometry. Boundary-Layer Meteorology 5, 285-308.
4
Wind Tunnel Flutter Testing of Composite
T-Tail Model of a Transport Aircraft
with Fuselage Flexibility
Raja Samikkannu
1
and A. R. Upadhya
2
1
Scientist,
2
Director,
National Aerospace Laboratories (CSIR-NAL),
Bangalore,
India
1. Introduction
Aeroelasticity is the study of interaction among aerodynamic, inertial and elastic forces.
Flight vehicles experience steady and unsteady aerodynamic loads; accordingly they would
develop different kinds of stability and response related problems. Transonic aeroelastic
problems such as buffet and flutter have been solved through experimental techniques at
National Aerospace Laboratories (Upadhya et al., 1985), (Joshi et al., 1988), (Ramamurthy
and Raja, 2002), (Raja et al., 2007). Figure 1 shows the aeroelastic models that were tested in
1.2 m wind tunnel. Aeroelastic flutter is a catastrophic structural failure, which needs to be
avoided within the flight envelope of an aircraft for safe operation and enhanced fatigue life
(FAR AC 25.629-1A). Aircraft structures made of thin walled sections and composite
materials are usually lightly damped systems. When the orthogonality of elastic modes in
such systems is influenced by the unsteady aerodynamic forces, the aerodynamic damping
destabilizes the vibration, meaning the structural modes may draw energy from the air
stream. Frequency and damping change due to aerodynamic energy may cause coupling
between two or more adjacent modes to develop a flutter in the aircraft wing or tail
structure. Flutter is a divergent oscillation that may result into fatal structural failure.
Low speed aircrafts need clean airflow over the tail surfaces to have better pitch control.
Therefore a T-Tail configuration is preferred for such flying machines due to its geometric
location. Aircrafts with T-Tail structure are in operation; for example Boeing 727, ATR-72, Q-
400, CRJ700 and Embaraer ERJ145 etc. Nevertheless, aeroelastic problems such as flutter and
gust are of great concern for the designers because the structurally heavy vertical stabilizer
needs to carry the lift producing horizontal tail, which makes T-Tail a structure of concern in
the low speed aircraft (Bisplinghoff et al., 1983). The present research work addresses the T-
Tail flutter of a transport aircraft within its flight envelope through a wind tunnel study. The
T-Tail configuration is normally expected to develop a dynamic coupling among its
horizontal and vertical stabilizers’ modes and participate in the aeroelastic flutter along with
the control surface modes (Rudder, Elevators). Since for the aircraft under consideration
(transport), the fuselage flexibility is appeared to be very significant on the empennage
Wind Tunnels and Experimental Fluid Dynamics Research
76
flutter, a scaled T-Tail wind tunnel model has been designed with a flexible fuselage. Unlike
the conventional horizontal tail plane, the horizontal tail sits on the top of a flexible fin in T-
Tail, therefore may experience rolling, yawing and spanwises in-plane motion, in addition
to pitching and plunging.
Fig. 1. Aeroelastic models in 1.2 m NAL trisoninc tunnel
Thus, in-plane loads and normal loads due to in-plane motion become important while
calculating T-Tail flutter, which can be easily captured through wind tunnel testing.
Otherwise, an improved DLM (Doublet Lattice Method) code is required that accounts for
all the aerodynamic degrees of freedom in the calculation of flutter. Further the incremental
aerodynamic loads due to roll and yaw acting on the horizontal tail plane are dependent on
the steady aerodynamic loads; therefore inclusion of steady loads in the flutter analysis is
important (Queijo, 1968). Thus, the present experimental approach to build an
aeroelastically scaled T-Tail model with a flexible fuselage to estimate empennage flutter
appears to be convincing.
However, it has become a challenging design issue to introduce fuselage longitudinal
bending due to a sting supported system and further the simulation of multi-modes
coupling. A novel idea is then commenced into the model design scheme to incorporate the
fuselage bending along with the sting bending mode. Composite materials are employed to
realise the structural components of the T-Tail and fuselage structure. The model is
subsequently instrumented with strain gauges and accelerometers to measure the
aeroelastic responses during the wind tunnel testing. The flutter characteristics are then
presented in velocity versus frequency and velocity versus damping format.
(a) (b)
(c) (d)
Wind Tunnel Flutter Testing of Composite
T-Tail Model of a Transport Aircraft with Fuselage Flexibility
77
2. Design of scaled aeroelastic model
The aeroelastic model consists of the following components:
• Horizontal tail and elevators
• Vertical tail and rudder
• Torsion box assembly to attach the spars of the vertical tail
• Flexible fuselage
• Model supporting system
The results obtained from the wind tunnel testing are acceptable, only if the model
simulates both aerodynamic and structural dynamic characteristics with respect to full scale
vehicle (Bisplinghoff et al., 1983), (Megson T. H. G., 2007). This is achieved through a set of
dynamic similarity laws, known as aeroelastic scale factors (Refer to table 1). A dynamically
similar model only simulates frequencies and mode shapes. In contrast, an aeroelastically
similar model additionally replicates the aerodynamic configuration of the vehicle. The
aircraft model has been tested in 1.2 m wind tunnel. Figure 2 displays the side view of the
model along with its sting mounting support system.
Geometric scale ratio L = Lm/Lp
Dynamic pressure ratio q = qm/qp
Density ratio
ρ = ρm/ρp
Velocity ratio V = Vm/Vp
Weight ratio W = Wm/Wp
Frequency ratio
Ω = Ωm/Ωp
Deflection ratio
δ = δm/δp
Flexural Stiffness ratio (EI)m/(EI)p
Axial Stiffness ratio (EA)m/(EA)p
Table 1. Aeroelastic scale parameters
Fig. 2. Aircraft model with a sting support system
SCHLIEREN WINDOW
CENTER LINE
MODEL CART
SEAL FACE
MODEL SUPPORT
MOUNTING POD
STING ADAPTER
STING
Flow direction
Wind Tunnels and Experimental Fluid Dynamics Research
78
In order to accommodate the model in the test section of the wind tunnel, a 10% geometric
scale is chosen for the specified test condition. Proper care is taken to minimize the blockage
area (around 2%), so that there will not be any starting problem for the tunnel. Accordingly,
the aeroelastic scale factors have been arrived for a fair representation of the mathematical
analogue of the physical system, considering the fluid - structure interaction.
2.1 Model design details
Flight conditions such as flight dynamic pressure, flight altitude, air density, flight velocity
and Mach number are taken as reference data for the design process. As a first step, suitable
scale factors are derived, which would suit the model characteristics to the existing wind
tunnel characteristics. The blow down type wind tunnel has limitation in terms of its test
section, achievable dynamic pressure and run time etc. Therefore the geometric scale and
dynamic pressure ratio are mostly the deciding factors to set the aeroelastic scales. The T-
Tail model is designed following a replica design logic, in which a spar-rib-skin
arrangement is maintained. Further, the same number of spars as in the full scale vehicle is
considered at the model level. However the number of ribs is taken according to the model
stiffness requirement. Figures 3, 4 present the design details of both horizontal tail plane
(HTP) and vertical tail plane (VTP), respectively. HTP is constructed with two spars and
VTP is made using three spars arrangement. All dimensions are given in mm. The control
surfaces (elevators, rudder) are also built with spar-rib-skin construction. Fuselage is
designed with metallic/composite bulkheads and stiffeners, over which a composite skin
(CFRP) is provided (Refer to figure 5).
Due care is taken in the selection of appropriate materials for making the model, considering
the feasibility of fabrication and availability of materials. The designed model has got nearly
70% composite components (CFRP) and the remaining is metallic. The model is required to
be mounted in the specified test section of the wind tunnel, so that the T-Tail is exposed to a
set and necessary flow characteristics such as Mach number, dynamic pressure etc.
Therefore a sting adapter is introduced into the model supporting system (Figure 2). Thus,
the designed T-Tail is pushed forward to experience the actual and set wind tunnel flow
characteristics. Because of this increased exposure length of the sting, there is a need to
provide sufficient torsional stiffness in order to ensure the stability and strength of the
fuselage. Hence five additional CFRP disc type bulk heads have been incorporated in the
front fuselage along with a CFRP tubular structure as core, which gets connected to the
sting.
2.2 Design details of joints for sub-structural systems
To build an efficient aeroelastic T-Tail model, the joint flexibility of all the sub-structural
systems must be appropriately simulated. Figure 6 (a, b, c, d) depicts the various joints,
which are designed to integrate all the sub-systems. For example the control surfaces
(elevator, ruder) are connected to the main surfaces with the help of torque tubes, designed
to provide the required control-circuit stiffnesses.
By ensuring a proper rotational stiffness, the ruder and elevator fundamental modes are
simulated.
The elevator torque tube has connected to both left and right elevators, so that they act as a
single control surface. The spars of VTP are positioned in a torsion box assembly (figure 5-
d), in order to reproduce the necessary flexibility as in the full scale vehicle.
Wind Tunnel Flutter Testing of Composite
T-Tail Model of a Transport Aircraft with Fuselage Flexibility
79
74.31
160
28.53032.532.532.632.432.532.539.5
20
95°
RIBS
HT SPARS
ELEVATOR SPAR
609
Fig. 3. Horizontal tail plane assembly
63.50
72.13
44.45
25.77
44.87
135.53
71.71
52.93
44.17
73.57
VT SPARS
RIBS
DORSAL
FIN
FRL
289.50
62°
RUDDER
SPAR
Fig. 4. Vertical tail plane assembly
2.3 Model fabrication and integration
After freezing the design, the production drawings are prepared using AUTOCAD 2000.
The composite components are fabricated by using appropriate moulds.
Skin/bulkhead/spar type of construction is adopted for fabricating the 10% fuselage. Along
its length, the model fuselage consists of two circular aluminium rings, seven aluminium
disc type bulkheads and five composite discs (not shown in figure 5). The skeleton is further
stiffened using sets of side and top spars made of aluminium. CFRP skin of uniform
thickness is fabricated in two halves using hand lay-up process and cured at room
temperature. Nearly 40% resin content is achieved in the cured component.
VTP is constructed in spar-rib-skin form. It has got three aluminium spars and eighteen
balsa ribs (refer to figure 4). A uniform thickness CFRP skin (top & bottom) is made to get
the required aerodynamic shape. The mould is built in such a way that it could
accommodate as well the rudder skin. Further, the rudder is constructed using a single
aluminium spar with balsa ribs and CFRP skin. In a similar way HTP moulds (top and
bottom) are fabricated first, which have got provision to include elevator skin. HTP is made
Wind Tunnels and Experimental Fluid Dynamics Research
80
Fig. 5. Fuselage skin, bulk heads, and stiffeners with mould
Fig. 6. Mechanical joints for structural components integration and flexibility simulation
(a) Torsion box
assembl
y
(b) HT-VT
hin
g
e
(c) Elevator torque
tube assembl
y
(d) Rudder
tor
q
ue
FS
MS
RS
CFRP skin
Wind Tunnel Flutter Testing of Composite
T-Tail Model of a Transport Aircraft with Fuselage Flexibility
81
of two aluminium spars with twenty balsa ribs (refer to figure 3). A uniform CFRP skin is
provided in two parts (top & bottom) to give the required aerodynamic shape. The model
supporting system essentially consists of a sting and an adapter. A sting with required
strength and dimension is manufactured using EN24 material (Ultrasonic tested for flaws).
Adapter is also fabricated with the same type of material, satisfying the strength adequacy
requirements.
After the fabrication of major components (spar/rib/skin etc), each component is
independently weighed and checked for its mass simulation. Hinges are fabricated using
aluminium material for connecting the control surfaces to main surfaces. The assembled sub
structural systems are weighed and checked for their required mass. The VTP spars are
positioned inside the torsion boxes, which are mounted on the rear bulkheads of the
fuselage. Then HTP assembly has been attached to VTP.
3. Vibration analysis and test correlation
A detailed free vibration analysis is performed on the designed T-Tail structure using MSC-
NASTRAN (refer to figure 7). The analysis is carried out attaching the fuselage at three
support points with sting, which has been fixed at one end (simulating the tunnel sting
mounted condition). The fabricated model is appropriately instrumented with
accelerometers and strain gauges to measure the structural responses. After the
instrumentation, the model is subjected to ground tests (both static and dynamic). Ground
tests are essential for two reasons, one is to check the achieved accuracy of dynamic
simulation and the second is to extract the static and dynamic characteristics of the model.
The Kyowa make strain gauges and PCB type accelerometers (sensitivity: 100 mv/g) are
used. The gauges are surface bonded and connected by using thin multi strand Teflon wires.
Further they are numbered and terminated outside the model. Static tests are conducted by
loading the structure at its Cp to monitor the strain output on the model at different
locations to verify the model strength, as well as support system’s ability to carry the model
weight and the aerodynamic forces. The dynamic testing is subsequently performed from
component level to fully assembled model. This exercise has helped to fine tune the
dynamics of the integrated structure in a befitting way. However, the results are presented
in a concise manner for the integrated model only (See table 2).
ModeNo.
Frequency (Hz)
Remarks
GVT
(proto)
Experiment
(Model)
FEM
(Model)
1 66.04 64.11 66.40 Rudder rotation
2 102.65 100.28 102.8 Elevator rotation
3 105.17 97.67 96.67 HT anti-symmetric bending
4 149.50 149.92 151.1 VT longitudinal bending
5 170.28 174.24 162.8 VT lateral bending
6 207.72 211.90 209.8 HT symmetric bending
7 281.49 327.23 285.5 Fuselage first longitudinal bending
Table 2. Comparison of experimental and analytical results (Frequency ratio = 9.315)
Wind Tunnels and Experimental Fluid Dynamics Research
82
A detailed modal testing is conducted using LMS SCADAS -III/ CADA-X/Modal Analysis
software. The model is subjected to 50% burst random force and the responses are therefore
measured by the accelerometers. The transfer function technique is adopted to extract the
natural frequencies, associated mode shapes and the corresponding damping values of
various modes of the model (refer to table 2 and figures 8,9).
Fig. 7. FE analysis based mode shapes of the model
3.1 Divergence clearance
Since the model supporting system is slender body, it demands clearance from divergence
instability prior to the wind tunnel testing (Sundara Murthy, 2005).
The following data are used in the static divergence calculation.
• Values of lift and moment coefficients for different angles of attack
• Centre of pressure (Cp)
for the Mach number and dynamic pressure of interest.
In order to calculate the divergence parameters, the sting and adapter assembly is loaded
at Cp and as well as at its tip (equivalent static aerodynamic load ≈ 50 kg, C
L
=1.0). The
deflections are measured at the strain gauge locations (reaction points). Using the
following relations (Sundara Murthy, 2005), the divergence parameters are estimated as
follows:
(b) Elevator rotatio
n
(a) HTP Anti-symmetric bending
(c) VTP lateral bending
(d) HTP Symmetric bending
Wind Tunnel Flutter Testing of Composite
T-Tail Model of a Transport Aircraft with Fuselage Flexibility
83
()
12 12
D = qS
2
NN NN
RM N N
N
lC xC C
l
aa a
dd dd
éù
æö
æö
-+
÷
ç
÷
êú
ç
÷
++
ç
÷
ç
÷
÷
êú
ç
÷
ç
÷
ç
èø
èø
êú
ëû
,
D = 0.125 < 0.2.
(
)
()
00
D C
θ =
1
D
a +
D
-
,
()
12 12
000 0
C = qS
2
NN NN
RM N N
N
lC xC C
l
dd dd
éù
æö
æö
-+
÷
ç
÷
êú
ç
÷
++
ç
÷
ç
÷
÷
êúç
÷
ç
÷
ç
èø
èø
êú
ëû
,
θD = 0.5278
°
< 3°.
(a) HTP anti-symmetric bending (b) Rudder rotation
(c) HTP symmetric bending (d) Fuselage bending
Fig. 8. Few experimental mode shapes (GVT)
It has been seen that the supporting system is free from the static divergence instability in
the proposed test envelope.
Wind Tunnels and Experimental Fluid Dynamics Research
84
4. Wind tunnel testing
The wind tunnel testing is done, following the dynamic pressure variation as shown in table
3. The model needs to show flutter free condition in order to qualify the full scale T-Tail for
a Mach number of 0.42.
Mach No 0.2 0.25 0.3 0.35 0.4 0.45
q
d
y
namic
(PSI) 1.36 2.1 2.95 3.94 5.0 6.16
Table 3. Wind tunnel test matrix
The 10% aircraft T-Tail model has been tested in 1.2 m wind tunnel (refer to figure 10). The
aeroelastic scale parameters are applied to obtain a replica model through optimization
process for the full scale T-Tail configuration. It has been shown through ground vibration
testing that the necessary dynamic characteristics have been achieved fairly by the
fabricated model (see table 2). The longitudinal fuselage mode has been simulated along
with the sting bending mode. This is observed to be a quite reasonable simulation from the
complexity point of view of simulating a free-free boundary effect through spring-sting
arrangement. The tunnel tests are completed with 22 runs (blow downs) to cover the
required dynamic pressure and Mach number range. During the wind tunnel testing, the
data has been collected through ‘Throughput Acquisition Monitor’ of LMS® for multiple
channels concurrently (refer to figure 11). The measured aeroelastic data from the
accelerometers, positioned at different locations is processed with ‘Operational Modal
Analysis’ software of LMS®. This software has got computational algorithms such as poly
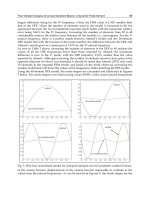
reference and balanced realization etc, using which the damping is estimated. The
frequencies and damping values obtained from the flutter experiments are presented,
following classical V-g approach in figure 12.
Fig. 9. Modal response during GVT
Wind Tunnel Flutter Testing of Composite
T-Tail Model of a Transport Aircraft with Fuselage Flexibility
85
Fig. 10. Aircraft model in wind tunnel
5. Observations
• The aircraft model is tested in the Mach range of 0.2 to 0.45
• The T-Tail has not shown any trend of flutter in the tested Mach numbers and dynamic
pressures, thus qualify from flutter in the aircraft flight envelope
• Test results have shown that HTP-Symmetric bending and VTP-in-plane bending
modes have nearly 2% aerodynamic damping at maximum test dynamic pressure (5
PSI) in addition to structural damping
• Fuselage longitudinal bending mode does not appear to be influenced by aerodynamic
damping and the mode shows a nearly constant structural damping
6. Conclusion
This research work presents the details of fabrication, ground and wind tunnel testing of a
scaled aeroelastic model of T-Tail with a flexible fuselage. Using composite materials and
optimization procedures the required dynamics, namely frequencies and mode shapes of
the T-Tail are achieved, which includes two control surface modes. After conducting a
thorough ground studies, the model has been tested in 1.2 m Trisonic Wind Tunnel for the
flutter clearance of T-Tail in the subsonic aerodynamic regime. The flutter characteristics are
obtained as classical velocity versus damping and velocity versus frequency plots. The
flutter experiments are carried out to cover a Mach range of 0.2 to 0.45. The critical modes of
the T-Tail have not shown any dynamic instability nature at critical flight velocity 141.33
m/sec. Also, the total damping (Structural and Aerodynamic) of the critical modes are
noticed to be around 2%. This fact has ensured that the T-Tail is qualified from flutter at
maximum diving velocity.
Wind Tunnels and Experimental Fluid Dynamics Research
86
(a)
(b)
Fig. 11. Wind tunnel test results
Wind Tunnel Flutter Testing of Composite
T-Tail Model of a Transport Aircraft with Fuselage Flexibility
87
-6
-5
-4
-3
-2
-1
0
Experimental (100.28 Hz)
Curve Fit (100.28 Hz)
Experimental (149.92 Hz)
Curve Fit (149.92 Hz)
Experimental (211.9 Hz)
Curve Fit (211.9 Hz)
Experimental (327.23 Hz)
Curve Fit (327.23 Hz)
Damping (%)
Flutter Margin
Flutter Qualification
60 80 100 120 140 160 180
50
100
150
200
250
300
350
0
Frequency(Hz)
Velocity(m /s
2
)
Fig. 12. Velocity vs. frequency and damping for critical modes
7. Acknowledgment
The authors wish to thank the contributors of this team work, namely Mrs. Shashikala
Rajappa, Mr. D Sundararajan, Mr. S Janardhanam, Mrs. Annamma Samuel, Mr. Mutturaj H
Medar and Mr. D Dwarakanathan, Scientists, Structural Technologies Division, National
Aerospace Laboratories (NAL). Thanks are due to Mr. Ramachandra and his team, EAD, for
their excellent fabrication work towards realizing the 10 percent aeroelastic model. We also
would like to appreciate the Scientists of NTAF, NAL for their technical coordination and
contribution. The fabrication of metallic parts from ESD, NAL has been duly acknowledged.
8. Nomenclature
L
m
= Length of the model
Subscripts:
L
p
= Length of the full scale vehicle m = model
q
m
= Dynamic pressure in the tunnel p = proto
q
p
= Flight dynamic pressure GVT = ground vibration testing
V
m
= Velocity of flow in the tunnel FS =Front spar
V
p
= Flight velocity MS = Middle spar
ρ
m
= Density of air in the tunnel RS = Rear spar
ρ
p
= Density of air at flight altitude HTP = Horizantal tail plane
W
m
= Weight of the model VTP = Vertical tail plane
Wind Tunnels and Experimental Fluid Dynamics Research
88
W
p
= Weight of the vehicle
Ω
m
= Frequency of the model
Ω
p
= Frequency of the vehicle
δ
m
= Deflection on the model
δ
p
= Deflection on the full scale vehicle
EI = Bending rigidity
EA = Axial stiffness
D = Static divergence parameter
θD
= Angular deflection of model-balance sting system
q = Dynamic Pressure
S = Reference area (Projected area of Fuselage, HTP and Elevator)
N
C
a
= Local slope of
L
C
vs a plot at a = 5°
M
C
a
= Local slope of
M
C vs a plot at a = 5°
M
o
C = Intercept of the tangent to
M
C vs a plot
No
C = Intercept of the tangent to
L
C
vs a plot
N
l
= Distance between front and rear attachment points
R
l
= Reference length of pitching moment coefficient
x = Distance between C
p
and centre balance attachment point
1N
d
= Deflection per unit normal force at front attachment point
2N
d
= Deflection per unit normal force at rear attachment point
0
a
= Initial angle of attack of the model
L
C
= Lift coefficient
M
C
= Pitching moment coefficient
a
= Angle of attack
9. References
Upadhya, A. R. et al. (November 1985). Aeroelastic Testing of ASLV Models for Predicting
Transonic Buffet Response- Wind Tunnel Testing and Data Analysis, NAL PD-ST
8523.
Joshi A. et al. (December 1988). Aeroelastic Testing of PSLV Models, NAL PD-ST 8833.
Rama Murthy, M. R. and Raja, S. (July 2002). Aeroelastic Testing on LCA Wing Model with
R73E Missile, NAL PD ST 0212.
Raja, S. et al. (May 2007). Transonic Buffet Response Study of gsLVM3 through Aeroelastic
Model Testing : Wind Tunnel Testing and Data Analysis, NAL PD-ST 0712.
Bisplinghoff, R. L., Ashley, H. & Halfman, R. L. (1983). Aeroelasticity, Addison – Wesley
Publishing Company Inc.
Queijo, M. J. (1968). Theory for computing span loads and stability derivatives due to sideslip,
yawing, and rolling for wings in subsonic compressible flow, NASA TN D-4929.
Sundara Murthy, H. (March 2005). A Method for Static Divergence Analysis of Sting -
Mounted Wind Tunnel Models, NAL PD NT 0508.
Megson, T. H. G. (2007). An Introduction to Aircraft Structural Analysis, Elsevier Pub.
5
Wind Tunnel: A Tool to Test the Flight
Response to Semiochemicals
Yooichi Kainoh
University of Tsukuba
Japan
1. Introduction
Semiochemicals mediate interactions between organisms (Law and Legnier, 1971), and the
term is subdivided into two major groups, pheromones and allelochemicals, depending on
whether the interactions are intraspecific or interspecific (Nordlund, 1981). Insect
pheromones are the main research target for semiochemicals, because of potentials for
practical use in agriculture. A wind tunnel is one olfactometer used as a bioassay method of
olfactory stimuli. Wind tunnel tests have been widely used in insect pheromone research
(e.g., Baker and Linn, 1984; Kainoh et al., 1984; Hiyori et al., 1986a,b), to study plant volatiles
as kairomones (e.g., Kainoh et al., 1980) and to study synomones (e.g., Kainoh et al., 1999;
Fukushima et al., 2001, 2002; Ichiki et al., 2008, 2011).
Sabelis and van de Baan (1983) used a Y-tube olfactometer and determined that predacious
mites responded to the odors of plants infested with spider mites. This was the first
demonstration of a tri-trophic interaction in which predators or parasitoids are attracted by
plants infested with herbivore prey or hosts. Studies on the effects of volatile materials
(Herbivore Induced Plant Volatiles, HIPVs) on the behaviors of natural enemies were
conducted with olfactometers and wind tunnels as indicated by van Driesche and Bellows
(1996).
2. Structure of wind tunnel
2.1 Laboratory conditions (temperature, humidity)
When a wind tunnel is set up it is necessary to consider what laboratory is suitable for the wind
tunnel. If a laboratory has an exhaust fan on the wall, the downwind end of the tunnel can be
connected to the fan (Fig. 1). However, air must be provided from a corridor through a louver
on the door. In a closed laboratory, air must be recycled in a wind tunnel and a charcoal filter
fixed at the upwind end (Fig. 2). A laboratory with a ventilation system is ideal for setting up a
wind tunnel. The downwind end of the tunnel can be connected to the exhaust inlet (Fig. 3).
Temperature can be controlled by adjusting the air-conditioning system, but sometimes it is
very difficult to change the temperature of a large system. We used to use an electric heater
during the winter to increase the room temperature to 25˚C.
For a humidifier, we fixed an electrode steam humidifier (resN200, presently CP3PRmini, PS
Company Ltd., Tokyo, Japan) on the wall of the tunnel (Fig. 6) to maintain a humidity
greater than 50-60% R.H., this humidifier is even used in midwinter when the outdoor
temperature is below 0˚C. Insects do not respond well below 50% R.H.
Wind Tunnels and Experimental Fluid Dynamics Research
90
Fig. 1. Pulling-air type wind tunnel.
Fig. 2. Pushing-air type wind tunnel to recycle the air.
Wind Tunnel: A Tool to Test the Flight Response to Semiochemicals
91
Fig. 3. Pushing- and pulling-air type wind tunnel.
2.2 Cylindrical or rectangular?
Two types of wind tunnels are used in entomological research: cylindrical and rectangular
types. In our laboratory, we use a cylindrical tunnel for testing insect sex pheromones because
the sex pheromone sample is hung from the ceiling of the tunnel, and a rectangular one to test
responses of insect parasitoids to plant volatiles because the flat floor is convenient for placing
potted plants. As Baker and Linn (1984) reported, there is no substantial difference between
the two types of tunnels. From my point of view, an ideal air current can be produced with a
cylindrical wind tunnel rather than a rectangular one because air currents are retarded at the
corners of a rectangular tunnel. If insects fly into the corner of a tunnel, they may perceive
lower concentrations of the odor coming from the upwind end.
2.3 Pulling-air and pushing-air type
One type of tunnel is the pulling-air type (Fig. 1), and another is the pushing-air type
(Fig. 2, 3). As Baker and Linn (1984) pointed out, pushing-air type tunnels do not disturb
the plume. Opening the window for insect handling does not disturb the air stream in the
pushing-air type tunnel (Fig. 2, 3). Therefore, insects on the releasing platform can
directly perceive the odor immediately after being released without any disturbance in
the air stream. In our experiments, a laminar air stream of incense smoke can be observed
even with the windows open. In the case of the pulling-air type wind tunnel (Fig. 1),
insects on the releasing platform perceive disturbed air movement when released, but the
air current gradually becomes normal after the window is closed. In addition, air should
not leak from the tunnel wall and all windows must be tightly closed.