Advances in Analog Circuits Part 3 ppt
Bạn đang xem bản rút gọn của tài liệu. Xem và tải ngay bản đầy đủ của tài liệu tại đây (1.51 MB, 30 trang )
New Port Modeling and Local Biasing of Analog Circuits
49
I
N
R
eq
y
x
V
Th
R
eq
x
y
N
A resistive circuit
with independent
& s elf -d ep .
sources
x
y
(c)(b)
(a)
Fig.
1. (a) A two terminal linear resistive circuit; (b) Thevenin, and (c) Norton equivalent circuit.
y
x
124*Ib
5 V
0.5 V
2 KΩ
25 KΩ
200 Ω
Ib
x
y
2 KΩ
2.5 V
Ix
vx
2.5 V
1.25 mA
0,0
(a)
(c )
(b)
N
T
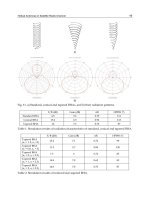
Fig. 2. (a) A simplified small signal equivalent circuit of a single stage BJT amplifier; (b) the
Thevenin equivalent circuit; (c) the port’s characteristic curve, indicating the linearity.
However, despite their simplicity, there is a rigidity involved in port representation by
either the Thevenin or Norton equivalent circuits. As indicated in Fig. 2(c), Thevenin or
Norton model occupy only one point on the characteristic line, where the line meets one of
the axis. This characteristic line also serves as a load line in some biasing situations, where it
identifies the port’s operating point (Q-point) when the two characteristic curves from both
sides of the port cross. The limitation for Thevenin or Norton model is that it represents only
the “sourcing” network with no information given about the “target” network, unless the
two are connected and the analysis is done with the combined circuit. This of course fits
with most circuit applications where all we need is a simplified two terminal linear circuit
that gets connected with the target circuit for the rest of the process; but again, we perform
the analysis only when the two are combined. The circuit complexity created this way may
not be so evident for a single port connection, but for multiple ports the complexity may get
quite significant. There are other cases where circuits in both sides of a port need to get
engaged in some (sources or components) exchanges; hence a more dynamic port modeling
may be needed. Examples can be found in source transformation, noise-source modeling,
and power transport cases. Port nullification is another example that uses Hybrid modeling,
as discussed next.
2. Hybrid equivalent circuit
A Hybrid equivalent circuit, or simply an H
~
-model, of a two-terminal network is a
generalized version of Thevenin or Norton equivalent circuit; for resistive circuits it consists
Advances in Analog Circuits
50
of a voltage source, a current source and an equivalent resistance, R
eq
, which is identical th
that in the Thevenin or Norton model. Apparently here one source, V
H
or I
H
, can be selected
arbitrarily and the other source is found through Eq(2).
H
HN
e
q
V
II
R
=−
or
HThHe
q
VV IR
=
−
(2)
Note that, like the Thevenin or Norton models, here only two measurements are needed to
get all H
~
-model parameters. For example, for a selective value of I
H
and two measurements
of V
Th
and I
N
, Eqs. (1) and (2) can be used to obtain R
eq
and V
H
for the model. Now, consider
two networks N
1
and N
2
connected through port j(V
j
, I
j
), as shown in Fig. 3. There are two
types of H
~
-models for the linear two terminal network N
1
. Type 1 H
~
-model is shown in
Fig. 4(a). To find this model first open circuite the port where I
j
= 0. By referring to Fig. 4(a)
and considering Eq.(2) we get
j
HHe
q
Th
VV IR V
=
+= (3)
Next, short circuit the port terminals to get V
j
= 0, and find
/
j
HHe
q
N
IIVR I
=
+= (4)
In Type 2 H
~
-model, however, the sources remain the same as in Type 1, but instead of
calculating the equivalent resistance R
eq
we let N
1
remain unaltered except all its DC power
supplies are removed, as shown in Fig. 4(b). The term ”DC power removed” means that all
N
1
A resistive circuit
with independent
& self-dep.
sources
I
j
N
2
V
j
Fig. 3. Two networks N
1
and N
2
connected through a port j(V
j
, I
j
).
(b )(a )
N
1
N
2
No DC
Pow er
I
j
V
j
I
H
V
H
R
eq
N
2
I
H
V
H
I
j
V
j
Ix
vx
I
N
0,0
V
Th
I
H
V
H
H
(c)
Fig. 4. A two-terminal Hybrid equivalent circuit for N
1
; (a) Type 1 representation; (b) Type 2
representation; (c) the location on the port’s characteristic curve.
New Port Modeling and Local Biasing of Analog Circuits
51
independent DC supplies are removed from N
1
, including charges on the capacitors and
currents through the inductors. Type 2 H
~
-model is useful in a number of applications, such
as moving the DC sources in a circuit to its port terminals without disturbing the internal
structure (topology) of the network.
Note that, because of having two sources instead of one, an H
~
-model represents an axis of
freedom that acts as a tool in dynamic modeling of a port. As indicated in Fig. 4(c), an H
~
-
model covers a full and continuous range of equivalent circuits for a two-terminal network.
It is evident from Eq. (2) and Fig. 4(c) that both the Thevenin and Norton models are two
special cases of an H
~
-model.
Example 2: Figure 5(a) shows the same circuit given in Example 1 (Fig. 2(a)), except this time
the x-y port is connected to a load R
L
. Here we would like to have: i) an H~-model for the
two terminal circuit, on the left of x-y, so that the power consumption on both sides of the
port are equal; and ii) modify the H~-model in part i) so that the power consumption in the
two terminal circuit (the left of x-y) becomes zero.
y
x
124*Ib
5 V
0.5 V
2 KΩ
25 KΩ
200 Ω
Ib
(a)
0. 5 K Ω
R
L
y
x
2 KΩ
0.5 KΩ
R
L
I
H
V
H
(b)
Ij
V
j
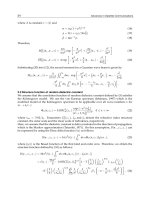
Fig. 5. (a) A simplified small signal equivalent circuit of a single stage BJT amplifier with
load; (b) an H~-model of the amplifier.
Solution: We first find an H~-model representation for the two-terminal circuit as depicted
in Fig. 5(b), with the source values, V
H
and I
H
, unspecified. Second, to make the power
consumption on both sides of port j equal we need to have
22
()
L
j
e
q
H
j
RI R I I=−
By using Eq.(2), and knowing that
Th
V = 2.5V and
e
q
R = 2KΩ we get
1,
j
ImA= 1.5 ,
H
ImA= 0.5 ,
H
VV
=
− and the power consumed for each side is
0.5
j
WmW= .
For part ii), because the situation for the load R
L
is not changed we still have 1
j
ImA= ,
0.5 ,
j
VV= and 0.5
j
WmW
=
. Now, to make the power consumption to the left of X – Y
zero we must have
2
()0
eq H j
RI I
−
= ; or simply 1
Hj
II mA
=
= , and as a result
0.5
Hj
VV V== . This concludes the solution with the fact that in the part ii) the total power
consumption is reduced to half, i.e., from 1.0 mW to 0.5 mW.
2.1 Universality
Universality is an important property of an H
~
-model. H
~
-models can be accurately applied
to all possible cases of linear two-terminal networks, regardless of the port impedances;
whereas both Thevenin and Norton equivalent circuits lose their sensitivity in some specific
Advances in Analog Circuits
52
cases where port impedances take extreme low or extreme high values. For example,
consider measuring the Thevenin (open circuit) voltage of a two terminal network N
1
that
has the equivalent resistance of R
eq
= 2 MΩ. Suppose the measuring voltmeter has the input
impedance of R
M
= 20 MΩ and the measured open circuit voltage displayed is V
M
= 3V.
Apparently selecting V
Th
= V
M
= 3V as the Thevenin voltage for the port carries an error of
10%. Whereas, an H
~
-model with V
H
= V
M
= 3V and I
H
= I
M
= 136nA represents an exact H
~
-
model for the port. Note that there is no need for any extra measurement to find I
M
, because
we can simply get it from I
M
= V
M
/R
M
.
3. Input-referred noise using hybrid models
H
~
-model representation can be very helpful in noise analysis, particularly in the input-
referred noise calculations [12]. It simplifies and produces uniformity in noise analysis by
using only one noise model for all possible cases, dealing with different values of the source
impedance R
S
and the amplifier input impedance R
in
.
Let us consider an amplifier with a gain factor of G and input impedance R
in
, shown in Fig.
6(a). Because noise is more conveniently measurable at the output port of a circuit we can
represent the output noise of the amplifier in its power spectrum density, denoted by V
2
o,n
(f) in
V
2
/Hz. However, to specify a measured output noise we need to have a frequency band.
For simplicity, suppose the measurement frequency bandwidth is B = f
H
– f
L
Hz; where f
H
and f
L
are the high and low frequency of the spectrum, respectively. With relatively constant
(within -3 dB) gain factor within the bandwidth the measured output noise can be found as:
22
,, ,
()
onrms on
VBVf= (5)
On the other hand, depending on the type of input signal to the amplifier, the gain factor G
can be considered as a voltage gain A or as a trans-impedance R
M
depaeding on the input
voltage or current representation, respectively. Next, to calculate the input-referred noise of
the amplifier
1
we need to attenuate the output noise by the gain factor G to bring it into the
input loop of the amplifier. The question is how this input-referred noise must be
represented when transferred into the input loop: as a voltage source, a current source, or in
combination of the two? It of course depends on the values of the two parameters: the
source impedance R
S
and the amplifier input impedance R
in
[12]. Note that our objective
here is to find the input-referred noise of the amplifier that corresponds to the measured
noise at the open circuit output port. Hence, the assumption is that the thermal noises
associated with R
S
, R
in
and the amplifier output impedance, among others are all included in
the process, and there is no need to separately calculate and add up to the input-referred
noise. However, exception might arise for a case where the source input impedance is not
included in the output noise measurement. In such a case, because of linearity, the thermal
noise of R
S
must be added to the input-referred noise to get the final response. In our
analysis, however, we assume the inclusive case, i.e., the entire amplifier noise, including
that of R
S
, is all measured at the amplifier output port.
1
Input-referred noise is a virtual input noise that creates V
o,n,rms
at the output, in case the amplifier is
noise free.
New Port Modeling and Local Biasing of Analog Circuits
53
3.2 Input-referred noise computation
We first consider the case where the input-referred noise is represented either as a voltage
source or as a current source. The two choices are depicted in Figs. 6(b) and (c), and the
values of the input-referred noises are expressed in Eqs. (6) and (7), respectively. To simplify
this representation, again, we assume the thermal noise from R
S
, as well as other noise
components, to be included in
,,inrms
V or
,,inrms
I .
,, ,.
in S
inrms onrms
in
RR
VV
AR
+
= (6)
,, ,.
in S
inrms onrms
in S
RR
IV
AR R
+
= (7)
AC
V
Out
V
in
I
in
A
R
M
R
S
V
o,n,rms
AC
V
Out
V
in
I
in
A
R
M
R
S
I
i,n,rms
(a)
(c)
(b)
AC
V
Out
V
in
I
in
A
R
M
R
S
V
i, n ,rms
Fig. 6. (a) An amplifier with a gain factor of G (A or R
M
), and input impedance R
in
, and the
measured output noise
,.onrms
V ; (b) the input-referred noise as a voltage source; (c) the input-
referred noise as a current source.
However, in a special case where R
S
or R
in
gets an extreme (low or high) value the situation
may become different so that Eq.(6) or Eq.(7) may not produce the correct response as
discussed below.
1.
For a very low value of R
S
the input-referred noise is represented by a voltage source
(Fig. 6(b)) calculated by using Eq. (6) as
,.
,,
onrms
inrms
V
V
A
=
(8)
For the case when both R
S
and R
in
are very small we get the ratio α = R
S
/R
in
and from
Eq. (6) we can get
,, ,.
1
inrms onrms
VV
A
α
+
= (9)
2.
For very high value of R
S
the input-referred noise is represented by a current source
(Fig. 6(c)) calculated by using Eq. (7) as
,.
,,
onrms
inrms
in
V
I
AR
=
(10)
For the case when R
in
is very small the gain facto G can be represented by the trans-
impedance R
M
; the input-referred noise is obtained as
Advances in Analog Circuits
54
,.
,,
onrms
inrms
M
V
I
R
=
(11)
3.
For the case when both R
S
and R
in
are very large and they approach infinity there is an
ambiguity in the circuit and a rational solution cannot be pursued. This is because we
are basically pushing current through an open circuit! However, for large but limited
values of R
S
and R
in
, either Eqs. (6) or (7) can provide the input-referred noise. For
example, we can use Eq. (9) to get
,,inrms
V .
3.2 Use of H~-models in noise computation
The problem with the foregoing procedure is that in each case we need to know the range of
values of R
S
and R
in
in order to decide on the circuit topology; hence, decide on the right
type of the input-referred noise source. This definitely makes the analysis rather impractical.
It is only in an H
~
-model representation that all cases discussed above can be combined and
integrated into one. An H
~
-model can simply provide a universal and accurate model for the
noise calculation, regardless of the value of R
S
or R
in
. Figure 7 shows an H
~
-model
representation of the input-referred noise for the selected amplifier. As shown, we can use
both types of input-referred noise sources in Fig. 7 to calculate the output noise, as shown
below.
AC
V
Out
V
in
I
in
A
R
M
R
S
V
h,n,rms
I
h,n,rms
Fig. 7. Use of H~-modeling for computation of input-referred noise.
22 22 2
,, ,, ,,
() ()
in S in
onrms hnrms hnrms
Sin Sin
A
RARR
VV I
RR RR
=+
++
(12)
Equation (12) can be written as
22 22
,,, ,,Th n h n rms h n rms S
VV IR=+ (13)
Where
,Th n
V is the Thevenin noise voltage at the input loop, and is given by
,,,
Sin
Th n o n rms
in
RR
VV
AR
+
=
(14)
A comparison between Eq. (13) and Eq. (2) reveals that Eq. (13) is, indeed, the result of H
~
-
modeling of the input-referred noise; except that the representation here is in terms of noise
power rather than the noise voltage or current values.
New Port Modeling and Local Biasing of Analog Circuits
55
,,hnrms
V and
,,hnrms
I can be found using Eqs. (13) and (14) with 0
S
R
=
and
S
R =∞,
respectively. This results in
,, | 0
,,
onrmsRs
hnrms
V
V
A
=
=
and
,, |
,,
onrmsRs
hnrms
in
V
I
AR
=
∞
=
(15)
Here
,,onrmsRs
V
=∞
stand for the output noises obtained when the amplifier input port is open
circuited; similarly,
,, 0onrmsRs
V
=
stand for the output noises obtained when the amplifier
input port is short circuited. We are now ready to show that for all the cases discussed
earlier (with different values of R
S
and R
in
) the proposed H
~
-model can be exclusively used
to calculate the input-referred noise. For example, for R
S
= 0 we get from Eq. (13) that
,,, ,,Th n h n rms i n rms
VV V==, and from Eq. (14) we get
,.
,,
onrms
inrms
V
V
A
=
which is the same as
Eq.(8). For R
S
very large by combining Eqs. (13) and (14) we get
,,, ,, ,,
Sin
Th n o n rms h n rms S i n rms S
in
RR
VV IRIR
AR
+
===
, which simply results in
,.
,,
onrms
inrms
in
V
I
AR
=
,
which is the same as given in Eq. (10).
Example: 3 - Consider an amplifier with a voltage gain of A = 40 dB, source impedance R
S
= 2
K
Ω and the input impedance R
in
= 8 KΩ. The output noise is measured for two cases of
S
R
and
S
R =∞ and for a bandwidth of 300 MHz. For
S
R we measure
,, | 0onrmsRs
V
=
= 200 μV,
and for
S
R =∞ we measure
,, |onrmsRs
V
=
∞
= 400 μV. Calculate i) the hybrid noise voltage and
current for the input-referred noise
,,hnrms
V and
,,hnrms
I ; ii)
,Th n
V , iii) and the overall output
noise
,,onrms
V .
Solution – The amplifier gain is A = 100 V/V. From Eq. (13) we get
,,hnrms
V = 200/100 = 2 μV, and
,,hnrms
I = 400/(100*8) = 0.5 nA.
From Eq. (13)
2
,Th n
V = 4.0e-12 + 0.5e-18 * 4.0e+06 = 6.0e-12.
Which results in
,Th n
V = 2.45 μV.
Next, from Eq. (14) we get
,,onrms
V = 2.45 * 100 * 8/10 = 200 μV.
4. Nullified Hybrid equivalent circuit
A Nullified Hybrid equivalent circuit, called H-model, is an especial case of an H~-model;
where, the values of the voltage and current sources in the model are identical to the
corresponding port voltage and current values. What this means is that the sources in an H-
model are representing the biasing situation of the corresponding port. For example, take
the case of Fig. 3, where the network N
1
provides the voltage V
j
and the current Ij to bias the
network N
2
. The two models for this example are shown in Figs. 8(a) and 8(b). Note that
Figs. 8(a) and 8(b) are identical to Figs. 4(a) and 4(b) except here the model-sources represent
the port values. Note also from Fig. 8 that, as a result of H-modeling another port, k(V
k
, I
k
),
is created across N
1
, where both V
k
and I
k
are zero. Port k(V
k
, I
k
) is called a “null” port and
the process of creating it is called “port nullification”, as will be discussed shortly.
Advances in Analog Circuits
56
(b)(a)
N
1
N
2
No DC
Pow er
I
j
V
j
I
j
V
j
I
k
V
k
R
eq
N
2
I
j
V
j
I
j
V
j
I
k
V
k
N’
1
N’
2
N’
2
Fig. 8. An H-model for a two terminal N
1
; (a) Type 1 representation; (b) Type 2
representation.
Theorem 1 introduces an important property of an H-model dealing with power
distribution in a network [13]. It adds an extra dimension to the power analysis and power
segmentation in a network.
Theorem 1: Consider a network N
2
connected to another network N
1
through a port j(V
j
, I
j
),
as in Fig. 3. Replacing N
1
with its Type 1 or Type 2 H-model reduces the power
consumption in N’
1
to zero, while the power consumption in N
2
remains unchanged.
Proof: Consider the H~-model in Fig. 4(a) or 4(b). Both sources, I
H
and V
H
, provide power to
networks N
1
and N
2
. The power delivered to N
2
is fixed and it amounts to P
2
= V
j
* I
j
;
whereas in Type 1 H
~
-model the power consumed for N
1
(Fig. 4(a)) is P
1
= R
eq
(I
H
– I
j
)
2
.
Hence, the power P
1
in N
1
becomes zero if I
H
= I
j
which also results in V
H
= V
j
. For Type 2 H-
model however, notice from Fig. 8(b) that N’
1
has no DC supply to get power from, plus its
port is also nullified. Therefore, all currents and voltages inside N’
1
must be zero, resulting
in zero power consumption.
Port Nullification: Consider a network N
2
connected to another network N
1
through a port
j(V
j
, I
j
) as shown in Fig. 3. One way to nullify Port j is to augment the port from both sides
(N
1
and N
2
) by current sources I
j
and voltage sources V
j
as depicted in Fig 9. The result is the
creation of another port k(V
k
, I
k
) that, by definition, is a null port, i.e., both I
k
and V
k
are
zero.
N
2
I
j
V
j
I
j
V
j
I
k
V
k
N
1
I
j
V
j
I
j
V
j
N’
2
Fig. 9. A simple port nullification procedure with no change imposed on N
1
or N
2
.
New Port Modeling and Local Biasing of Analog Circuits
57
However, there is an alternative method to create a null port when two networks N
1
and N
2
are connected through a port j(V
j
, I
j
), shown in Fig. (3). Here we can simply replace N
1
with
its H-model (Type 1 or Type 2) and create the null port k(v
k
, i
k
), as depicted in Fig. 8. Note
that as a result of port nullification procedure, shown in Figs. 8 and 9, an extended network,
N’
2
, is created that contains N
2
plus the sources belonging to the H-model. Similarly,
another network N’
1
is also created, on the left hand side, when the H-model loses its
sources. As we can see it later, these extended networks are of particular importance in
circuit biasing.
Note that the characteristic curves of ports j and k are identical except for shifts of v and i,
coordinate axis, from the origin to the Q
j
(V
j
, I
j
) point. This makes the operating point Q
j
(V
j
,
I
j
) to fall on the origin, creating a new operating point Q
k
(0, 0) for the port k, shown in Fig.
10. This simply means that, for any pair of networks, N
1
and N
2
, connected through a port j
it is always possible to nullify the port and change N
1
and N
2
to N’
1
and N’
2
, where N’
1
and
N’
2
are identical to N
1
and N
2
, except the v and i coordinate axis are move to the port’s
operating point. This is stated in Property 1.
I
j
Q
i
j
v
j
v
k
i
k
V
j
Fig. 10. The i-v coordinate axis moved from (0, 0) for the j port to a new position, Q
j
(V
j
, I
j
),
for the k port.
Property 1: Consider two networks N
1
and N
2
connected through a port j, as in Fig.3. If port j
is null then the i-v characteristic curve of the port, looking through either network, passes
through the origin and the origin is the operating point of that port. In case port j is not null
it is always possible to nullify the port to get the corresponding networks N’
1
and N’
2
with a
null port k, as shown in Fig.8.
Example 4: Consider the circuit of Fig. 11(a), where two sections of a circuit are connected
through a port j(V
j
, I
j
). Let the MOS diode be characterized by i = K (V-1)
2
mA for V > 1V,
and let K = 0.5 mA/V
2
. The analysis shows that port j is not a null port because I
j
= 1 mA
and V
j
= 3 V. Next, we augment port j of N
2
by two current and voltage sources I
j
= 1 and V
j
= 3 V and then remove the supply sources of 5 V and 1 mA from N
1
. As a result a new null
port k(V
k
, I
k
) is created, as shown in Fig. 11(b). Note that although the i–v characteristic
curve of port j (associated with both networks) does not pass through the origin that of port
Advances in Analog Circuits
58
k does (property 1). In addition the Q-point of port k is located at the origin, as expected.
Note that i) the network N’
1
, on the left hand side, is still linear, and ii) the new port k has an
i–v characteristic curve that passes through the origin, and the origin is also the Q-point for
the port. This simply means that the Thevenin equivalent circuit of N’
1
, looking from port k,
must be a resistance with no source attached to it.
(b)(a )
I
j
V
j
2 KΩ
4 K
Ω
8 KΩ
1 mA
1 mA
5 V
I
j
V
j
2 KΩ
4 KΩ
8 KΩ
1 mA
1 mA
V
DD
3 V
I
k
V
k
N’
1
N
1
N
2
N’
2
Fig. 11. (a) Example of two networks N
1
and N
2
separated by a port j; (b) creation of a null
port k in an H-modeling representation.
5. H-modeling in multi-port networks
H-model is also capable of representing a multi-port network; and this representation is of
Type 2, introduced in Section 4. Consider a linear network N
1
connected to another network
N
2
through n-ports j(V
j
, I
j
), for j = 1, 2, …, and n, as shown in Fig. 12. Similar to a two
terminal network, the Type 2 H-model representation of N
1
is obtained by removing all
independent sources
2
from N
1
, and instead augmenting the ports with voltage and current
sources that match the corresponding port values, as depicted in Fig. 13.
Note that, similar to a single port network, the H-model procedure described above creates
n null ports k(V
k
, I
k
), for k = 01, 02, …, and 0n. Also note from Fig.13 that, as a result of the
H-modeling, two networks N’
1
and N’
2
are created that are connected together through n
null ports. Property 2 is similar to Property 1 that holds for n-port networks.
Property 2: Consider two networks N
1
and N
2
connected through n ports j, for j = 1, 2, …,
and n. Replace N
1
with its Type 2 H-model representation to create n null ports k, for k = 01,
02, …, and 0n, as shown in Fig.13. Then for any of n nullified port the i-v characteristic curve
passes through the origin and the origin is the operating point of that port.
In another interpretation, Property 2 clearly states that port nullification through the H-
modeling does not change the ports’ i-v characteristic curves; it only moves the v and i
coordinate axis so that the ports’ operating points fall on the origins, for all n ports.
Similarly, Theorem 1 also applies to n-port networks, as stated in the following corollary.
Corollary 1: Consider a network N
1
connected to another network N
2
through n ports j(Vj, Ij),
for j = 1, 2, …, and n. Replacing N
1
with its (Type 2) H-model reduces the power
consumption in N’
1
to zero.
The proof of Corollary 1 is similar to that of Theorem 1 in that we only need to note that N’
1
has no source to get power from, and that all its n ports are nullified and cannot deliver
power to N’
1
. Corollary 1 has several applications in power analysis of analog circuits. One
2
Again, N
1
does not have dependent source that is controlled from outside of N
1
.
New Port Modeling and Local Biasing of Analog Circuits
59
N
2
.
.
.
N
1
V
1
I
1
V
2
I
2
V
n
I
n
Fig. 12. Multi-port networks N
1
and N
2
connected through n ports.
N
2
.
.
.
N
1
No
DC supply
I
01
I
1
I
1
V
1
V
1
V
01
I
02
I
2
I
2
V
2
V
2
V
02
I
0n
I
n
I
n
V
n
V
n
V
0n
N
’
2
Fig. 13. H-model representation of the n-port network N
1
.
Advances in Analog Circuits
60
application is to verify the power consumption in different parts of a network without
disturbing the rest of the circuit. For instance, to calculate the power used in an amplifier
core, minus the losses in the DC suppliers and the power supporting circuit elements, we
can do as follows: replace the DC supply sections of the circuit with their H-models and
then calculate the total power consumed in the circuit. This is equal to the power consumed
in the amplifier core. This is in fact true for any type of power consumption including AC
power. For example, to calculate the power consumed in a circuit alone, minus the input
sources, we can represent the input sources by their H-models and calculate the total power
in the circuit. Another important application of Corollary 1 is in low power designs of
analog circuits. Here we can start designing a circuit, say an amplifier, with minimum DC
power consumption, i.e., just enough to bias the transistors in the circuit. However, the
circuit so obtained may not be very practical, after all. This is because there might be too
many DC sources, known as “distributed supplies”, being added to the circuit as a result of
the H-modeling. Nevertheless, this is a good starting point for an efficient design for power
consumption. The question asked is: how to remove the “distributed supplies” in the circuit
and replace them with typical circuit supplies, but still keep the DC power consumption
minimized? One simple solution to deal with the distributed supplies is to move them to
their destination one at a time, having in mind to keep the power consumption minimized.
This process definitely takes time and programming it may need a major effort. A more
strait forward methodology for DC supply allocation in analog circuits has been recently
developed [14] that makes this journey much simpler. The next chapter discusses this new
methodology in more details.
5.1 Coupling capacitors in H-modeling
Another useful property of H-model is that from two sources used in the model only one
souse provides power to the circuit and the other source is inactive (sitting idle with zero
voltage or current). For example, in the H-modeling shown in Figs. 8 and 13 the current
sources I
j
provide power to N
2
, but the voltage sources V
j
are only to provide voltage drops
necessary to create the null ports k, for k = 01, 02, …, and 0n, without delivering (or
consuming) any power to the circuit. It is also possible to reverse the situation and have the
voltage sources provide power and the current sources sitting inactive. Figure 14 shows
such a modeling for a single port network that is identical to Fig. 8(b) except here the
positions of the model-sources have been swapped. This is summarized in Property 3.
I
k
I
j
I
j
V
j
V
j
N
2
V
k
N
1
No
Source
N
’
2
Fig. 14. An alternative H-modeling representation
Property 3: Consider two networks N
1
and N
2
connected together through one or multiple
ports j(V
j
, I
j
), for all j, as shown in Figs. 3 and 12. Next, replace N
1
with its H-model such as
New Port Modeling and Local Biasing of Analog Circuits
61
those in Figs. 8, 13 and 14. Then there is only one active model-source, I
j
or V
j
, for each port
delivering power to N
2
and the other model-source is inactive.
According to Property 3 only half of the sources used in H-models are active sources and the
other half are inactive; they are there to establish the voltage or current requirement for the
null ports. This brings up an alternative representation for an H-model. In this
representation we can replace an inactive source with a storage element such as capacitor or
inductor. Forexample, Figs. 8(b) and 13 are two circuit examples where the voltage sources
are inactive. Apparently replacing these voltage sources with capacitors that are charged to
the same voltages must satisfy the H-modeling: hence, making no changes in the voltages
and currents within N
1
or N
2
, as depicted in Fig. 15. In fact, these capacitors play similar
roles as the coupling capacitors in ordinary amplifiers. Traditionally, coupling capacitors
are used in amplifier designs to confine the DC power within the stages of the amplifier, or
to block the DC from entering the input source or the load. The same role is played here;
except here the choice is broader. In general a circuit can arbitrarily be partitioned into two
blocks, N
1
and N
2
connected through n ports, where one block, say N
2
, receives the DC
power it needs to bias the (nonlinear) components and the other one does not need it. For
example, take again the case of Fig. 13; assume N
2
is the collection of all the nonlinear
components (transistors) and N
1
represents the rest of the circuit. This simply means that the
DC supplies are limited to directly bias nonlinear components in N2 and nothing else.
Figure 15 shows how the voltage sources in local biasing in Fig. 13 are replaced with
coupling capacitors; and these capacitors are going to get charged at the beginning of the
N
2
.
.
.
N
1
No
DC supply
I
01
I
1
I
1
V
1
C
1
V
01
I
02
I
2
I
2
V
2
C
2
V
02
I
0n
I
n
I
n
V
n
C
n
V
0n
N
’
2
Fig. 15. H-model representation of an n-port network using coupling capacitors.
Advances in Analog Circuits
62
circuit operation, known as the transient response. It is during this period that the capacitors
are charged to the same voltages as those voltage sources, V
j
, provided that each capacitor
has a (resistive) charging path, providing an RC time constant.
6. Component biasing
One of the applications of H-modeling, leading to port nullification, is in biasing of
nonlinear components, individually or in clusters. This is known as
component biasing. Take
the case of Fig. 3 or Fig. 12 and assume N
2
consists of one or more nonlinear components
connected to the rest of the circuit, N
1
. This simply means that N
1
is biasing all the
components accumulated in N
2
, and it establishes operating points for the ports at Q
j
(V
j
, I
j
),
for j = 1, 2, …, n. Now, compare Fig. 3 with Fig. 8(b), or Fig. 12 with Fig. 13; in both cases no
change in the biasing of the components inside N
2
takes place i.e. the ports are still operating
at Q
j
(V
j
, I
j
) points. The difference, however, is that in the former circuits (Figs. 3 and 12) the
components in N
2
are globally biased through N
1
, whereas in the later cases (Figs. 8(b) and
13) the ports are directly biased through the H-model sources, leaving N
1
with no DC
supply. This brings us to introduce a new biasing scheme, known as
local biasing. We can
simply show that component biasing is the combination of local biasing applied to all ports
of a nonlinear component (transistor). Next we introduce local biasing and its applications.
6.1 Local biasing
A port is locally biased if it is augmented with a voltage source and a current source so that
they exactly provide the voltage and current the port needs to operate at its desired Q-point.
Apparently the port receives its biasing power exclusively from one of those DC (voltage or
current) supplies and that DC supply is fully dedicated to the port.
A component is individually biased (called
component biasing) if all its ports are locally
biased. Likewise, an m-port network consisting of multiple components is locally biased if
all its ports are locally biased.
Property 4: A nullified port is locally biased.
The proof of Property 4 is quite evident because when a port is nullified the exchange of DC
power through the port becomes zero and that is exactly what local biasing is all about.
However, in local biasing the exchange of power between two sides of the nullified port is
zero only at the designated operating point. The port behaves quite normal and like when it
is globally biased, when a signal is applied to the port. In other words, local biasing only
shifts the port’s i-v coordinate axis to the operating point.
Local biasing Using Coupling Capacitors: As discussed in Section 5, coupling capacitors can be
used in place of voltage sources in H-modeling, as shown in Fig. 15. Because of the identity
between the two concepts the same rules apply to local biasing ports as well. Now we must
realize that although both local biasing solutions (one with two sources and one with a
current source and a coupling capacitance) serve the same purpose of confining the DC
power within the nonlinear components, they do not perform identically; and they are not
interchangeable in some cases. Here are the major differences between the two. As we
discussed earlier, a locally biased port j with both sources being present create a null port k;
and as long as k stays null it guaranties that port j operates at Q
j
(V
j
, I
j
), as shown in Figs. 8,
13, and 14. However, any new DC supply in the circuit that effects port k causes port j to
shift from Q
j
(V
j
, I
j
) accordingly. Hence, local biasing, with both sources present, is
transparent to any signal (DC and AC) in the circuit; the same it is in a normal biasing
New Port Modeling and Local Biasing of Analog Circuits
63
situation. This, for example, helps in amplifier designs where the frequency band includes
DC. However, this is not the case when coupling capacitors are used in local biasing. Once
the port’s operating point is established in the coupling capacitor case it remains unaltered,
no matter how much DC supply we bring to the main circuit. In fact, here, it is the current
source across the port that provides the biasing condition for the port and as long as it
remains constant at I
j
the operating point stays unaltered at Q
j
(V
j
, I
j
). That is why in a
capacitor coupling case we lose the low frequency bandwidth to a non-zero value of f
L
,
depending on the RC time constants; C being the coupling capacitor. The following property
is valid for both types of local biasing.
Property 5: Consider a linear circuit N connected to one or more nonlinear components
through p ports. Suppose the DC supplies in N bias the p ports to their Q-points Q
j
(Vj, Ij),
for j = 1, 2, …, and p. Now, if we remove all DC supplies from N and instead locally bias all
p ports to their assigned operation points Q
j
(Vj, Ij) then we observe no change happening in
the AC performance of the entire circuit, i.e., the gains, input and output impedances,
frequency responses, and signal distortion remain unaltered. The exception is in the case
when coupling capacitors are used. The later causes the low frequency response of the
amplifier to change from DC to a higher frequency f
L
.
The proof of Property 5 is quite evident. For the case of local biasing using two DC sources
for each port, the sources are transparent to the AC signals and they can simply be removed
for AC analysis (including DC signal). For the case of local biasing with coupling capacitors
the capacitors bypass AC signals except for the frequencies below the low cut-off frequency
f
L
of the circuit.
Example 5: Consider designing a two stage BJT amplifier with feedback. The circuit structure
(topology) is shown in Fig. 16, and the design specifications are given in Table I. The
AC
v
out
i
in
R
C
V
CC
I
S
Q
1
Q
2
R
E
R
F
R
B
Fig. 16. A two stage BJT amplifier with feedback
Advances in Analog Circuits
64
A
v
dB A
i
dB
R
in
K
Ω
R
out
K
Ω
f
L
Hz f
H
KHz
44 46 1.2 65 30 300
Table I. The design specs for the amplifier
Transistors are two npn, 2N3904, and their selected operating points during the AC
operation are listed in Table II. We first start with the AC performance design. This is done
by replacing the transistors with their small signal linear models at the designated Q-points.
Next, in a routine linear analysis, the circuit components are found so that the design meets
the given criteria. Table III lists the resistor values resulting from the AC design.
Trans. V
BE
V
I
B
μA
V
CE
V I
C
mA
Q
1
0.57 0.32 1.5 0.025
Q
2
0.7 25.0 4.2 4.0
Table II. The selected operating points for the transistors in the amplifier
R
B
KΩ R
C
KΩ R
E
Ω R
F
KΩ
100 1 200 40
Table III. the resistor values resulting from the AC design of the amplifier
AC
R
E
R
F
R
B
R
C
I
E2
I
B1
I
C1
I
C2
V
E2
V
C2
V
B1
Q
2
Q
1
N’
1
N
2
N’
2
v
out
V
CC
V
CC
V
CC
Fig. 17. Separation of linear and nonlinear sections in the two stage BJT amplifier using H-
modeling
Our next step is to bias the transistors through local biasing. To do this we first separate the
nonlinear components from the rest of the circuit. Next, we remove the unknown DC
supplies (V
DD
and I
S
) from the circuit, and instead locally bias the transistors to their desired
Q-points, as shown in Fig. 17. Notice how the circuit is partitioned into two sub-networks
New Port Modeling and Local Biasing of Analog Circuits
65
N’
1
and N’
2
; where N’
1
consistes of the linear (resistive) components of the amplifier with
zero DC power, and N’
2
contains the locally biased transistors. Our formal amplifier design
is over by now and the circuit should work perfectly fine. However, there is still one
practical problem left that must be taken care of; which is to reduce the number of DC
supplies and possibly allocate only one or two normal DC voltage supplies at the designated
locations. We leave this to the next chapter where the problem is tackled and a systematic
solution for DC power management and supply allocation is provided for analog circuits.
Instead, here we will continue to focus on local biasing. Because there is a low cut off
frequency specified for this design we have a choice to use coupling capacitors for the local
biasing. Figure 18(a) shows the amplifier locally biased with coupling capacitors. Note that
the capacitor values are selected based on the low cutoff frequency response, f
L
= 30 Hz,
specified for the amplifier. Figure 18(b) shows the output voltage swing in full range with
negligible distortion, and Fig. 18(c) shows the output frequency spectrum of the amplifier,
which tightly meets the design criteria. Theoretically our design objective for this amplifier
is accomplished at this point; however, one may argue about the practicality aspects of this
design with four current sources distributed within the circuit. In case of integrated circuits
this may be acceptable because the current sources can be replaced with active loads,
current mirrors and current sinks. For our design, as a lumped amplifier circuit, this may
create problems. One simple solution is to replace the current sources with resistors that
provide the same DC currents to the devices. But the problem with these resistors is that
when added to the circuit they may, to some extent, change the AC performances of the
amplifier, such as the gains. In some cases the changes might be negligible. In tighter design
however we can repeat the AC design; this time analyze the linear circuit with the resistors
included.
AC
i
in
R
C
V
CC
Q
1
Q
2
R
E
R
F
R
B
v
out
I
B1
I
S
I
C2
I
E2
150 nF
1.0 uF
1.0 uF
Fig. 18. (a) – The amplifier, locally biased with coupling capacitors substituted for the
voltage sources.
Advances in Analog Circuits
66
(b )
(c)
Fig. 18. (b) The output voltage swing of the amplifier; (c) the output frequency spectrum of
the amplifier
6.2 Local biasing vs. normal biasing
Discussion - Note from Fig. 18(a) that, any change in the biasing resources, such as making
changes in V
CC
or in the DC current sources, shifts the operating points of the transistors;
but the effect is negligible to the rest of the circuit. This is due to the coupling capacitors. For
example, the feedback circuit (R
B
, R
E
and R
F
), a very sensitive part of the amplifier, is not
affected much by these changes. This is sometimes considered a serious deviation from the
design purposes. For instance, suppose one of the purposes of the design is to provide
feedback for the biasing to help to stabilize the transistor’s operating points against shifts in
the operating points during the amplifier operation. The purpose is definitely defeated by
using this type of local biasing. This is because, in using local biasing the rest of the circuit
becomes DC isolated except for the nonlinear block (N
2
); hence, no DC power runs outside
the block to make the feedback effective. In short, if negative feedback exists in the circuit to
help stabilize the transistors biasing then local biasing with coupling capacitors does not
help the situation and cuts off the feedback for DC. The good news is that we can do local
biasing with a mixture of both methods. That is, we can leave the sensitive areas, which
need DC feedback, with normal locally biasing, i.e. including voltage sources instead of
coupling capacitor, and do the rest with the coupling capacitors. This way we are benefiting
from both worlds, i.e. i) getting stability through the feedback, and ii) having the coupling
capacitors to fix the operating regions when needed.
To summarize, we have introduced two types of local biasing for nonlinear components:
one with both voltage and current sources present for each component, and one with
coupling capacitors replacing the voltage courses. A third type is to use the mixture of both
as appropriate. Here are some similarities and differences between the two types. For
certain operating point assigned to a transistor in a circuit both types of local biasing
provide voltage and current required to bias the transistor. In a way, this local biasing
causes the v and i coordinate axis to move to the Q-point. The difference between the two
types, however, is that in the coupling capacitor case the Q-point is fixed on the origin as
long as the local biasing current stays fixed; whereas, in the former (with the voltage source)
case the biasing behaves exactly like ordinary biasing except initially the Q-point is located
at the origin, but it can move with adding extra DC sources to the circuit.
New Port Modeling and Local Biasing of Analog Circuits
67
6.3 Local biasing of devices
Because local biasing deals with nonlinear devices, one way to efficiently analyze or design
an analog circuit is to bias the transistors individually before placing them in the circuit.
This allows the circuit to go directly for AC analysis. Within the three major semiconductor
devices p-n junction diodes are one-port devices and can be locally biased. Bipolar-junction
transistors are two-port devices, but they can also be modeled with two one-port devices in
case Ebers-Moll or the transport large signal model [11, 16] is used to replace them. Figure
19 shows an npn and a pnp transistor locally biased with their symbolic representation also
shown.
C
C
E
E
B
B
I
B
I
B
I
C
I
C
V
EC
V
CE
V
BE
V
EB
(a ) ( b)
(c)
Fig. 19. Locally biased bipolar transistors; (a) an npn; (b) a pnp; and (c) the symbol for a
locally biased BJT
MOS transistors, on the other hand, are considered three-port devices with only four sources
needed to represent locally biasing of the device. This is because for the drain-source we
need both I
D
and V
DS
sources to nullify the port; whereas for the gate-source and the
substrate-source we only need V
GS
and V
BS
to nullify the ports, respectively. Figure 20
illustrates both an nMOS and a pMOS being locally biased; however, for simplicity purposes
we may normally drop the substrate effect, V
BS
, and consider the device as a two port
(drain-source and gate-source) component.
G
I
D
(a)
(b ) (c)
V
DS
I
D
V
SD
V
GS
V
SG
V
BS
V
SB
G
D
DS
S
B
B
Fig. 20. Locally biased MOS transistors; (a) an NMOS transistor; (b) a PMOS transistor; and
(c) the symbol for a locally biased transistor
Advances in Analog Circuits
68
C
E
B
I
B
I
C
V
CE
V
BE
(a) (b)
Fig. 21. (a) Locally biased bipolar transistor using coupling capacitors; and (b) the
representing symbol
6.4 Source reduction in the local biased transistors
Coupling capacitors described earlier can also be used in device biasing to replace the
voltage sources. Again, this is because only one of the two sources is needed to provide DC
power to the port, and the other source is inactive. In case of an inactive voltage source we
can replace it with a coupling capacitor. However, there are two related issues that must be
addressed when coupling capacitors are used in amplifiers. First, a coupling capacitor must
have a (resistive) path to DC supplies to get charged during the operation. Second, as we
know, coupling capacitors have direct effect on the low frequency response of the amplifier;
therefore, they must be selected so that the low frequency response criterion of the amplifier
is not violated. Figure 21 is an example of coupling capacitor used in local biasing of a BJT.
Example 6: Figure 22(a) shows a single stage nMOS amplifier. To apply local biasing we
remove all DC supplies from the circuit and locally bias the transistor. In this design the
transistor is locally biased with capacitor coupling, shown in Fig. 22(b). However, the
coupling capacitors need to be charged to the level needed for local biasing; hence, they
need charging path. The capacitor C
DS
has its charging path to the current source I
D
, but the
capacitor C
GS
lacks such a path and we need to create one through an extra resistance R
F
=
10MEG
Ω. Although R
F
is not part of the original amplifier, it is large enough to neglect its
effect on the amplifier operations. The next step is to decide on the capacitors values. Each
capacitor creates a pole (also zero) for the output transfer function, and for the correct
frequency response the poles must lie below the low cutoff frequency of the amplifier, set at
f
L
= 100 Hz. We first assume C
GS
= 0.5 nF and C
DS
= 100 nF and compute the poles
individually. For the gate capacitor, roughly speaking, we have
11
32
2 ( ) 2 * 10.2 06 * 0.5 09
GS
FGGS
f
Hz
RRC e e
ππ
== =
++−
And for the drain capacitor we get
11
53
2 2 * 30 03 * 100 09
DS
DDS
f
Hz
RC e e
ππ
== =
+−
New Port Modeling and Local Biasing of Analog Circuits
69
Both pole locations are below f
L
= 100 Hz and hence are accepted for our design. This will
conclude the design. The circuit of Fig. 22(b) is simulated by SPICE and the results for both,
the transient response and the frequency response, are provided in Figs. 23 (a) and (b),
respectively. Note from Fig. 23(a) that it takes about 4 msec for both C
GD
and C
DS
to charge
to the level needed for local biasing. Also note that, since all biasing is accomplished by
current sources we do not need to specify the DC supply value V
DD
, unless certain voltage
swing for the output waveform is needed.
AC
10 MΩ
30 KΩ
200 KΩ
1.5 KΩ
I
D
I
D
0.5 nF
100 nF
C
DS
C
GS
80 μA
80 μA
V
DD
(b )
(a)
AC
30 KΩ
200 KΩ
V
DD = 5 V
1. 5 KΩ
V
GG = 1.6 V
V
Out
V
Out
Fig. 22. (a) Single stage NMOS amplifier; and (b) locally biased transistor with coupling
capacitors
(a) (b)
Fig. 23. The SPICE simulation results; (a) the transient waveforms; and (b) the amplifier
frequency response
Before we leave our discussion about the coupling capacitors here we need to closely look at
their effect on the AC operation of the circuit. As we add each capacitor to a circuit
3
we
basically add one pole, and possibly one zero, to the transfer function; and in the case of
large number of capacitors they may initiate circuit instability and oscillation. A rule of
thumb that often applies here is that, if an amplifier has feedback and it exceeds more than
two stages, the extra number of coupling capacitors for local biasing should be avoided.
3
The assumption is that the capacitors are independent, i.e., they can arbitrarily assume any voltage
across.
Advances in Analog Circuits
70
7. Additivity in local biasing
Additivity is a major property of linear circuits; it permits superposition as a convenient tool
for breaking the circuit response to multiple stimuli into the sum of the circuit responses to
individual stimulus, one at a time. As we know additivity does not apply to nonlinear
circuits, but as we will prove, it works in circuits with nonlinear components provided that
the circuit situation (response) is restored before applying the next stimulus (DC supplies).
Theorem 2 describes the procedure for two terminal networks.
Theorem 2 – Additivity: Consider a network N
2
connected to another network N
1
through a
port j(V, I), as shown in Fig. 24(a), and with its characteristic curve shown in Fig. 24(b). Let
N
1
contain n DC supplies. Further, assume we are dealing with simple (non-multiple)
operating points
4
in this case. Group the sources arbitrarily into p mutually exclusive
groups
5
. Perform p number of biasing cycles to the circuit; each time applying only one
group of supplies and remove the rest. Then, the final operating point of the port due to all
n supplies can be determined by adding the (voltage and current) values associated with all
p number of operating points in the p biasing cycles provided that the port is nullified
(called partial local biasing) before the next operation is performed.
(a)
(b)
Fig. 24. (a) Two terminal networks connected; and (b) the port’s operating point on the
characteristic curve
Proof: Suppose a network N
1
with n DC supplies is connected to another network N
2
through a port j(V, I) (Fig. 20(a)), and suppose Q(V, I) is the operating point of the port
looking to N
2
, as shown in Fig. 20(b). Now, split n supplies into p groups of mutually
exclusive supplies n
1
, n
2
, …, and n
p
. First keep the group of n
1
supplies in N
1
and remove
the rest (Fig. 25(a)). Suppose for this case the operating point moves to a new point, Q
1
(V
1
,
I
1
), on the characteristic curve, as depicted in Fig. 25(d). Next do the followings: i) augment
port j
1
(V
1
, I
1
) with current I
1
and voltage V
1
supplies, and ii) remove n
1
sources from N
1
. This
creates a nullified port j
2
(V
2
, I
2
) next to j
1
(V
1
, I
1
). Now we have completed a partial local
biasing, which causes the v and i coordinate axis to move from (0, 0) to Q
1
, and make it the
4
In a case of multiple operating points we may end up with more than one operating point for a single
set of supply sources.
5
It is also permissible to have a supply used in more than one group. In this case the supply is
partitioned and each part is exclusively used in one group.
New Port Modeling and Local Biasing of Analog Circuits
71
new origin. Next, add the group of n
2
supplies to N
1
, as shown in Fig. 25(b). This causes the
operating point to move from Q
1
(the new origin) to Q
2
(V
2
, I
2
), as indicated in Fig. 25(d).
Likewise, augment port j
2
with current I
2
and voltage V
2
supplies and then remove n
2
group
of supplies from N
1
to create a nullified Port j
3
(V
3
, I
3
). Again, the last operation causes the v
and i coordinate axis to move from Q
1
to the new location, Q
2
, (Fig. 25(d)). Similarly,
introduce n
3
group of supplies to N
1
(Fig. 25(c)) and move the operating point to a new
point Q
3
(V
3
, I
3
) on the characteristic curve. Without loss of generality we can now assume
that the sources in N
1
are exhausted at this point. Then Q
3
and Q must be the same point on
the characteristic curve. This is because the process, just explained, is not different from
applying all n supplies to the circuit in p steps of n
1
, n
2
, …, and n
p
groups, but this time
without removing any of them. This simply means that V = V
1
+ V
2
+ V
3
, and I = I
1
+ I
2
+ I
3
,
as we can see in Fig. 25(d). This proves the theorem.
N
1
N
2
I
1
V
1
I
2
V
2
n2 DC
s upplies
N
1
N
2
n1 DC
supplies
I
1
V
1
(a) (b)
N
1
N
2
I
1
V
1
I
2
V
2
n3 DC
supplies
V
3
I
3
(c)
Fig. 25. The process of additivity in local biasing; (a) network with the first group of
supplies; (b) and (c) Sequences of adding groups of supplies one at a time and accumulating
the biasing results
Q
3
V
1
V
2
V
3
v
2
v
1
v
3
I
3
I
1
I
2
i
3
i
1
i
2
Q
1
Q
2
Fig. 25. (d) Progressive move of the operating point on the characteristic curve as the
supplies are adding.
The method just described allows us to progressively bias a complex circuit in a step-by-step
procedure. By using additivity property we can break down the DC supplies into p separate
groups of supplies so that each time we only apply one group. At the end it is the sum of
partial results that determines the final operating points of the transistors. This separation of
multi-step biasing procedure, called
progressive biasing, has only been possible by using local
Advances in Analog Circuits
72
biasing methodology. In a way, local biasing keeps (stores) the progression of the biasing
status in the circuit in order to accumulate and direct the biasing to its destination. It can be
thought of as a ladder procedure: in each step of the ladder one group of the circuit supplies
are replaced with local biasing supplies so that the Q-points of the transistors stay
unchanged on the characteristic curves, but all the coordinate axis move to the Q-points,
making them new origins for the next step. This continues until the circuit supplies are
exhausted. It is this additivity property that makes superposition, a valuable tool, available
for nonlinear circuits. It is through this superposition that we can break down the
complexity of biasing for large circuits and manage a smooth biasing convergence.
Another notable point regarding this step-by-step biasing procedure is that we can arrive at
a final Q-point in a port from different directions, depending on the sequence of the supply
groups we select to apply. And in these options we might be able to select the quickest one
or the one that assures convergence. On the same line, following the procedure stated in
Theorem 2 we might arrive at different Q-points when we approach from different
directions. This is the case when we are dealing with multiple Q-points; and the described
procedure can provide an alternative technique for searching for multiple operating points
in a nonlinear circuit [9].
Although Theorem 2 is given for two terminal networks it can easily be extended to include
multiple-port networks, as stated in Corollary 2.
Corollary 2: Consider a network N
2
connected to another network N
1
through m ports. Let
N
1
contain n number of DC supplies used for biasing N
2
. Further, assume all the operation
points for the m ports are simple (non-multiple) Q-points. Next, group the sources
arbitrarily into p mutually exclusive groups. It then follows that for each port the final
operating point Q(V, I), due to all n DC supplies, can be found by adding the Q-point
(voltage and current) values, Q(V
j
, I
j
), for all p number of group of supplies, provided that
the following condition holds:
The port is nullified by being locally biased after each group of supplies is applied; making
the Q-point a new origin for the port’s characteristic curve.
Hence we can write:
11
pp
jj
jj
VVandII
==
==
∑
∑
(16)
The proof of Corollary 2 is similar to that of Theorem 2 in the sense that in each sequence of
applying a group of DC supplies to the circuit we can extend the procedure to include all m
ports. However, we must remember that in each step the nullification of ports must be total
and simultaneous. That is, for each application of a certain group of DC supplies we need to
find the corresponding H-model of all m ports of N
1
. This process does two things:
i.
it generates m null ports one for each port , and
ii.
it finds the v and i values of the partial Q points for all ports at the same instance.
Again, we must emphasize that this additivity procedure is applied to circuits with simple
operating points; where, for each port, any route taken ends up at a fixed location (Q-point)
on the characteristic curve. For circuits with multiple Q-points the procedure works as well,
except we may reach to different Q-points when we follow different sequences of supply
groups.
This additivity property provides a new and remarkable methodology for the analysis and
simulation of nonlinear circuit with multiple nonlinear components. Another unique feature
New Port Modeling and Local Biasing of Analog Circuits
73
of the additivity property is that it provides a simple mechanism through which we can
arbitrarily and gradually (ladder type) replace the normal supplies in an amplifier with
supplies that locally bias the individual transistors. Conversely, in a design procedure, we
can start with local biasing the transistors to get them to the desired Q-points; then move
and combine the distributed supplies (by techniques such as source transformation) to
merge into normal circuit supplies such as V
DD
, V
CC
.
Algorithm 1 provides a circuit analysis procedure based of the progressive biasing stated in
Corollary 2.
Algorithm 1:
1. Given a nonlinear circuit, first identify all nonlinear devices and put them into one
nonlinear network N
2
with m ports, j(v
j
, i
j
), connected to the rest of the circuit as a linear
network N
1
.
2.
Select a grouping scheme for the DC supplies and put them into an arbitrary sequence
that best performs the biasing of m ports in N
2
. The sequence selected should possibly
guaranty a quick convergence. This is a crucial step and needs design experience to
achieve a good result.
3.
Keep the first group of supplies in N
1
and remove the rest. Assume this group of
supplies makes N
2
to operate at Q
1
(V
1
, I
1
) on the characteristic curve (for simplicity the
algorithm is given for one port but it is extendable to all m ports, as well). Next,
augment the port with I
1
and V
1
sources for local biasing, and remove the first group of
supplies from N
1
. This will create a nullified port.
4.
Include the second group of supplies into N
1
and remove the rest. This will cause the
operating point to move from Q
1
(V
1
, I
1
) (now the origin) to Q
2
(V
2
, I
2
), which is the new
operating point.
5.
Continue with step 4 until all groups of supplies are sequentially applied.
6.
The biasing of the transistors is complete and the entire circuit N
1
plus N
2
is ready
for the application of the AC signals. The output signal, in this case, is only AC without
being mixed with any DC component.
The following two examples are going through the progressive biasing procedure by using
Algorithm 1.
Example 7: Figure 26(a) shows part of the circuit of the MC1553, a three stage BJT amplifier
with feedback [11]. The circuit apparently works (biases) with a single supply of V
CC
= 9V.
To produce a progressive biasing for the amplifier we have spit the 9 volt supply into four
separate unspecified supplies V
BB
, V
CC
, V
DD
, and V
EE
, shown in Fig. 26(b). Note that we have
also replaced the transistors with their locally biased counterparts; where each transistor has
its own voltage sources V
BE
and V
CE
, and current sources I
B
and I
C
used for the local biasing,
as depicted in Fig. 19. Next, we are going to make three groups of supplies: (V
CC
= 5V and
V
DD
= 9V), (V
BB
= 7V and V
EE
= 9V) and (V
BB
= 2V and V
CC
= 4V), and then apply Corollary 2
for a progressive biasing procedure. Table IV is the result of this biasing procedure. Column
2 in the table displays the biasing results (Q-points) of the transistors when the original
circuit of Fig. 26(a) is used. Columns 3, 4 and 5 are the results of the progressive biasing
sequentially applying the groups of supplies as indicated. As shown, column 5, which is the
accumulation of all the three steps, is identical to column 2, as expected. Another interesting
observation from Table IV is that, although the transistors may go into different modes of
operations in the progressive biasing – such as saturation or cut off, for example – the results
are coming out correctly at the end.