Biomedical Engineering Trends Research and Technologies Part 11 pptx
Bạn đang xem bản rút gọn của tài liệu. Xem và tải ngay bản đầy đủ của tài liệu tại đây (4.92 MB, 40 trang )
Biomedical Engineering, Trends, Research and Technologies
390
Percentage of total fatty acids in PE
1
Fatty acid
component
Winter Spring Summer Autumn
14:0 1.0 ± 0.5
2.8 ± 0.4
1.6 ± 0.4
1.3 ± 0.5
14:1 n-5 0.5 ± 0.2
1.6 ± 0.2
0.6 ± 0.3
0.4 ± 0.3
16:0 21.0 ± 3.7
38.0 ± 2.8 22.2 ± 3.5
23.4 ± 8.2
16:1 n-7 5.4 ± 1.9
8.2 ± 1.0
6.3 ± 1.2 4.9 ± 1.9
18:0 11.1 ± 1.0 13.9 ± 3.0 11.8 ± 0.4 13.4 ± 4.4
18:1 n-9 17.3 ± 3.9
12.5 ± 2.4 13.6 ± 2.7 12.3 ± 3.5
18:2 n-6 4.5 ± 4.7
0.4 ± 0.3
0.5 ± 0.3
0.9 ± 0.3
20:0 0.2 ± 0.2 0.1 ± 0.1 0.1 ± 0.1 0.2 ± 0.2
18:3 n-3 1.5 ± 1.0
0.3 ± 0.2
0.4 ± 0.7
0.7 ± 0.7
20:1 n-9 0.4 ± 0.3
0.3 ± 0.1 0.8 ± 0.8 0.7 ± 0.8
22:0 0.2 ± 0.2 0.1 ± 0.0 Trace
0.7 ± 0.9
20:4 n-6 9.4 ± 2.7
6.2 ± 0.8
10.8 ± 1.4
8.2 ± 2.5
22:1 n-11 0.2 ± 0.3 Trace 0.3 ± 0.6 0.1 ± 0.3
20:5 n-3 7.7 ± 2.8 5.6 ± 2.2 7.4 ± 0.7 5.5 ± 3.6
24:0 Trace
2
0.1 ± 0.3 0.3 ± 0.6 0.3 ± 0.9
22:3 n-3 1.1 ± 0.6 0.9 ± 0.3 0.8 ± 0.7 2.7 ± 3.6
24:1 n-9 0.3 ± 0.2
0.1 ± 0.1
0.4 ± 0.5
1.8 ± 1.4
22:6 n-3 18.5 ± 1.1 9.0 ± 4.7
22.0 ± 1.6
22.4 ± 9.9
MUFA + DUFA 28.4 ± 6.7
23.0 ± 2.3 22.6 ± 2.6 21.2 ± 4.6
PUFA 38.2 ± 5.5
22.0 ± 7.3
41.4 ± 1.2
39.5 ± 12.6
Σ UFA 66.6 ± 4.8
45.1 ± 5.3
64.0 ± 3.4
60.7 ± 10.4
EPA + DHA 26.2 ± 3.1
14.7 ± 6.4
29.4 ± 1.3
27.9 ± 11.3
Σ SFA 33.4 ± 4.8
54.9 ± 5.3
36.0 ± 3.4
39.3 ± 10.4
Unsaturation
index
2.30 1.34 2.39 2.27
n-3/n-6 2.08 2.40 2.72 3.45
Table 5. Fatty acid composition of phosphatidylethanolamine-PE (polar lipid fraction) of
Diplodus sargus, L. liver with seasonal variation (expressed as percentage of total identified
fatty acids).
1
Values are mean ± SD;
2
Trace, <0.1%.
Fish Lipids as a Source of Healthy Components: Fatty Acids from Mediterranean Fish
391
3.1.2 Diplodus vulgaris, L.
The fatty acid compositions of neutral (TAG) and polar (PI/PS, PC, PE) lipid fractions of D.
vulgaris liver, as well as other fatty acid parameters, have been determined during four
different seasons. Results are shown in Tables 6 to 9. The relative ratios of each fatty acid
are expressed as mean values ± SD, representing the fraction (%) of total identified fatty
acids. The degree of unsaturation, expressed as unsaturation index and the n-3/n-6 ratio
were also determined.
Percentage of total fatty acids in TAG
1
Fatty acid
component
Winter Spring Summer Autumn
14:0 5.5 ± 1.1 3.3 ± 1.7 5.2 ± 1.4 4.9 ± 2.1
14:1 n-5 0.9 ± 0.6 0.6 ± 0.1 0.7 ± 0.4 0.9 ± 0.7
16:0 21.8 ± 3.2 25.0 ± 4.5 24.4 ± 3.8 27.4 ± 4.5
16:1 n-7 9.1 ± 1.9 8.1 ± 4.0 9.0 ± 3.8 6.7 ± 2.9
18:0 6.8 ± 2.6 9.3 ± 4.1 11.6 ± 5.0 12.1 ± 4.0
18:1 n-9 20.6 ± 4.8 23.7 ± 5.3 22.4 ± 5.0 16.0 ± 5.3
18:2 n-6 1.1 ± 0.7 0.9 ± 0.3 0.8 ± 0.5 1.5 ± 1.1
20:0 0.4 ± 0.2 0.3 ± 0.3 0.2 ± 0.1 0.9 ± 0.8
18:3 n-3 0.8 ± 1.1 1.4 ± 1.5 0.1 ± 0.2 2.2 ± 1.0
20:1 n-9 0.9 ± 0.7 0.6 ± 0.7 1.3 ± 1.6 0.3 ± 0.2
22:0 0.3 ± 0.2 0.4 ± 0.2 0.4 ± 0.4 1.0 ± 0.7
20:4 n-6 4.5 ± 1.3 5.5 ± 2.0 4.7 ± 1.5 4.7 ± 1.0
22:1 n-11 0.2 ± 0.7 0.2 ± 0.7 Trace Trace
20:5 n-3 5.6 ± 1.5 5.7 ± 3.4 7.4 ± 3.3 6.4 ± 3.3
24:0 0.3 ± 0.7 Trace
2
0.2 ± 0.4 0.4 ± 0.8
22:3 n-3 2.6 ± 1.9 2.7 ± 1.2 2.2 ± 1.8 4.2 ± 1.8
24:1 n-9 0.2 ± 0.3 0.1 ± 0.1 Trace Trace
22:6 n-3 18.3 ± 4.3 12.4 ± 4.7 9.1 ± 2.6 10.4 ± 4.2
MUFA + DUFA 33.0 ± 7.0 34.2 ± 6.0 34.3 ± 7.8 25.5 ± 6.0
PUFA 31.9 ± 7.2 27.7 ± 9.1 23.6 ± 3.7 27.9 ± 6.3
Σ UFA 64.9 ± 6.2 61.9 ± 8.1 57.9 ± 8.5 51.7 ± 7.5
EPA + DHA 23.9 ± 4.7 18.1 ± 6.5 16.5 ± 4.0 16.7 ± 5.8
Σ SFA 35.0 ± 5.8 38.2 ± 8.0 42.1 ± 8.5 46.6 ± 5.1
Unsaturation
index
2.01 1.72 1.53 1.59
n-3/n-6 4.92 3.50 3.49 3.77
Table 6. Fatty acid composition of triacylglycerols-TAG (neutral lipid fraction) of Diplodus
vulgaris, L. liver with seasonal variation (expressed as percentage of total identified fatty
acids).
1
Values are mean ± SD;
2
Trace, <0.1%.
Biomedical Engineering, Trends, Research and Technologies
392
Percentage of total fatty acids in PI/PS
1
Fatty acid
component
Winter Spring Summer Autumn
14:0 1.4 ± 0.7 3.0 ± 1.5 2.0 ± 0.9 1.4 ± 0.6
14:1 n-5 0.1 ± 0.1 0.7 ± 0.3 0.8 ± 0.5 0.1 ± 0.1
16:0 14.4 ± 1.6 38.9 ± 7.0 43.0 ± 9.4 14.4 ± 1.4
16:1 n-7 1.3 ± 0.7 2.6 ± 1.2 2.7 ± 0.6 1.3 ± 0.6
18:0 38.6 ± 5.0 33.4 ± 4.7 30.8 ± 8.2 39.7 ± 5.2
18:1 n-9 13.9 ± 5.2 9.9 ± 4.9 8.2 ± 3.0 13.6 ± 4.6
18:2 n-6 0.7 ± 0.7 0.8 ± 0.5 0.6 ± 0.7 0.7 ± 0.6
20:0 0.6 ± 0.2 0.4 ± 0.1 0.5 ± 0.6 0.7 ± 0.3
18:3 n-3 0.2 ± 0.5 0.2 ± 0.2 0.1 ± 0.2 0.2 ± 0.4
20:1 n-9 0.8 ± 0.6 1.4 ± 0.8 0.4 ± 0.4 0.9 ± 0.6
22:0 0.7 ± 0.4 1.4 ± 1.4 0.6 ± 0.5 0.8 ± 0.4
20:4 n-6 8.8 ± 5.4 1.5 ± 1.9 3.9 ± 4.1 8.1 ± 5.0
22:1 n-11 0.1 ± 0.2 0.1 ± 0.1 Trace 0.4 ± 0.7
20:5 n-3 3.1 ± 1.7 1.1 ± 0.9 1.8 ± 1.7 2.6 ± 1.8
24:0 0.8 ± 1.1 0.2 ± 0.3 0.2 ± 0.6 0.7 ± 1.0
22:3 n-3 7.8 ± 3.5 2.6 ± 1.3 1.5 ± 1.4 8.5 ± 3.5
24:1 n-9 0.2 0.3 ± 0.3 Trace 0.1 ± 0.2
22:6 n-3 6.5 ± 2.7 1.5 ± 1.1 2.8 ± 2.5 5.7 ± 3.0
MUFA + DUFA 17.1 ± 5.1 15.8 ± 4.4 12.9 ± 2.8 17.2 ± 4.5
PUFA 26.4 ± 7.9 6.8 ± 3.1 10.1 ± 6.3 25.0 ± 7.6
Σ UFA 43.5 ± 5.6 22.7 ± 7.2 23.0 ± 8.4 42.2 ± 5.7
EPA + DHA 9.6 ± 3.5 2.6 ± 1.8 4.6 ± 3.1 8.3 ± 4.1
Σ SFA 56.5 ± 5.6 77.4 ± 7.2 77,0 ± 8.4 57.8 ± 5.7
Unsaturation
index
1.32 0.45 0.60 1.23
n-3/n-6 2.54 1.70 2.19 2.54
Table 7. Fatty acid composition of phosphatidylinositol-PI/phosphatidylserine-PS (polar
lipid fractions) of Diplodus vulgaris, L. liver with seasonal variation (expressed as percentage
of total identified fatty acids).
1
Values are mean ± SD;
2
Trace, <0.1%.
Fish Lipids as a Source of Healthy Components: Fatty Acids from Mediterranean Fish
393
Percentage of total fatty acids in PC
1
Fatty acid
component
Winter Spring Summer Autumn
14:0 3.2 ± 1.1 2.4 ± 0.6 2.0 ± 0.5 0.8 ± 0.6
14:1 n-5 0.8 ± 0.5 0.7 ± 0.5 0.8 ± 0.3 0.2 ± 0.1
16:0 37.0 ± 5.3 35.5 ± 7.8 37.2 ± 6.4 12.7 ± 1.4
16:1 n-7 5.5 ± 1.8 5.5 ± 2.6 3.9 ± 2.9 1.8 ± 0.3
18:0 8.7 ± 4.8 12.8 ± 9.2 13.7 ± 4.1 33.8 ± 7.4
18:1 n-9 13.8 ± 5.4 15.1 ± 3.7 11.0 ± 1.3 8.2 ± 1.2
18:2 n-6 0.7 ± 0.4 0.4 ± 0.4 0.7 ± 0.5 0.4 ± 0.2
20:0 0.3 ± 0.3 0.1 ± 0.1 0.2 ± 0.2 0.1 ± 0.1
18:3 n-3 0.2 ± 0.4 0.1 ± 0.3 0.6 ± 0.5 0.7 ± 0.5
20:1 n-9 0.4 ± 0.5 0.5 ± 0.3 0.7 ± 0.5 0.3 ± 0.3
22:0 0.1 ± 0.1 0.4 ± 0.4 0.2 ± 0.2 0.8 ± 0.6
20:4 n-6 3.9 ± 1.4 7.1 ± 1.7 7.5 ± 3.3 12.3 ± 3.7
22:1 n-11 0.1 ± 0.2 0.3 ± 0.6 0.1 ± 0.1 0.8 ± 1.0
20:5 n-3 6.3 ± 1.6 6.2 ± 0.9 5.9 ± 1.7 4.5 ± 1.1
24:0 Trace
2
0.1 ± 0.1 Trace 0.4 ± 0.5
22:3 n-3 1.1 ± 0.5 0.7 ± 0.5 1.2 ± 0.7 7.5 ± 4.9
24:1 n-9 0.2 ± 0.2 0.4 ± 0.3 0.4 ± 0.4 Trace
22:6 n-3 17.6 ± 6.9 11.5 ± 6.7 14.1 ± 5.1 14.7 ± 5.2
MUFA + DUFA 21.4 ± 6.4 23.0 ± 1.1 17.6 ± 2.7 11.7 ± 1.2
PUFA 29.2 ± 8.7 24.3 ± 8.8 29.2 ± 7.7 39.6 ± 7.2
Σ UFA 50.6 ± 5.1 47.3 ± 8.5 46.8 ± 5.5 51.4 ± 7.2
EPA + DHA 24.0 ± 8.0 16.2 ± 8.4 20.0 ± 5.7 19.1 ± 5.8
Σ SFA 49.4 ± 5.1 52.4 ± 8.1 53.2 ± 5.5 48.6 ± 7.2
Unsaturation
index
1.79 1.54 1.67 1.96
n-3/n-6 5.67 2.68 2.37 2.43
Table 8. Fatty acid composition of phosphatidylcholine-PC (polar lipid fraction) of Diplodus
vulgaris, L. liver with seasonal variation (expressed as percentage of total identified fatty
acids).
1
Values are mean ± SD;
2
Trace, <0.1%.
Biomedical Engineering, Trends, Research and Technologies
394
Percentage of total fatty acids in PE
1
Fatty acid
component
Winter Spring Summer Autumn
14:0 1.1 ± 0.3 2.2 ± 0.5 2.0 ± 0.5 2.0 ± 0.8
14:1 n-5 0.2 ± 0.1 0.6 ± 0.3 0.8 ± 0.3 0.5 ± 0.3
16:0 21.5 ± 2.8 37.0 ± 8.5 37.2 ± 6.4 26.0 ± 3.0
16:1 n-7 4.6 ± 0.9 7.2 ± 0.2 3.9 ± 2.9 6.9 ± 2.3
18:0 14.2 ± 4.1 11.8 ± 1.4 13.7 ± 4.1 14.9 ± 2.0
18:1 n-9 24.2 ± 4.5 17.8 ± 2.6 11.0 ± 1.3 11.4 ± 2.0
18:2 n-6 0.5 ± 0.3 0.6 ± 0.4 0.7 ± 0.5 0.7 ± 0.3
20:0 0.3 ± 0.1 0.1 ± 0.1 0.2 ± 0.2 0.2 ± 0.1
18:3 n-3 1.0 ± 1.3 0.3 ± 0.4 0.6 ± 0.5 0.2 ± 0.1
20:1 n-9 0.5 ± 0.8 0.7 ± 0.2 0.7 ± 0.5 0.2 ± 0.2
22:0 0.1 ± 0.1 0.3 ± 0.1 0.2 ± 0.2 0.3 ± 0.1
20:4 n-6 5.6 ± 3.7 4.9 ± 2.2 7.5 ± 3.3 6.7 ± 1.5
22:1 n-11 Trace
2
Trace 0.1 ± 0.1 0.2 ± 0.2
20:5 n-3 5.2 ± 1.6 5.4 ± 1.9 3.8 ± 2.1 5.3 ± 1.1
24:0 Trace 0.1 ± 0.2 Trace Trace
22:3 n-3 1.5 ± 0.8 1.1 ± 0.4 1.8 ± 1.4 1.7 ± 0.8
24:1 n-9 0.4 ± 0.5 0.3 ± 0.3 0.1 ± 0.2 Trace
22:6 n-3 19.0 ± 7.1 9.7 ± 4.7 8.5 ± 4.2 22.9 ± 2.7
MUFA + DUFA 30.4 ± 3.6 27.2 ± 2.5 26.4 ± 5.9 19.9 ± 3.9
PUFA 32.3 ± 9.2 21.3 ± 8.8 20.4 ± 6.5 36.8 ± 4.0
Σ UFA 62.7 ± 6.4 48.5 ± 9.4 46.8 ± 7.7 56.7 ± 2.6
EPA + DHA 24.1 ± 7.3 15.1 ± 6.4 12.3 ± 4.7 28.2 ± 3.1
Σ SFA 37.3 ± 6.4 51.5 ± 9.4 53.2 ± 5.5 43.3 ± 2.6
Unsaturation
index
2.01 1.36 1.67 2.17
n-3/n-6 4.37 3.12 2.37 4.23
Table 9. Fatty acid composition of phosphatidylethanolamine-PE (polar lipid fraction) of
Diplodus vulgaris, L. liver with seasonal variation (expressed as percentage of total identified
fatty acids).
1
Values are mean ± SD;
2
Trace, <0.1%.
Fish Lipids as a Source of Healthy Components: Fatty Acids from Mediterranean Fish
395
Eighteen different fatty acids were identified in analyzed D. sargus and D. vulgaris liver
lipid fractions samples. The major constituents of total fatty acids were saturates: palmitic
(16:0) and stearic acid (18:0); monounsaturated fatty acids: oleic (18:1 n-9) and palmitoleic
acid (16:1 n-7), while arachidonic acid (20:4 n-6), EPA (20:5 n-3) and DHA (22:6 n-3) were
the major constituents among polyunsaturated fatty acids. The fatty acid amounts and
ratios differed significantly among seasons. Palmitic acid was the predominant saturated
fatty acid. Oleic acid and DHA were the predominant unsaturated fatty acids. An
accentuated seasonality pattern was found for these fatty acids. The same observation was
made for D. sargus captured along the eastern Mediterranean coast of Turkey (Ozyurt et
al., 2005; Imre & Saglik, 1998). The seasonal changes in the contents of these fatty acids
were previously recorded for gilthead sea bream (Sparus aurata) (Grigorakis et al., 2002),
for Baltic herring (Clupea harengus membras) (Aro et al., 2000), and some other fish species
(Luzia et al., 2003; Tanakol et al., 1999). Furthermore, observations regarding the
seasonality of fatty acid composition in D. vulgaris caught in other areas of the
Mediterranean Sea that were previously published (Donato et al., 1984) are in agreement
with the results of this study.
The results of our study revealed that total unsaturated fatty acids (UFAs) in all analyzed
lipid fractions were the highest in the winter period in both D. sargus and D. vulgaris,
except for PC in D. vulgaris where slightly higher total UFAs were found in the autumn
perion. Likewise, the EPA+DHA values were the highest for all lipid fractions in both fish
in the winter period, except for PE in D. sargus, where EPA+DHA values were slightly
higher in the summer period while in D. vulgaris in the autumn period. In contrast,
saturated fatty acids (SFA) were the highest in the spring and summer period in all
analyzed lipid fractions. Neutral lipid fractions contained more UFAs in comparison with
polar lipid fractions during the year, except for PE in summer and autumn (D. sargus) and
autumn period (D. vulgaris). The decrease in the amount of UFAs in the analyzed fractions
from winter to spring was noticed, followed by an increase in the UFA content in summer
and autumn. In TAG, the UFAs were lower in all seasons in comparison with their highest
values achieved in winter in both fish species. In PE, the content of UFAs was higher in all
seasons compared to the lowest values in the spring also in both fish species. Similarly,
PUFA content also showed seasonal variations, having an even more accentuated pattern
of seasonality. Similar findings were reported by Donato et al. (1997) for D. sargus
originating from the Mediterranean Sea. We noticed that PI/PS had the highest content of
SFAs in all seasons with the highest values in the spring in both fish species. The lowest
total SFA in D. sargus and D. vulgaris were found in winter in all lipid fractions, except for
PC in D. vulgaris, where the lowest content of SFAs was determined in the autumn period.
These results are in agreement with previously reported findings for this fish species from
other catch areas among the Mediterranean coasts (Ozyurt et al., 2005). The observed
decrease in total SFA in the winter period is most probably due to the catabolization of
SFA in order to ensure the additional metabolic energy required in that period. Likewise,
they could be necessary for the increase in PUFA required for spawning in spring and
used in gonadal development.
The degree of fatty acid unsaturation, expressed as unsaturation index, differed among the
analyzed lipid fractions in both fish species thorough the year. It was the highest for TAG in
winter and the lowest for PI/PS in spring both in D. sargus and D. vulgaris, which reflects
Biomedical Engineering, Trends, Research and Technologies
396
the fatty acid compositions in those seasons. It was observed that unsaturation indices in
different lipid fractions achieved their highest values mostly in the winter period. This is in
agreement with the previously published observation that a decrease in water temperature
results in an increase in the degree of unsaturation (Henderson & Tocher, 1987). This could
be explained by the fact that a higher degree of fatty acid unsaturation is essential to
maintain the flexibility of membrane phospholipids at lower temperatures (Lovell, 1991).
The content of n-3 PUFA, EPA and DHA is especially important for their beneficial effects.
The highest EPA+DHA values were noticed in TAG in the winter period in both fish
species, except for PE in D. vulgaris, where the highest EPA+DHA values were determined
in the autumn period. On the other hand, the lowest but still appreciable EPA+DHA values
were always detected in PI/PS, and also showed seasonal variations. Considerable amounts
of EPA+DHA in D. sargus and D. vulgaris liver make them potentially important for
exploitation in pharmaceutical and other industries as a potential raw material for dietary
omega-3 supplements and other fish-based oil products.
Growing scientific evidence shows that n-3 fatty acids are important in the prevention and
amelioration of different chronic disorders (Lloret, 2010). Increasing knowledge suggests
that the n-3/n-6 ratio could be used as a biomedical index. The n-3/n-6 ratios were
calculated for all lipid fractions in both fish liver samples. Fatty acids of D. sargus and D.
vulgaris liver lipids have an n-3/n-6 ratio between 1 and 6, which is mostly in agreement
with previously reported findings for these fish genus (Donato et al. 1997). The n-3/n-6 ratio
is also a good marker for comparing nutritional value of fish oils. It is considered to be the
most important indicator of fish lipid quality, which best reflects the quality of fish as food
(Hu et al., 2002).
3.2 Edible muscle tissue fatty acid composition of fish originating from north
Adriatic Sea
3.2.1 Diplodus vulgaris, L.
D. vulgaris edible muscle tissue was analyzed and fatty acid compositions of neutral and
polar lipid fractions in winter and summer were determined. Body weights of analyzed D.
vulgaris specimens ranged from 200 to 400 g, with average lengths from 16 to 20 cm. Those
values are within the limits reported in the literature (Jardas, 1996). The total lipid
content, expressed on a wet weight basis (%, w/w), amounted to 1.0 ± 0.4% in the winter
period and 0.9 ± 0.3% in the summer period. According to the lipid content classification,
this fish species belongs to low-fat fish (Ackman, 1989). The water content in fish tissue
samples amounted to 77.8 ± 2.7% in the winter period and 76.6 ± 1.7% in the summer
period.
The fatty acid compositions of neutral (TAG) and polar (PI/PS, PC, PE) lipid fractions of
D. vulgaris edible muscle tissue, as well as other fatty acid parameters, have been
determined during summer and winter periods. Results are presented in Table 10 and 11.
The relative ratios of each fatty acid are expressed as mean values ± SD, representing the
fraction (%) of total identified fatty acids. The analyzed fatty acids were also grouped as
saturated (SFA), monounsaturated (MUFA), diunsaturated (DUFA), while tri-, tetra-,
penta-, and hexaenoic fatty acids were grouped as polyunsaturated fatty acids (PUFA).
The degree of unsaturation, expressed as unsaturation index, and the n-3/n-6 ratio were
also determined.
Fish Lipids as a Source of Healthy Components: Fatty Acids from Mediterranean Fish
397
Percentage of total fatty acids in winter period
1
Fatty acid
component
TAG PI/PS PC PE
14:0 5.9 ± 1.0 2.2 ± 1.9 1.4 ± 0.3 4.6 ± 4.3
16:0 21.9 ± 3.6 24.0 ± 8.5 44.7 ± 7.6 25.2 ± 7.0
16:1 n-7 10.7 ± 1.7 1.8 ± 2.0 5.3 ± 0.5 4.3 ± 1.9
18:0 6.6 ± 0.9 17.2 ± 6.1 9.5 ± 4.0 20.7 ± 10.5
18:1 n-9 32.8 ± 3.9 24.4 ± 15.0 19.9 ± 6.8 19.9 ± 5.8
18:2 n-6 1.9 ± 0.7 1.8 ± 1.8 1.6 ± 0.8 3.9 ± 4.0
20:0 0.6 ± 0.4 0.2 ± 0.5 0.2 ± 0.3 0.8 ± 0.9
18:3 n-3 2.6 ± 2.3 Trace
2
0.8 ± 0.9 1.2 ± 1.5
20:1 n-9 2.5 ± 1.8 4.2 ± 3.9 0.9 ± 0.4 2.2 ± 1.4
22:0 0.3 ± 0.5 1.5 ± 2.0 1.5 ± 2.3 1.0 ± 2.5
20:4 n-6 4.3 ± 1.8 7.4 ± 6.3 4.2 ± 4.8 6.7 ± 2.0
22:1 n-11 1.0 ± 1.6 2.1 ± 2.6 1.3 ± 2.5 0.3 ± 0.7
20:5 n-3 4.1 ± 0.9 0.9 ± 1.6 3.7 ± 2.7 2.7 ± 1.3
24:0 0.1 ± 0.2 1.0 ± 1.6 0.4 ± 0.4 0.4 ± 0.8
22:3 n-3 2.2 ± 1.2 9.9 ± 9.1 1.1 ± 1.0 0.9 ± 0.8
22:6 n-3 2.6 ± 1.8 1.3 ± 2.3 3.6 ± 2.7 5.3 ± 2.4
MUFA + DUFA 48.8 ± 4.9 34.3 ± 14.8 29.0 ± 7.0 30.6 ± 7.9
PUFA 15.7 ± 4.0 19.6 ± 12.3 13.3 ± 10.0 16.8 ± 7.9
Σ UFA 64.5 ± 3.3 53.8 ± 6.3 42.3 ± 9.1 47.4 ± 15.8
EPA + DHA 6.7 ± 2.6 2.2 ± 3.8 7.3 ± 4.5 8.0 ± 3.7
Σ SFA 35.4 ± 3.3 42.6 ± 6.3 57.7 ± 9.1 52.7 ± 26.0
Unsaturation
index
1.18 1.08 0.93 1.13
n-3/n-6 1.85 1.32 1.59 0.95
Table 10. Fatty acid composition of neutral (triacylglycerols, TAG) and polar
(phosphatidylinositol, PI; phosphatidylserine, PS; phosphatidylcholine, PC; and
phosphatidylethanolamine, PE) lipid fractions of Diplodus vulgaris, L. edible muscle tissue in
the winter period (expressed as percentage of total identified fatty acids).
1
Values are mean
± SD;
2
Trace, <0.1%.
Biomedical Engineering, Trends, Research and Technologies
398
Percentage of total fatty acids in summer period
1
Fatty acid
component
TAG PI/PS PC PE
14:0 4.9 ± 1.1 1.5 ± 0.9 2.2 ± 1.7 0.7 ± 0.1
16:0 23.1 ± 2.4 29.6 ± 5.0 22.5 ± 8.9 39.6 ± 10.3
16:1 n-7 7.3 ± 2.2 2.6 ± 2.9 3.6 ± 3.6 2.9 ± 0.9
18:0 11.4 ± 2.2 32.6 ± 16.3 36.5 ± 16.8 24.3 ± 20.4
18:1 n-9 21.7 ± 2.5 5.9 ± 6.4 11.7 ± 8.5 15.0 ± 1.1
18:2 n-6 2.8 ± 0.9 1.1 ± 1.0 1.5 ± 1.1 0.4 ± 0.3
20:0 0.3 ± 0.2 0.8 ± 0.1 0.5 ± 0.4 Trace
18:3 n-3 0.5 ± 0.6 0.8 ± 1.1 0.4 ± 0.5 0.1 ± 0.2
20:1 n-9 1.8 ± 1.7 0.8 ± 1.4 0.5 ± 0.4 0.2 ± 0.2
22:0 0.7 ± 0.3 1.8 ± 1.4 1.1 ± 0.5 0.5 ± 0.7
20:4 n-6 6.6 ± 2.7 7.7 ± 9.9 5.7 ± 4.2 4.9 ± 5.5
22:1 n-11 Trace
2
1.0 ± 1.4 Trace 0.1 ± 0.1
20:5 n-3 6.0 ± 2.0 1.7 ± 2.2 1.4 ± 1.6 2.1 ± 2.8
24:0 0.1 ± 0.2 1.9 ± 4.0 0.3 ± 0.2 0.1 ± 0.1
22:3 n-3 5.1 ± 0.5 6.6 ± 3.3 7.5 ± 2.1 3.6 ± 2.3
22:6 n-3 7.9 ± 1.0 3.7 ± 5.3 4.7 ± 2.9 5.5 ± 5.7
MUFA + DUFA 33.6 ± 2.5 11.3 ± 6.9 17.4 ± 11.6 18.5 ± 1.3
PUFA 26.0 ± 4.8 20.5 ± 13.7 19.7 ± 5.9 15.9 ± 13.4
Σ UFA 59.6 ± 4.3 31.8 ± 14.1 37.1 ± 11.8 34.4 ± 14.3
EPA + DHA 13.8 ± 2.8 5.4 ± 6.4 6.1 ± 3.8 7.3 ± 8 6
Σ SFA 40.4 ± 4.3 68.2 ± 14.1 64.5 ± 10.8 65.3 ± 14.1
Unsaturation
index
1.56 0.96 1.01 0.93
n-3/n-6 2.07 1.45 1.94 2.13
Table 11. Fatty acid composition of neutral (triacylglycerols, TAG) and polar
(phosphatidylinositol, PI; phosphatidylserine, PS; phosphatidylcholine, PC; and
phosphatidylethanolamine, PE) lipid fractions of Diplodus vulgaris, L. edible muscle tissue in
the summer period (expressed as percentage of total identified fatty acids).
1
Values are
mean ± SD;
2
Trace, <0.1%.
Fish Lipids as a Source of Healthy Components: Fatty Acids from Mediterranean Fish
399
Sixteen different fatty acids were identified in D. vulgaris edible muscle tissue lipid fractions.
The major constituents of total FA in winter and summer were saturates: palmitic (16:0) and
stearic acids (18:0); monoenes: oleic (18:1n-9) and palmitoleic acids (16:1); and polyunsaturates:
arachidonic acid (20:4n-6), EPA (20:5n-3), and DHA (22:6n-3). The amounts and ratios of major
FA identified in our study (16:0, 18:0, and 18:1n-9) differed significantly between the two
seasons and between lipid fractions. A similar observation for this fish species in other areas of
catch in the Adriatic Sea is available in literature (Donato et al., 1984). A statistically significant
difference (P < 0.0001) in oleic acid (18:1n-9) content was found between summer and winter.
This FA showed the greatest seasonal variation in our study, followed by 18:0 and 16:0. Values
for 18:0 in TAG and PC were found to be statistically different (P < 0.0001) during the two
periods. The content of 18:0 was considerably higher in summer, when the relative ratio of 18:0
was almost two times higher for TAG and almost four times higher for PC than in the winter
period. No statistically significant seasonal variation was detected in the relative ratio of 16:0 in
TAG and PI/PS, but it was noticeable in PC and PE (P < 0.05). Values for 16:0 were twice as
high in winter in PC. In contrast, for PE the relative ratio of 16:0 was much higher in the
summer. The content of 18:1n-9 significantly decreased from winter to summer (P < 0.05).
These results are also in agreement with the results of Donato et al. (1984) for D. vulgaris
originating from the Adriatic Sea.
The concentrations of n-3 PUFA, EPA, and DHA are significant for their confirmed
biomedical importance. Greater amounts in EPA and DHA were found in TAG in the
summer period. No such enhanced difference was found in polar lipid fractions. EPA +
DHA values were twice as high in the summer period in TAG and PI/PS. Appreciable
quantities of 20:4n-6 and 22:3n-3 were also found in all the lipid fractions, with statistically
significant seasonal differences (P < 0.0001) in TAG, PC, and PE for 22:3n-3. Seasonal
variation in the content of 20:4n-6 was significant only in TAG (P < 0.05).
Generally, MUFA + DUFA values were significantly higher in winter. On the other hand,
PUFA values were higher in summer, especially in TAG. SFA values were also higher in
summer. The diminution of the MUFA content in the summer was clearly accompanied by
an increase in PUFA content. This is in agreement with the observations of Donato et al.
(1984).
The TAGs serve as a store for SFA for energy purposes, and they also may be a temporary
PUFA reservoir (Napolitano et al., 1988). They could be forwarded to the synthesis of
structural lipids or directed to specific metabolic pathways. Statistically significant seasonal
differences (P < 0.05 and P < 0.0001) were most conspicuous in TAG for all detected FA
except 16:0, 20:0, 18:3n-3, 20:1n-9, 22:1n-11, and 24:0. Pazos et al. (1996) reported a similar
observation. On the other hand, statistically significant differences (P < 0.05 and P < 0.0001)
in polar lipid fractions (PI/PS, PC, and PE) were found to be less noticeable, especially in
PI/PS, where statistically significant seasonal variation was found only for 18:1n-9 (P <
0.0001).
The degree of unsaturation, expressed as the unsaturation index, also differed between
neutral and polar lipid fractions. It was highest in TAG during the summer while the lowest
index was determined in PC n the winter and PE in the summer period.
Emphases on n-3 PUFA over n-6 PUFA propose that the n-3/n-6 ratio could be applied as
a biomedical index. Therefore, the n-3/n-6 ratio is a biomedical marker for fish lipids. N-
3/n-6 ratios were calculated for all the lipid fractions in analyzed fish muscle tissue
Biomedical Engineering, Trends, Research and Technologies
400
samples. FA in D. vulgaris muscle tissue lipids have an n-3/n-6 ratio between 1 and 2,
which is relatively good. But it must be emphasized that all the ratios were higher in the
summer period.
Results of our study indicate that D. vulgaris is a good source of natural n-3 PUFA and
would therefore be suitable for inclusion in highly unsaturated low-fat diets. Our results are
in agreement with other published results for teleost fish species originating from the
Mediterranean and Adriatic Sea (Donato et al., 1984; Passi et al., 2002).
Seasonal variations of FA composition have previously been studied for different fish
species (Mayzaud et al., 1999; Pazos et al., 1996, Donato et al. 1984). An inverse relationship
between water temperature and the amount of PUFA in tissue lipids of fish and
invertebrates has been shown (Hazel, 1979). Seasonal variation of n-3 PUFA seems to be
linked to the diet as well as the reproductive cycle (Donato et al., 1984).
In this study, the FA composition in edible muscle tissue of D. vulgaris showed a significant
variation from winter to summer. The seasonal variations in D. vulgaris lipids reflected
fluctuations mainly in TAG. But it must also be emphasized that the reproductive cycle of D.
vulgaris correlates with those seasons, since previtellogenesis occurs in winter and
vitellogenesis occurs in summer (Donato et al., 1984). It can be concluded that, although the
FA composition of fish is complex and depends on many factors, it clearly shows a seasonal
pattern of distribution.
3.3 Edible muscle tissue fatty acid composition of fish originating from middle
Adriatic Sea
Diplodus vulgaris, L. and Conger conger, L. edible muscle tissue fatty acid compositions
were also determined. Fish were caught in the Šibenik basin, Middle Adriatic Sea as
previously described. Data on moisture content, total lipids, polar and neutral lipid
contents, expressed as a percentage (%) in analysed fish muscle tissue samples, are shown
in Table 12. It was found that the total lipids (TL, percentage of wet weight of muscle
tissues) in C. conger (3.7 ± 0.2 %) were almost three times higher than in D. vulgaris (1.3 ±
0.2 %). Moisture content was also higher in C. conger (77.5 ± 2.1 %) in comparison with D.
vulgaris (76.7 ± 1.3 %). Polar lipids (PL, % of total lipids) were almost twice higher in D.
vulgaris (28.1 ± 4.2) than in C. conger (15.5 ± 0.2 %). Neutral lipids (NL, % of total lipids)
were present in higher proportions, (71.9 ± 4.2 %) in D. vulgaris and (84.5 ± 0.2 %) in C.
conger.
Fish species
Moisture
content (%)
Total lipids
(%)
Polar lipids
(%)
Neutral lipids
(%)
Diplodus vulgaris. L.
76.7 ± 1.3 1.3 ± 0.2 28.1 ± 4.2 71.9 ± 4.2
Conger conger, L.
77.5 ± 2.1 3.7 ± 0.2 15.5 ± 0.2 84.5 ± 0.2
Table 12. Moisture content, total lipids, polar lipids and neutral lipids in Diplodus vulgaris, L.
and Conger conger, L. edible muscle tissue.
Fish Lipids as a Source of Healthy Components: Fatty Acids from Mediterranean Fish
401
Percentage of total fatty acids
1
Fatty acid
component
TAG PI/PS PC PE
14:0 7.0 ± 1.5 0.8 ± 0.9 2.3 ± 0.2 4.4 ± 1.5
14:1 Trace
2
Trace
Trace Trace
15:0 0.7 ± 0.6 0.4 ± 0.8 1.9 ± 0.5 0.8 ± 1.1
16:0 25.4 ± 4.0 41.0 ± 22.2 63.9 ± 17.7 38.8 ± 13.1
16:1 12.5 ± 2.3 1.1 ± 1.5 3.7 ± 0.8 4.6 ± 3.3
17:0 1.4 ± 0.9 0.7 ± 1.0 2.3 ± 0.7 0.9 ± 1.3
17:1 0.3 ± 0.4 Trace Trace Trace
18:0 10.5 ± 3.1 43.4 ± 30.0 14.9 ± 17.4 19.6 ± 7.7
18:1 n-9t 0.2 ± 0.5 Trace Trace Trace
18:1 n-9c 20.4 ± 3.0 5.5 ± 1.8 8.8 ± 1.7 10.5 ± 1.4
18:2 n-6c 1.3 ± 0.8 Trace Trace 0.2 ± 0.5
18:3 n-6 0.1 ± 0.1 Trace Trace Trace
20:0 0.5 ± 0.5 Trace Trace 0.1 ± 0.3
18:3 n-3 0.1 ± 0.3 Trace Trace 0.2 ± 0.4
20:1 n-9 1.3 ± 1.0 Trace Trace 0.1 ± 0.3
21:0 Trace Trace Trace Trace
20:2 0.4 ± 0.5 Trace Trace 2.0 ± 4.1
20:3 n-3 0.1 ± 0.2 Trace Trace Trace
20:3 n-6 4.8 ± 1.6 1.2 ± 2.0 Trace 1.4 ± 1.8
22:1 n-9 0.1 ± 0.1 Trace Trace Trace
20:4 n-6 7.8 ± 3.5 0.7 ± 1.5 Trace 1.8 ± 2.6
22:2 Trace Trace 1.0 ± 2.0 Trace
20:5 n-3 1.4 ± 1.6 Trace Trace 3.8 ± 5.7
24:1 n-9 0.7 ± 1.1 3.2 ± 5.0 0.8 ± 1.5 4.0 ± 4.0
22:6 n-3 3.0 ± 4.1 2.2 ± 3.1 0.5 ± 1.0 6.9 ± 12.5
MUFA + DUFA 37.2 ± 1.4 9.7 ± 5.1 14.2 ± 3.4 21.5 ± 3.0
PUFA 17.2 ± 5.5 4.1 ± 5.8 0.5 ± 1.0 14.0 ± 22.9
Σ UFA 54.4 ± 5.9 13.8 ± 7.0 14.7 ± 3.8 35.5 ± 21.2
EPA + DHA 4.3 ± 3.0 2.2 ± 3.1 0.5 ± 1.0 10.7 ± 18.1
Σ SFA 45.6 ± 5.9 86.1 ± 7.0 85.3 ± 3.9 64.5 ± 21.4
Unsaturation
index
1.10 0.29 0.18 0.96
n-3/n-6 0.34 1.21 - 3.25
Table 13. Fatty acid composition of neutral (triacylglycerols, TAG) and polar
(phosphatidylinositol, PI; phosphatidylserine, PS; phosphatidylcholine, PC; and
phosphatidylethanolamine, PE) lipid fractions of Diplodus vulgaris, L. edible muscle tissue
(expressed as percentage of total identified fatty acids).
1
Values are mean ± SD;
2
Trace,
<0.1%.
Biomedical Engineering, Trends, Research and Technologies
402
Percentage of total fatty acids
1
Fatty acid
component
TAG PI/PS PC PE
14:0 5.6 ± 1.1 Trace 3.4 ± 0.4 5.8 ± 0.6
14:1 0.1 ± 0.2 Trace Trace Trace
15:0 0.9 ± 0.3 Trace 1.2 ± 1.2 5.3 ± 0.8
16:0 20.3 ± 1.3 18.9 ± 5.7 62.8 ± 6.3 44.8 ± 2.5
16:1 10.3 ± 2.0 Trace 4.3 ± 1.1 3.0 ± 4.2
17:0 0.8 ± 0.2 0.5 ± 1.2 0.5 ± 0.7 1.4 ± 2.0
17:1 0.6 ± 0.3 Trace Trace Trace
18:0 5.5 ± 0.7 58.7 ± 3.3 6.8 ± 1.4 22.1 ± 7.0
18:1 n-9c 23.1 ± 6.0 3.8 ± 3.8 13.6 ± 2.6 15.8 ± 3.2
18:2 n-6c 2.6 ± 0.9 Trace Trace Trace
20:0 0.4 ± 0.2 Trace Trace Trace
18:3 n-6 1.1 ± 0.6 Trace Trace Trace
20:1 n-9 0.7 ± 0.7 Trace Trace Trace
20:2 0.6 ± 0.4 Trace Trace Trace
20:3 n-3 0.2 ± 0.2 Trace Trace Trace
20:3 n-6 2.7 ± 0.7 Trace 1.5 ± 3.6 Trace
22:1 n-9 Trace
2
Trace Trace Trace
20:4 n-6 6.8 ± 2.2 Trace 1.9 ± 3.6 Trace
20:5 n-3 1.6 ± 1.7 5.3 ± 6.3 1.2 ± 1.7 2.0 ± 2.8
24:1 n-9 0.9 ± 0.6 4.8 ± 7.4 Trace Trace
22:6 n-3 15.4 ± 5.2 8.1 ± 10.7 2.9 ± 2.0 Trace
MUFA + DUFA 38.8 ± 7.9 8.6 ± 4.8 17.8 ± 2.2 18.8 ± 1.1
PUFA 27.7 ± 7.0 13.3 ± 9.3 7.6 ± 8.2 2.0 ± 2.8
Σ UFA 66.6 ± 1.3 22.0 ± 6.9 25.4 ± 6.1 20.8 ± 3.8
EPA + DHA 17.0 ± 5.0 13.3 ± 9.3 4.2 ± 2.7 2.0 ± 2.8
Σ SFA 33.7 ± 1.4 78.1 ± 7.0 74.6 ± 6.1 79.4 ± 3.9
Unsaturation
index
1.81 0.83 0.54 0.29
n-3/n-6 1.53 - 1.20 -
Table 14. Fatty acid composition of neutral (triacylglycerols, TAG) and polar
(phosphatidylinositol, PI; phosphatidylserine, PS; phosphatidylcholine, PC; and
phosphatidylethanolamine, PE) lipid fractions of Conger conger, L. edible muscle tissue
(expressed as percentage of total identified fatty acids).
1
Values are mean ± SD;
2
Trace,
<0.1%.
Fish Lipids as a Source of Healthy Components: Fatty Acids from Mediterranean Fish
403
D. vulgaris and C. conger belong to low-fat type fish, according to the lipid content
classification (Ackman, 1989). Total lipid content as well as polar and neutral lipid contents
in D. vulgaris and C. conger accord with the results for different Mediterranean marine fish
species (Passi et al., 2002).
TAG formed the dominant lipid fraction in fish muscle lipids and contained an entire
spectrum of detected fatty acids in both analysed fish species. On the contrary, the fatty acid
composition of polar lipid classes was much less complex. Our results are in agreement with
previously published results which showed that TAG are the main part of stored lipids
(Corraze & Kaushik, 1999).
Major fatty acids detected in D. vulgaris and C. conger in this study were palmitic (16:0),
palmitoleic (16:1), stearic (18:0) and oleic (18:1 n-9c) acid in all lipid classes, but their
amounts and ratios differed significantly. Palmitic acid (16:0) and oleic acid (18:1n-9c) were
the predominant saturate and monoene, respectively. PUFA values were higher in neutral
lipid fractions, especially in C. conger. However, high concentrations of stearic acid (18:0)
were found in polar lipid fractions for both fishes (D. vulgaris: 1.9–43.4 %, C. conger: 6.8–58.7
%), which are not usually found in marine vertebrates. Our results showed much higher
content of SFAs in polar lipids fractions in comparison with other marine fish from the
Adriatic and the Mediterranean Sea (Passi et al., 2002). This departs from the observation
that phospholipids are characteristically rich in long chain PUFA, with EPA and DHA often
being the major fatty acids. TAG showed more favourable fatty acid composition when
compared to polar lipid fractions for both analysed fishes, containing more UFAs.
Fatty acid contents of D. vulgaris and C. conger from the Middle Adriatic Sea show a very
heterogeneous distribution. When comparing the fatty acid composition data between these
two fish species, statistically significant differences (P < 0.05) were found in neutral lipids, in
the contents of 16:0, 18:0, 18:2n-6c, 18:3n-3, 20:3n-3, 22:6n-3 in TAG. When analysing polar
lipid fractions, statistically significant differences were found only in PC, in the amounts of
14:0, 18:1n-9c and 22:6n-3. Generally, C. conger showed a greater content of UFA, especially
EPA and DHA, which makes its fatty acid profile more favourable. This could be due to
different nutritional habits of the two fish species, but also because of a natural variation in
the accumulation of fatty acids and the differences in environmental conditions. The most
accentuated changes in total lipid and fatty acid composition of fish were previously noticed
by other researchers during the reproduction period, when the storage of lipids and other
compounds are mobilized from muscle, liver and visceral organs to gonads (Guler et al.,
2007; Perez et al., 2007).
N-3/n-6 ratios were calculated for fatty acids in analysed fish edible muscle tissue samples.
These ratios amounted between 0.34 and 3.25, also showing different values between
analysed lipid classes and between analysed fish species. All n-3/n-6 ratios for different
lipid fractions were higher than 1, except for D. vulgaris TAG. This findings accord with the
observation reported for different Mediterranean marine species of fish and shellfish (Passi
et al., 2002), confirming the great importance of fish as a significant dietary source of n-3
PUFAs.
4. Conclusion
This review summarizes data about our research of fatty acid compositions in different lipid
fractions of marine fish from the Adriatic Sea, Croatia. Due to the relatively high content of
unsaturated fatty acids, Adriatic Sea fish edible muscle tissue could be recommended for
Biomedical Engineering, Trends, Research and Technologies
404
inclusion in the Mediterranean type of diet, as low-fat food with elevated content of highly
unsaturated fatty acids. Furthermore, livers from those fish, which are even more rich in
polyunsaturated fatty acids in all lipid fractions, could be a good source of biomedically
significant components if used as a raw material for products based on fish oil fatty acids
such as dietary supplements and pharmaceuticals. Obtained results indicate that fatty acid
composition in Adriatic Sea marine fish edible muscle tissue and liver lipid fractions show
an accentuated pattern of seasonality. The fatty acid composition of marine fish lipids is
multifarious and changes are complex, depending on fish biological and physiological
conditions, diet, water temperature, fishing ground and season. Therefore, the influence of
season and other factors should be taken into consideration in order to obtain the most
appropriate fatty acid composition for industrial and pharmaceutical needs.
5. References
Ackman, R.G. (1989). Fatty Acids. In: Marine Biogenic Lipids, Fats and Oils, edited by R.G.
Ackman, ISBN: 0849348897, CRC Press, Boca Raton, USA.
Aro, T., Tahvonen, R., Mattila, T., Nurmi, J., Sivonen, T., & Kallio, H. (2000). Effects of
season and processing on oil content and fatty acids of Baltic herring (Clupea
harengus membras). Journal of Agricultural & Food Chemistry, 48(12), 6085-6093.
ISSN: 0021-8561.
Bang, H. O., Dyerberg, J., & Nielsen, A. B. (1971). Plasma lipid and lipoprotein pattern in
Greenlandic West-coast Eskimos. Lancet, 1(7710), 1143-1145. ISSN: 0140-6736.
Baticic, L., Varljen, N., Butorac, M. Z., Kapovic, M., & Varljen, J. (2009). Potential Value of
Hepatic Lipids from White Sea Bream (Diplodus sargus, L.) as a Good Source of
Biomedical Components: Seasonal Variations. Food Technology & Biotechnology 47(3
Special Issue, 47(3 Special Issue SI), 260-268. ISSN: 1330-9862.
Cejas, J. R., Almansa, E., Jerez, S., Bolanos, A., Samper, M., & Lorenzo, A. (2004). Lipid and
fatty acid composition of muscle and liver from wild and captive mature female
broodstocks of white seabream, Diplodus sargus. Comp Biochem Physiol B Biochem
Mol Biol, 138(1), 91-102. ISSN: 1096-4959.
Corraze, G., & Kaushik, S. (1999). Lipids from marine and freshwater fish [French]. Ocl-
Oleagineux Corps Gras Lipides, 6(1), 111-115. ISSN: 1258-8210.
Donato, A., Dugo, G., Mauceri, A., & Verzera, A. (1984). Changes in Fatty Acids
Composition in Diplodus vulgaris Liver in Relation to Sexual Maturation, Riv. Ital.
Sostanze Grasse 59, 349–353. ISSN: 0035-6808.
Donato, A., Salpietro, L., Verzera, A., & Trozzi, A. (1997). Hepatic fatty acid composition of
Diplodus sargus caught along the coast of Messina strait during spermatogenesis,
Riv. Ital. Sostanze Grasse, 74, 79–83. ISSN: 0035-6808
Driscoll, D. F., Ling, P. R., & Bistrian, B. R. (2009). Pharmacopeial compliance of fish oil-
containing parenteral lipid emulsion mixtures: Globule size distribution (GSD) and
fatty acid analyses. Int J Pharm, 379(1), 125-130. ISSN: 1873-3476.
Folch, J., Lees, M., & Sloane Stanley, G. H. (1957). A simple method for the isolation and
purification of total lipides from animal tissues. J Biol Chem, 226(1), 497-509. ISSN:
0021-9258.
Fish Lipids as a Source of Healthy Components: Fatty Acids from Mediterranean Fish
405
Grigorakis, K., Alexis, M. N., Taylor, K. D. A., & Hole, M. (2002). Comparison of wild and
cultured gilthead sea bream (Sparus aurata); composition, appearance and seasonal
variations. International Journal of Food Science & Technology, 37(5), 477-484. ISSN:
0950-5423.
Guler, G. O., Aktumsek, A., Citil, O. B., Arslan, A., & Torlak, E. (2007). Seasonal variations
on total fatty acid composition of fillets of zander (Sander lucioperca) in Beysehir
Lake (Turkey). Food Chemistry, 103(4), 1241-1246. ISSN: 0308-8146.
Harris, W. S. (2010). Marine Omega-3 Fatty Acids and Plaque Stabilization. Curr Atheroscler
Rep. 12(6), 357-358. ISSN: 1534-6242.
Hazel, J. R. (1979). Influence of thermal acclimation on membrane lipid composition of
rainbow trout liver. Am J Physiol, 236(1), R91-101. ISSN: 0002-9513.
Henderson, R. J., & Tocher, D. R. (1987). The lipid composition and biochemistry of
freshwater fish. Prog Lipid Res, 26(4), 281-347. ISSN: 0163-7827.
Hu, F. B., Bronner, L., Willett, W. C., Stampfer, M. J., Rexrode, K. M., Albert, C. M., Hunter,
D., & Manson, J. E. (2002). Fish and omega-3 fatty acid intake and risk of coronary
heart disease in women. Jama, 287(14), 1815-1821. ISSN: 0098-7484.
Imre, S., & Saglik, S. (1998). Fatty Acid Composition and Cholesterol Content of Some
Turkish Fish Species. Turkish Journal of Chemistry, 22(4), 321-324. ISSN: 1010-7614.
Itua, I., & Naderali, E. K. (2010). Review: omega-3 and memory function: to eat or not to eat.
Am J Alzheimers Dis Other Demen, 25(6), 479-482. ISSN: 1938-2731.
Jardas, I. (1996). Adriatic Ichthyofauna, edited by J.M. Draganović, ISBN: 953-0-61501-9,
Školska knjiga, Zagreb, Croatia. (in Croatian).
Kates, M., & Baxter, R.M. (1962). Lipid composition of mesophilic and psychrophilic yeasts
(Candida species) as influenced by environmental temperature, Can. J. Biochem.
Physiol. 40, 1213–1227. ISSN: 0576-5544.
Lloret, J. (2010). Human health benefits supplied by Mediterranean marine biodiversity. Mar
Pollut Bull. 60(10), 1640-1646. ISSN: 1879-3363.
Lovell, R. T. (1991). Nutrition of aquaculture species. J Anim Sci, 69(10), 4193-4200. ISSN:
0021-8812.
Luzia, L. A., Sampaio, G. R., Castellucci, C. M. N., & Torres, E. (2003). The influence of
season on the lipid profiles of five commercially important species of Brazilian fish.
Food Chemistry, 83(1), 93-97. ISSN: 0308-8146.
Martin, L., Zarn, D., Hansen, A. M., Wismer, W., & Mazurak, V. (2008). Food products as
vehicles for n-3 fatty acid supplementation. Can J Diet Pract Res, 69(4), 203-207.
ISSN: 1486-3847.
Massaro, M., Scoditti, E., Carluccio, M. A., & De Caterina, R. (2010). Nutraceuticals and
prevention of atherosclerosis: focus on omega-3 polyunsaturated fatty acids and
Mediterranean diet polyphenols. Cardiovasc Ther, 28(4), e13-19. ISSN: 1755-5922.
Mayzaud, P., Virtue, P., & Albessard, E. (1999). Seasonal variations in the lipid and fatty acid
composition of the euphausiid Meganyctiphanes norvegica from the Ligurian Sea.
Marine Ecology-Progress Series, 186, 199-210. ISSN: 0171-8630.
Napolitano, G. E., Ratnayake, W. M., & Ackman, R. G. (1988). Fatty acid components of
larval Ostrea edulis (L.): importance of triacylglycerols as a fatty acid reserve. Comp
Biochem Physiol B, 90(4), 875-883. ISSN: 0305-0491.
Biomedical Engineering, Trends, Research and Technologies
406
Ozyurt, G., Polat, A., & Ozkutuk, S. (2005). Seasonal changes in the fatty acids of gilthead
sea bream (Sparus aurata) and white sea bream (Diplodus sargus) captured in
Iskenderun Bay, eastern Mediterranean coast of Turkey. European Food Research &
Technology, 220(2), 120-124. ISSN: 1438-2377.
Passi, S., Cataudella, S., Di Marco, P., De Simone, F., & Rastrelli, L. (2002). Fatty acid
composition and antioxidant levels in muscle tissue of different Mediterranean
marine species of fish and shellfish. J Agric Food Chem, 50(25), 7314-7322. ISSN:
0021-8561.
Pazos, A. J., Ruiz, C., Garciamartin, O., Abad, M., & Sanchez, J. L. (1996). Seasonal Variations
of the Lipid Content and Fatty Acid Composition of Crassostrea Gigas Cultured in
El Grove, Galicia, Nw Spain. Comparative Biochemistry & Physiology -, 114(2),
Comparative Biochemistry. 114(112):171-179. ISSN: 0305-0491.
Perez, M. J., Rodriguez, C., Cejas, J. R., Martin, M. V., Jerez, S., & Lorenzo, A. (2007). Lipid
and fatty acid content in wild white seabream (Diplodus sargus) broodstock at
different stages of the reproductive cycle. Comp Biochem Physiol B Biochem Mol Biol,
146(2), 187-196. ISSN: 1096-4959.
Raatz, S. K., Redmon, J. B., Wimmergren, N., Donadio, J. V., & Bibus, D. M. (2009). Enhanced
absorption of n-3 fatty acids from emulsified compared with encapsulated fish oil. J
Am Diet Assoc, 109(6), 1076-1081. ISSN: 1878-3570.
Roberts, R. O., Cerhan, J. R., Geda, Y. E., Knopman, D. S., Cha, R. H., Christianson, T. J.,
Pankratz, V. S., Ivnik, R. J., O'Connor, H. M., & Petersen, R. C. (2010).
Polyunsaturated Fatty Acids and Reduced Odds of MCI: The Mayo Clinic Study of
Aging. J Alzheimers Dis. ISSN: 1875-8908.
Smutna, M., Kruzikova, K., Marsalek, P., Kopriva, V., & Svobodova, Z. (2009). Fish oil and
cod liver as safe and healthy food supplements. Neuro Endocrinol Lett, 30 Suppl 1,
156-162. ISSN: 0172-780X.
Tanakol, R., Yazici, Z., Sener, E., & Sencer, E. (1999). Fatty acid composition of 19 species of
fish from the Black Sea and the Marmara Sea. Lipids, 34(3), 291-297. ISSN: 0024-
4201.
Varljen, J., Baticic, L., Sincic-Modric, G., Obersnel, V., & Kapovic, M. (2004). Composition
and seasonal variation of fatty acids of Diplodus vulgaris L. from the Adriatic Sea.
Journal of the American Oil Chemists Society, 81(8), 759-763. ISSN: 0003-021X.
Varljen, J., Sulic, S., Brmalj, J., Baticic, L., Obersnel, V., & Kapovic, M. (2003). Lipid classes
and fatty acid composition of Diplodus vulgaris and Conger conger originating
from the Adriatic Sea. Food Technology & Biotechnology, 41(2), 149-156. ISSN: 1330-
9862.
17
Flax Engineering for Biomedical Application
Magdalena Czemplik
1
, Aleksandra Boba
1
, Kamil Kostyn
1
,
Anna Kulma
1
, Agnieszka Mituła
1
, Monika Sztajnert
1
,
Magdalena Wróbel- Kwiatkowska
2
, Magdalena Żuk
1
,
Jan Szopa
1
and Katarzyna Skórkowska- Telichowska
3
1
Faculty of Biotechnology, Wrocław University
2
Department of Pharmaceutical Biology and Botany,
Medical University in Wrocław
3
IVth Military Hospital in Wroclaw
4
Linum Foundation, Wroclaw
Poland
1. Introduction
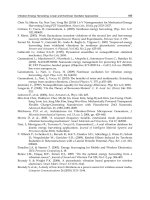
Flax (Linum usitatissimum) is an important crop plant that is widely distributed in the
Mediterranean and temperate climate zones. It has great significance for industry as a
valuable source of oil and fibres. A unique feature of flax is the possibility of whole plant
exploitation with almost no waste products. For this reason, flax has quite significant
potential for biotechnological application. To increase the valuable qualities of flax products,
the flax genome has been genetically modified, with the specific aims to improve the plant’s
pathogen resistance, taste and nutritional properties, and to produce pharmaceuticals and
other compounds. In this chapter, we describe the plant characteristics that show the
biochemical and industrial importance of flax oil and fibres and their various possible
applications and the relevant genetic modifications.
Since ancient times, flax has been known to be a source of oil and fibres, and it has been
cultivated as a dual-purpose plant for a long time. Nowadays, it is a multi-purpose plant
and its exploitation is not restricted to the production of linen fibre and oil. Actually, whole
plant exploitation is possible, which justifies the name given to it by Linnaeus: L.
usitatissimum, meaning “useful flax”. There is a wide range of possible applications of flax
(Fig.1). The long fibres are used in the textile industry, and the short fibres in paper
production, isolation materials and biocomposite production. The wooden shives released
during flax scutching can serve as an energy source. Flax seeds also have many important
applications, and due to its high nutritional value, it is used in the food, pharmaceutical and
health care industries. The seedcake, which is rich in antioxidants, is used in the
pharmaceutical and cosmetic industries.
The development of molecular biology emerged as an important tool for the genetic
modification of plants, and enabled the improvement of many different features of wild type
plants. These modifications broadened the range of practical applications for flax, making the
plant more valuable and more significant for the innovative biotechnological industry.
Biomedical Engineering, Trends, Research and Technologies
408
Fig. 1. The multipurpose application of flax
Flax is a good source of unsaturated fatty acids, dietary fibre and another nutrients. It is
composed mainly of fat (41%), protein (20%) and dietary fibre (28%). The contents may vary
depending on genetics, environment, seed processing and the analysis method. Linum
usitatissimum is the best-known species with a high concentration of α-linolenic acid (ALA).
Polyunsaturated fatty acids compose about 73% of the total fatty acid content. Flax proteins
are rich in arginine, aspartic acid and glutamic acid. Linum usitatissimum is characterized
with a high content of polysaccharidic mucilage. It confers from 6 to 8% of the dry weight.
The acidic polysaccharide consists of L-rhamnose, L-galactose and D-galacturonic acid and
the neutral polysaccharides L-arabinose, D-xylose and D-galactose. The amino acid
composition of flax indicates that the most abundant are glutamic acid, aspartic acid and
arginine. Moreover a series of cyclic polypeptides, which contains between eight and ten
amino acids, have been identified in Linum usitatissimum. Some of them exhibit
immunosuppressive activity. Phytochemicals that have been identified in flax mainly
consist of lignans, isoprenoids, phenolic acids, flavonoids and cyanogenic glucosides. All
these compounds, apart from cyanogenic glucosides are known to have antioxidant
properties or inhibitory activity against carcinogen induced tumors.
2. Flax fibre quality improvement and its biomedical application
Flax fibres have many useful applications. They are flexible, lustrous and soft. Moreover,
flax fibres are stronger than cotton but less elastic. They absorb humidity and are allergen-
Flax Engineering for Biomedical Application
409
free. These properties make flax fibres useful in the textile industry but they are also used in
the manufacture of car-door panels, plant pots and retaining mats. Recently, some research
has been carried out to improve the quality of flax fibres and make them suitable for the
biomedical industry. Innovative flax fibre-containing products have been developed with
potential applications in the medical field. The main strategy was to make use of genetically
modified flax fibres with unusual and unique properties.
2.1 Fibre quality improvement
Flax is a great source of fibre. Plant fibres are divided into three groups: the phloem stem
fibres (phloem stem fibres or xylem stem fibres) of dicotyledonous plants; the leaf fibres of
monocotyledonous plants; and the seed and fruit fibres (Ilvessalo-Pfaffli, 1995). Flax fibres
belong to the first group.
The flax stem is 70% composed of cellulose. These hollow tubes grow together as bundles
and are held by complex carbohydrates such as pectins, gums and waxes. These function as
a plant support. The fibre separation process from the non-fibre tissues is called retting
(Antonov et al., 2007). Retting is mainly the enzymatic action of polygalacturonase, which
degradates the pectin polymers of the middle lamella into soluble galacturonic acid. This
process is mainly carried out by plant pathogens like filamentous fungi. To obtain high-
quality fibres, the proper degree of retting is necessary (Zhang et al., 2000). The efficiency of
retting depends on the method used, but traditional dew retting is still the most widely
performed method. In this method, the flax stalks are left in the field after the harvesting of
the flax seeds, and the soil microorganisms digest the cell matrix polysaccharides. The dew
retting method is weather dependent, which makes it uncontrollable.
The chemical composition of the flax stems can affect the degree of retting. Fibres which
have more lignins need a longer period of retting. However, a longer exposure to fungal and
bacterial enzymes decomposes the cellulose and weakens the fibres. One solution to this
problem is to harvest the flax before seed maturity when the level of stem lignification is still
low. Another solution is to genetically manipulate the flax, yielding an improved retting
process. It is known that the pectin and hemicellulose contents of the fibres influence the
fibre processing. A new technology to modify the biosynthesis and degradation of pectins
with beneficial consequences for the flax fibre properties has been recently developed. The
flax plant was transformed with Aspergillus aculeatus genes coding for polygalacturonase
(PGI) or rhamnogalacturonase (RHA), which are the enzymes required to break down
pectin of the flax fibres. The transformants were characterized by an increased enzyme
activity and a significant reduction of pectin content. The reduction in pectin content was in
the range of 56–68% for both the PGI and RHA plants. These results correlated with the
retting efficiency, which was more than 2-fold higher in the transgenic flax than in the
control plants (Musialak et al., 2007). Interestingly, the overexpression of the enzymes did
not affect the fibre composition. No changes in the lignin or cellulose contents was observed
in comparison to the control. Similarly, the levels of soluble sugars and starch were at the
same levels as in the non-transformed flax. As the biochemical parameters of the cell wall
components remained similar to those for the control plants and the fibre quality did not
change, it is suggested that these modifications might be important for industrial and
medical application.
Another strategy of improving flax fibre quality was reducing the level of lignin synthesis.
Lignins are complex polymers of three aromatic alcohols: coniferyl, sinapyl and p-coumaryl
(Amthor, 2003), and cinnamyl alcohol dehydrogenase (CAD) is an enzyme that catalyses the
Biomedical Engineering, Trends, Research and Technologies
410
biosynthesis of lignin monomers (hydroxycinnamoylalcohols) from the corresponding
aldehydes. CAD is the specific marker of lignification (Barakat et al., 2009). Flax fibres
comprise 3-5% lignins, and they are mainly responsible for mechanical resistance. They
create a physical barrier against pathogen infection, and are highly accumulated and
deposited in response to pathogen attack (Tobias et al., 2005). The accumulation of lignins
negatively influences the retting efficiency. To overcome this problem, transgenic flax with a
silenced cad gene was created. In the generated plants, the CAD enzyme activity was 20-40%
lower, and the lignin level decreased by up to 40 % (Wróbel- Kwiatkowska et al., 2006).
Moreover, this modification influenced the composition of the cell wall. The pectin content
and the hemicellulose content was significantly lower. Decreasing the level of the above-
mentioned compounds facilitated the retting process. Furthermore, the mechanical
properties of the modified fibres were strongly improved, as the ratio of cellulose to lignin
increased. Cellulose is the fibrous component of the cell wall, and the hemicellulose, pectins
and lignins are the matrix components. An increased proportion of the fibrous to matrix
components is the reason for the improvements in the mechanical properties of the stem.
This data indicates that via genetic modification, it is possible to improve the mechanical
properties of flax fibres and make them more useful for further application.
2.2 Biodegradable flax biocomposite material as a new medical polymer
Composites are materials made of matrix reinforced with natural fibres, and the term
biocomposites is used for composites employed in bioengineering (Ramakrishna et al., 2004).
The development of biocomposites is attractive because the properties of two or more types
of material can be combined, which influences the properties of the composites. Most
medical devices used in medicine and made of a single material, such as a polymer, metal or
ceramic, are too flexible or too weak or too stiff to host tissues, and some may also be
sensitive to corrosion or cause allergic reactions (e.g. nickel and chromium). All these
disadvantages led to the development of composite materials for medical use. Nowadays,
composites are used in numerous biomedical applications: sutures, cardiovascular patches,
wound dressings, regeneration devices and tissue engineering scaffolds (Misra et al., 2006).
Many composites have poor biomechanical properties and poor bioactivities. The
composites containing biodegradable polymers can be divided into two groups: one based
on natural polymers (e.g. starch, alginate, silk) containing as reinforcement natural fibres
(lignocellulosic or cellulosic fibres); and the second based on synthetic polymers (polylactic
acid PLA, polyglicolic acid PGA, poly-ε-caprolactone PCL) (Rezwan et al., 2006). Natural
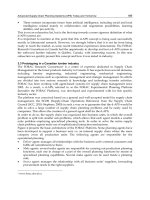
fibres replace glass, ceramics or carbon fibres (Bax and Mussig, 2008). In the last decade
biocomposites were used by the automotive industry for door panels, seat backs, headrests
and package trays among other things (Fig. 2), (Suddel et al., 2003; Bledzki et al., 2006).
Biocomposites have favourable biomechanical properties and they can also have bioactive
properties, for example antioxidative and bacteriostatic action. The main problem in
preparing biocomposites is often the poor adhesion between the matrix and the fibres used
as reinforcement. This influences the mechanical properties of the composites and remains a
significant disadvantage. Better contact between the fibres and the matrix also enhances the
hydrophobicity of the composite. The possible solution to this problem might be the
production of a biocomposite containing transgenic flax fibres enriched with hydrophobic
and thermoplastic poly-β-hydroxybutyrate (PHB). This non-toxic and water-insoluble
compound displays chemical and physical properties similar to polypropylene. PHB is a
biodegradable, ecologically friendly compound, and may be an alternative to conventional
Flax Engineering for Biomedical Application
411
Fig. 2. Applications of biocomposites in industrial products
plastics used as the matrix component of composites, particularly those reinforced with
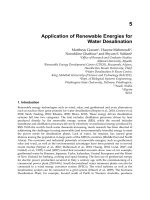
fibres of natural origin (Peijs, 2002). PHB was discovered in the bacterium Bacillus
megaterium and is found in other species of bacteria, including Alcaligenes, Azotobacter,
Bacillus, Nocardia, Pseudomonas and Rhizobium. It is synthesized in a three-step reaction
catalysed by β-ketothiolase (phbA), acetoacetyl-CoA reductase (phbB) and by PHB synthase
(phbC) (Fig. 3), (Steinbuchel and Fuchtenbusch, 1998). In bacteria, PHB serves as a source of
carbon and energy.
Isolating PHB from bacteria is expensive, so producing PHB in plants could be a promising
method. Transgenic flax plants with overexpression of the three genes encoding PHB
synthesis have been generated, and shown to be useful for biomedical applications. The
stem-specific 14-3-3 promoter was used for the transformation. Three genes coding for β-
ketothiolase, acetoacetyl-CoA reductase and PHB synthase were derived from R. eutropha.
The generated plants (named M plants) exhibited a PHB content of up to 4.62 µg/gFW
(Wróbel et al., 2004). The electron-lucent granules of PHB were detected in the stroma of the
plastids in the M plants. Moreover, the PHB synthesis affected the shape and size of the
chloroplasts: the diameter of chloroplast increased, and they were characterized by a more
oval shape. The accumulation of PHB resulted in changes in the stem’s mechanical properties.
These properties were measured using Young’s modulus. This parameter was two-fold higher
in the M plants, which indicates that transgenic fibres enriched with PHB have a higher
average resistance to tensile loads and better elastic properties. The fibre composition of the M
plants was examined using the infrared (IR) spectra method.
Biomedical Engineering, Trends, Research and Technologies
412
Acetyl- CoA
Acetoacetyl- CoA
Polyhydroxybutyrate (PHB)
H
y
drox
y
but
y
r
y
l- CoA
Condensation -
β-
ketothiolase
Reduction -
acetoacetyl-
CoA
Polimerisation -
PHB synthase
Fig. 3. Polyhydroxybutyrate (PHB) synthesis pathway
The greater structural disorder of the M fibres resulted from the formation of celluloses with
an amorphous structure and from the shortening of the cellulose chain lengths. What is
more, the M plants exhibited stronger coupling between the elementary fibres, which made
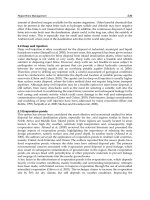
them more stable (Wróbel- Kwiatkowska et al., 2009). Introducing PHB to flax fibres yielded
the commercially utilized bast fibres. Fibres derived from those plants can be particularly
used as the reinforcement in biocomposites (Fig.4).
First of all, the PHB in those fibres improves the adhesion between the fibres and the matrix,
and secondly, such fibres remain a great source of phenolic acids, which possess
antioxidative properties that are especially important when the fibres are used for medical
purposes. Previous studies showed that composites of transgenic flax fibres enriched with
PHB and polypropylene do not promote platelet aggregations in contrast to pure
polypropylene (Szopa et al., 2009). It was also noticed that those transgenic fibres have
bacteriostatic properties (data not published).
A new generation of entirely biodegradable composites were made of polylactic acid (PLA)
and alternatively of poly-ε-caprolactone (PCL) enriched with bioplastic flax fibres.
Determining the level of platelet aggregations on the surface of the prepared composites and
the level of colonization of bacteria (E. coli) to their surfaces showed the composites’ anti-
aggregational and bacteriostatic properties. The new composites also exhibited improved
biomechanical properties in comparison to membranes made of pure PLA or PCL, and good
in vitro biocompatibility, even though the cell viability of mouse fibroblast cells treated with
Flax Engineering for Biomedical Application
413
PP+20% M fibers
PP+10% M fibers PP+5% M fibers PP
Fig. 4. Biodegradable flax composites made of polypropylene (PP) enriched with different
content of bioplastic flax fibres (M plants). The control composite is made of polypropylene
with no addition of flax fibres
these composites was slightly reduced and the amount of dead cells also slightly increased
when compared to untreated cells (Gredes et al., 2010). It was also shown that implanting
the tested biocomposites based on PLA and transgenic flax fibres into rat skeletal muscle
had no influence on the gene expression of the most analysed genes, i.e. vascular endothelial
growth factor (VEGF), insulin-like growth factor (IGF) and growth differentiation factor 8
(GDF8) (Gredes et al., 2010). The used implants composed of transgenic plastic fibres in a
PLA matrix showed better biocompatibility than pure PLA or PHB implants, and they did
not have any negative effect on muscle function and gene expression. Thus, the new
biocomposites created with bioplastic flax fibres might be considered as a new material for
tissue engineering and other branches of medicine.
2.3 The new bandage based on transgenic flax products
The number of patients with serious ulcer wounds is still increasing. This is a consequence
of chronic diseases such as diabetes, obesity and atherosclerosis. An ulcer that is considered
chronic, or non-healing, is one which takes more than eight weeks to heal despite optimal
local and general treatment. Wound healing is a complex and dynamic process, divided into
three overlapping stage: cleaning, proliferation, and wound constriction and cicatrisation.
The complex treatment of ulcers mainly consists of wound diagnostics, casual treatment
directed at the primary disease, the exclusion of other factors that inhibit healing processes,
and general and local treatment (Abbade & Lastória, 2005). There are many factors that can
influence wound healing, and using a proper wound dressing is among them. In recent
years, many different specialized wound dressings were developed, such as
hydroxycellulose, hydrocolloid, polyuretic-foam dressing, alginans, hydrogel dressing and
dressing containing silver (Jones et al., 2006; Skórkowska-Telichowska et al., 2009). The