Coherence and Ultrashort Pulse Laser Emission Part 11 pptx
Bạn đang xem bản rút gọn của tài liệu. Xem và tải ngay bản đầy đủ của tài liệu tại đây (7.92 MB, 40 trang )
10 Laser Pulses
Fig. 6. Time dependency of the energy distribution of a xenon plasma, heated with a
Nd-YAG laser pulse, with an initial electron density of n
e
0
=10
18
cm
−3
.
ln
I
L
(r, z, t)
I(r, z, t)
= −
z
0
α
ei
dz, (19)
where α
ei
is the absorption coefficient and z is the length. The main mechanism of the
absorption of probe radiation in the absence of absorption bands and lines is, as already
mentioned in 2.2, the inverse bremsstrahlung. During the quick heating-up of the electrons,
due to the laser pulse, no expansion work is achieved. The amount of heat dQ
L
is supplied to
the electrons per time unit. Standarized to the volume, with the absorption coefficient of the
electrons for inverse bremsstrahlung α
ei
, the heat source strength P
L
results:
P
L
(r, z, t)=
1
V
dQ
L
dt
= α
ei
I
L
(r, z, t). (20)
The electron temperature changes agreeable to
dT
e
dt
=
2
3n
e
k
B
α
ei
I
L
(r, z, t). (21)
For the absorption coefficient α
ei
, equation (7) is used. Because of the proportionality of the
absorption coefficient to n
2
e
, under certain circumstances, a possible rest ionisation from the
previous laser pulse may play an important role. A high repetition rate and the effect of the
magnetic field on the remaining ionisation can have a positive influence on the absorption of
the plasma in this issue.
For the thermal conduction out of the central area of the discharge the continuity equation
obtains:
392
Coherence and Ultrashort Pulse Laser Emission
Interaction of Short Laser Pulses with Gases and Ionized Gases 11
Fig. 7. Time dependency of the energy distribution of a xenon plasma, heated with a
Nd-YAG laser pulse, with an initial electron density of n
e
0
=10
19
cm
−3
.
dq
dt
+ ∇
j
w
= 0. (22)
The heat flux obtains:
j
w
= −κ∇T
e
, (23)
where κ is the thermal conductivity. The temporal change of the electron temperature due to
thermal conduction obtains:
dT
e
dt
=
2
3n
e
k
B
∇(κ∇T
e
). (24)
For the thermal conductivity, we use the expression
κ
(T)=4 ·10
4
9
−8
Z
−
1
3
Tk
B
e
0
5
2
k
B
e
0
Z
lnΛ
. (25)
Here e
0
ist the elementary charge of an electron. The term lnΛ describes the so-called
Coulomb-logarithm, which applies to
lnΛ
= ln
12π
0
e
0
3/2
n
−1/2
e
T
3/2
e
. (26)
393
Interaction of Short Laser Pulses with Gases and Ionized Gases
12 Laser Pulses
Fig. 8. (a) 3D scheme of the experimental setup. The laser pulse is focused onto the
pre-ionized gas. (b) 2D scheme of the simulation setup. The red box shows the area modeled
by the simulations.
4.1 Influence of the electron density
The coupling of laser beams and with that the heating of the plasma is strongly dependent
from the absorption coefficient for inverse bremsstrahlung, i.e. from the electron density.
The influence of the initial electron density on the reachable temperatures, respectively the
propagation of laser radiation in the plasma is quantitatively simulated with the help of
Comsol Multiphysics. Here, the laser pulse is coupled to the cross sectional area of the plasma
cylinder with the help of a focusing optic. The focus diameter amounts 50 μm here. In this
simulation, it is possible to give a constant, homogenous electron density to the plasma due
to the smaller diameter of the laser beam in comparison with the pinch diameter. As an input
parameter for the simulation, the initial electron density n
e
is used. Fig. 9 shows the temporal
and spacial temperature development in plasma at an initial electron density about 10
17
cm
−3
.
Here one can see that the value chosen for the electron density is too small. The laser beam
pervades the plasma almost unhampered (without absorption); only a small heating of the
plasma occurs (about maximal 10 eV). With an increase of the initial electron density the
absorption coefficient increases as well, so the laser beam can heat the plasma more efficiently.
The maximum heating with the laser pulse is reached at an initial electron density of n
e
=
7
·10
19
cm
−3
. Fig. 10 shows that a laser beam can propagate exactly to its focal level, to the
area of the highest intensity. Here, a local heating of the electrons up to 100 eV occurs. Another
increase of the electron density, only an untimely absorption of the laser pulse would occur.
This situation is shown in fig. 11 for an initial electron density of n
e
=7· 10
20
cm
−3
.Hereone
can see that, due to the high electron density, the laser radiation is absorbed strongly from the
dense plasma and cannot spread completely. The maximum temperature reached is generated
far before the area with the highest power density (focal area).
Fig. 12 shows a quantitative diagram of the dependency of the electron temperature reached
with different electron densities and laser pulses. It is obvious that the optimal heating can
be reached with a plasma electron density of
1
/
10
of the cut-off density of the particular laser
wave length. This behavior was already found in section 3. If there is a higher electron density
in the plasma, the laser beam cannot enter the plasma in an optimal way and thereby not heat
it efficiently (16). As a result it can be said that knowledge concerning the occurring electron
density in the plasma (development of free electrons thorough electric stimulation and the
generation of free electrons with the laser pulse) is of major importance to gain an efficient
plasma heating with a laser beam.
394
Coherence and Ultrashort Pulse Laser Emission
Interaction of Short Laser Pulses with Gases and Ionized Gases 13
Fig. 9. Time development of the temperature distribution of a laser heated plasma with an
initial electron density of n
e
=10
17
cm
−3
. The interrupted line symbolizes the focal area.
Here, a maximum electron temperature of about 10 eV is reached.
4.2 Influence of the distance of time between laser pulse and pinch-plasma
The distance of time between the generation of a pinch-plasma and the laser pulse plays a
key role for an efficient combination of the two methods. Here, the basic differences for the
result can be generated here. If on one hand the laser pulse is brought to the plasma exactly
at the time of the pinch moment, the plasma is experiencing a further heating. On the other
hand, the plasma can emit a double pulse generated in the extreme ultraviolett spectrum
(EUV) when the laser pulse is timely staggered with the pinch moment. These guesses are to
be examined with the help of simulations. For HELIOS-CR has only limited possibilities to
simulate laser and pinch-plasma combination, some simplifications and assumptions are to be
made. The basic idea is it to describe the pinch plasma as a pre-pulse with a defined energy.
This pre-pulse is used o generate the plasma. The main pulse (laser pulse), timely staggered,
is used to heat the plasma. The plasma expands isotherm during the radiation process and
adiabatic without radiation, which means that it is possible to influence the density profile and
the temperature of the plasma with a timing of the pre-pulse and the main pulse and phase
them to the highest conversion efficiency for the desired wavelength. The pinch-plasma is
described as a pre-pulse with a duration about 10 ns (time duration of the pinch) and an
energy of 600 mJ as Gau intensity profile. The main pulse follows after a variable temporal
shift with a pulse duration of 9 ns and an energy of 750 mJ. Figure 13 shows the temporal
development of electron density temperature and density for three different, timely staggered
laser pulses. In the figures 13a and 13d, the laser pulse follows the pinch moment with about
100 ns. Here, the plasma is not heated to a point above the temperature generated by the
pinch-plasma (maximal 19 eV) because the plasma did already cool down after about 20-30 ns.
However the laser pulse causes another plasma heating up to 16 eV. This way, two sequenced
395
Interaction of Short Laser Pulses with Gases and Ionized Gases
14 Laser Pulses
Fig. 10. Time development of the temperature distribution of a laser heated plasma with an
initial electron density of n
e
=7 ·10
19
cm
−3
. The interrupted line symbolizes the focal area.
Here, a maximum electron temperature of about 100 eV is reached.
radiation pulses in the extreme ultraviolet spectral range can be generated. In the figures 13c
and 13f, the laser pulse is coupled to the plasma simultaneous to the pinch moment. This
generates a further plasma heating. The maximum temperature that can be reached is about
38 eV for this special case. These results do point out the importance of the time difference Δt
between the pinch moment and the laser pulse coupling. On the one hand, a further plasma
heating is possible, and on the other hand, two two sequenced radiation pulses in the extreme
ultraviolet spectral range can be generated.
5. Experimental investigation
For all experimental investigation methods, an active mode locked Nd:YAG laser with two
additional amplifier stages is used. It generates pulses with a half-width about 9 ns at maximal
0.8 J pulse energy. The laser runs at a maximum repetition frequency of 10 Hz, or it operates
with single pulses. For the experiments, the pinch plasma has a voltage about 7 kV. The
total capacity is about 46 nF at a total inductivity of 9.2 nH. The total energy of the hollow
cathode triggered Z-pinch adds up to 1.1 J. Fig 14 shows a scheme of the experimental setup
for a synchronization of the laser pulse and the hollow cathode triggered Z-pinch discharge.
Due to the unsteady ignitions of the Z-pinch discharges, some measures for a synchronization
of the laser pulse with the hollow cathode triggered Z-pinch discharges are necessary. The
additional laser pulse heating of the plasma needs a fast reproducible laser triggering with
a close relation to the pinch moment. To hit the plasma in a compacted state (durability
about 10 ns) with the laser, a sufficiently strong and jitter free trigger signal is necessary
about 100 ns before the main discharge occurs. For the avalanche breakdown of the hollow
cathode triggered Z-pinch has a huge jitter of 50 μs, the laser pulse timing cannot be carried
396
Coherence and Ultrashort Pulse Laser Emission
Interaction of Short Laser Pulses with Gases and Ionized Gases 15
Fig. 11. Time development of the temperature distribution of a laser heated plasma with an
initial electron density of n
e
=10
20
cm
−3
. The interrupted line symbolizes the focal area. Here,
a maximum electron temperature of about 30 eV is reached.
out with the 4-Channel Delay-Generator. The trigger event has to emerge from discharge
course to be hit. The trigger signal cannot be generated by the control elements of the hollow
cathode triggered Z-pinch because of the unavoidable delay caused by the 4-Channel Delay
Generator, some meters of coaxial cable and the laser electronics itself. Through, one of the
hollow cathode discharge characteristics modeled (13) and experimentally approved (14) is
the fact that it emits an intense electron beam shortly before the avalanche breakdown occurs.
Because of that, a Faraday cup is used in the experiment to collect the discharges. It is added
close to the anode bore. The electric potential of the Faraday cup becomes negative because of
the appearance of the intense electron beam. When a high-impedance resistor (ordinarily 10
9
-10
11
Ω) is used, a measurable voltage increases. This voltage gives a sufficient signal about
100-200 ns
1
before the main discharge occurs, with a jitter about maximal 5 ns.
5.1 Laser-induced re-heating of pre-ionized gases
Figure 15 shows the experimentally determined xenon spectra with and without laser pulse
heating. The laser pulse is coupled to the plasma about 90 ns after the avalanche breakdown.
The spectra show that the spectrum intensity duplicates, but no new lines are generated with
the laser pulse heating. The reason for this is that the pinch-plasma did already cool down
because of the expansion. It seems that the laser pulse can only effect another plasma heating.
According to this, two hot plasmas with a time delay (Δt
≈ 90 ns) and almost similar electron
temperature and radiation power emerge. Due to the exposure time of the CCD camera
(t=20 ms), two radiation events are integrated to the extreme ultraviolet spectral range; with
that a higher intensity can be reached. This behavior of the timely delayed laser plasma
1
dependent from the gas used: N
2
,O
2
,Xe,Ar,CO
2
397
Interaction of Short Laser Pulses with Gases and Ionized Gases
16 Laser Pulses
Fig. 12. Development of the electron temperature in plasma, dependent from the electron
density during the plasma heating with the Nd-YAG laser pulse. The red circles show the
values simulated in Fig. 9 - 11.
coupling was already simulated in section 4.2. The timely delayed EUV radiation pulses
can be used as starting points for new application fields, such as, for example, the ”pump
and probe methods”. Figure 15 shows the experimentally determined extreme ultraviolet
spectra of a xenon z-pinch plasma combined with a short laser pulse. The time difference
between the z-pinch plasma (in pinched state) and the incident laser pulse is about 100 ns. As
a consquence the laser does not hit the plasma at peak compression but rather the residuals of
the discharge. As shown the intensity over the whole spectral range increases at about a factor
of two compared to the sole z-pinch plasma, whereas the sole laser without a discharge has no
effect (green line). The spectra are taken from a single shot each. A comparison of the spectral
line intensities of each spectra, as shown in (16), leads to an estimated electron temperature of
T
e
≈ 70 eV in both cases.
5.2 Laser-induced additional heating of pre-ionized gases
Figure 16 shows an experimentally determined spectrum order. Here, the pinch-plasma is
run at a repetition rate of 1 Hz and one spectrum is taken, respectively. After 20 pulses, a laser
pulse is additionally coupled to the plasma (20 pulses). The timely delay between avalanche
breakdown and laser pulse here indeed only amounts to about 10-20 ns. The figure shows that
the additional plasma heating occurs as desired. Furthermore one can see that not every laser
pulse causes an additional plasma heating because of timely instabilities of the laser pulses.
The newly generated spectral lines do mostly derive from helium-like nitrogen-ions. The
strongest lines in the 1s3d and 1s4d change-over at 17.3865 nm and 13.0286 nm. A comparison
398
Coherence and Ultrashort Pulse Laser Emission
Interaction of Short Laser Pulses with Gases and Ionized Gases 17
of the intensity ratio of the lines from different ionization stage with simulated spectra gives
an electron temperature about 57 eV in the plasma. When this temperature is reached, the
intensity of the emitting line in the water window at 2.786 nm is about 50 times higher than
the strongest line at 16.255 nm. This shows that it was possible to generate an efficient emitter
in the area of the water window.
6. References
[1] Rolf, F. (2005). Entwicklung eines Rastermikroskopes f ¨ur den Einsatz an Laborquellen
im EUV Spektralbereich, Phd Thesis, Bayerische Julius-Maximilians-Universit¨at W ¨urzburg,
2005
[2] Janulewicz, K. A. (2004). Review of state-of-the-art and output characteristics of
table-top soft x-ray lasers, X-Ray Spectrom., Vol. 33, No. 4, 2004, 262-266
[3] Br ¨uckner, S. and Wieneke, S. and Vi¨ol, W. (2008). Theoretical and experimental
investigations of the suitability of low-current z-pinch plasma as an absorption medium
for laser radiation, Contrib. Plasma Phys., Vol. 48, No. 8, 2008, 577-585
[4] Rymell, L. and Hertz, H. M. (1993). Droplet target for low-debris laser-plasma soft X-ray
generation, Opt. Commun., Vol. 103, No. 105, 1993, 110
[5] Richardson, M. and Torres, D. and Depriest, C. and Jin, F. and Shimkaveg, G. (1998).
Mass-limited, debris-free laser-plasma EUV source, Opt. Commun., Vol. 145, No 109,
1998, 112
[6] Attwood, D. T. (2000), Soft X-rays and Extreme Ultraviolet Radiation - Principles and
Applications, Cambridge University Press
[7] Vogt, U. (2002). R¨ontgenemission aus laserinduzierten Plasmen: Einfluss von
Laserintensit¨at und Pulsdauer bei verschiedenen Targetsystemen, Phd Thesis, Fakult¨at
Mathematik u nd Naturwissenschaften der Technischen Universit¨at Berlin, 2002
[8] Chan, C. H. (1973). Significant loss mechanismus in gas breakdown at 10.6 μm, J. Appl.
Phys., Vol. 44, No. 3, 1973, 1179-1188
[9] Vi¨ol, W. (1988). Hochleistungs-CO
2
-Laserpulse hoher Repetitionsfrequenz zur
Erzeugung optischer Entladungen, Phd Thesis, Mathematisch-Naturwissenschaftliche
Fakult¨at der Universit¨at D¨usseldorf, 1988
[10] Burger, M. (2003). Spektroskopische Untersuchung und Modellierung
eines lasererzeugten Heliumplasmas im starken Magnetfeld, Phd Thesis,
Matematisch-Naturwissenschaftliche Fakult¨at der Heinrich-Heine-Universit¨at D¨usseldorf,
2003
[11] Bergqvist, T. and Kleman, B. (1966). Breakdown in gases by 1.06 μm laser radiation, Ark.
Fys., Vol. 31, No. 2, 1966, 177-189
[12] R. K. Avery (1984). Interpretation of picosecond laser-induced breakdown in argon and
xenon, J. Phys. D: Appl. Phys., Vol. 17, 1984, 1657-1663
[13] Boeuf, J.P. and Pitchford, L.C. (1991). Pseudospark discharges via computer simulation,
IEEE Trans. Plasma Sci., Vol. 19, No. 2, 1991, 286-296
[14] Benker, W. and Christiansen, J. and Frank, K. and Gundel, H. and Hartmann, W. and
Redel, T. and Stetter, M. (1989). Generation of intense pulsed electron beams by the
pseudospark discharge. IEEE Trans. Plasma Sci., Vol. 17, No. 5, 1989, 754-757
[15] Raizer, Y. P. (1997). Breakdown of Gases in Fields of Various Frequency Ranges, In: Gas
Discharge Physics, Springer-Verlag, Berlin
[16] Wieneke, S. and Br ¨uckner, S. and Vi¨ol, W. (2008). Simulating the heating of z-pinch
plasmas with short laser pulses, Journal of Plasma Physics, Vol. 74, No. 3, 2008, 361-369
399
Interaction of Short Laser Pulses with Gases and Ionized Gases
18 Laser Pulses
Fig. 13. Simulated time dependence of a laser heated xenon pinch plasma for different delay
times of the laser pulse for the electron temperature (a-c) and electron density (d-f).
400
Coherence and Ultrashort Pulse Laser Emission
Interaction of Short Laser Pulses with Gases and Ionized Gases 19
Z-pinch
varied-line-spacing
spectrograph
EUV-
CCD-camera
trigger box
power supply
personal
computer
digital
oscilloscope
Nd:YAG laser
(flashlamps)
delay generator
Q-switch
TTL 5V
15V
faraday cup
C
0
focal lens
Fig. 14. Experimental setup for a synchronization of the Z-pinch discharge and the laser pulse
Fig. 15. Experimentally determained EUV spectra of a xenon z-pinch plasma (black) and a
combined laser pulse reheated z-pinch plasma (red). In comparison the sole laser pulse does
not create any EUV radiation, because the charge carrier density is to low for the breakdown
of the discharge (green).
401
Interaction of Short Laser Pulses with Gases and Ionized Gases
20 Laser Pulses
Fig. 16. Experimentally determined emission spectra of a nitrogen plasma with and without
laser pulse heating. The spectra are continuously gathered at a repetition rate about 1 Hz (20
pulses are taken with and without laser pulse, respectively). The charging voltage is about
7kVatagaspressureabout6Pa.
402
Coherence and Ultrashort Pulse Laser Emission
18
Characterisation and Manipulation of
Proton Beams Accelerated by Ultra-Short and
High-Contrast Laser Pulses
Sargis Ter-Avetisyan
1
, Mathias Schnürer
2
and Peter V Nickles
2,3
1
School of Mathematics and Physics, The Queen’s University of Belfast,
2
Nonlinear optics and short pulse spectroscopy, Max Born Institute, Berlin,
3
Gwangju Institute of Science and Technology, WCU Department,
1
UK
2
Germany
3
Rep. of Korea
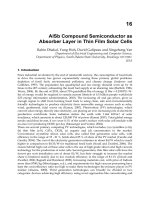
1. Introduction
Laser-driven acceleration of particle beams is a burgeoning field of research, based on the
possibility of creating ultra-large electric fields in plasma, largely exceeding current limits of
conventional acceleration technology. Research in this area has led to very significant
progression regarding the acceleration of electrons and ions. Laser-driven ion sources have
unique properties: high brightness (about 10
13
protons/ions per shot), high current (in kilo-
Ampere range), ultra-low emittance, and short pulse duration (less than 1 ps), opening
prospects for a broad range of applications. Recent advances in the laser technology have
led to even further enhancements in the provision of extremely short and high-intensity
pulses, which can further improve the accelerated ion beam specifications particularly
regarding maximum ion energy and ion flux which are demanding most of the potential
applications. These developments have stimulated an emergence of advanced diagnostics
for measuring complex plasma effects.
The absorption mechanisms of laser radiation at the target are the basic processes, which
indeed defines the whole ion acceleration scenario. For laser intensities, where the classical
normalized momentum of electrons quivering in the laser electric field: a = 8.53×10
−10
(μm)
I
1/2
(W/cm
2
) > 1, the electrons become relativistic and the effect of the laser magnetic field is
no longer negligible. The perpendicular component of the Lorentz force ev×B couples with
the electric force to drive the electrons in the laser propagation direction (Wilks et al., 1992,
Lefebvre & Bonnaud, 1997, Kruer & Estabrook, 1985) in contrast to inverse bremsstrahlung
and resonance absorption, which causes the quiver motion of the electrons in the laser field.
The ponderomotive force drives the electrons with a step- or plateau-like density profile and
has a strong directionality along the laser propagation direction. Electron temperatures
about 1 MeV have been measured (Malka & Miquel, 1996). The laser energy transfer to the
hot electrons can also be out carried by fast plasma waves through the nonlinear
ponderomotive force (Tajima & Dawson, 1979) and by laser field itself (Pukhov et al., 1999).
Coherence and Ultrashort Pulse Laser Emission
404
Whereas the ions from the target front will be accelerated normal to the target front surface
in the ambipolar expansion of the plasma, the hot electron component created directly by
the laser pulse in the plasma plume will propagate through the target. It has typically a
divergence between 5°-50°, density of the order of the critical density (10
20
– 10
21
cm
−3
) and a
temperature of the order of the laser ponderomotive potential.
The free motion of this hot electron beam through the target requires a return current that
locally compensates the flow of the hot electrons (Passoni et al., 2004). It will be provided by
the target material (for metallic target – conduction electrons, insulators - the background
free electron population created by field and thermal ionization). Since the density of the
background electron population in both cases is of the order of the solid density, much
bigger than the fast electron density, the required velocity for current neutralization is small
and their temperature is much lower than that of the hot electrons (Tikhonchuk, 2002).
Finally the physical parameters and dynamics of these two electron populations will define
the electrostatic sheath field which is created at the vacuum – solid interface and accelerates
ions to high energies.
The ions are created and accelerated either at the target rear surface (Snavely et al., 2000,
Mackinnon et al., 2001, Hegelich et al., 2002) through the self-consistent electrostatic
accelerating field generated by fast electrons escaping in vacuum (so-called target normal
sheath acceleration—TNSA mechanism) or at the target front surface, illuminated by the
laser (Clark et al., 2000a, Maksimchuk et al., 2000, Clark et al., 2000b). Particle-in-cell (PIC)
simulations suggest a variety of mechanisms that may be responsible for acceleration at the
front surface: formation of multiple collisionless electrostatic shocks (Denavit, 1992, Silva et
al., 2004, Wei et al., 2004); a solitary wave produced by shock-wave decay in a plasma slab
(Zhidkov et al., 2002); or a mechanism wherein the ponderomotive pressure of the short
laser pulse displaces the background electrons, and the ions are accelerated by the
electrostatic field of the propagating double layer (Shorokhov & Pukhov, 2004). However,
all these mechanisms are relying on ion acceleration in the electrostatic field created due to
charge displacement driven by the laser field.
These scenarios are not mutually exclusive. Their relative contributions depend strongly
upon the particular target and laser parameters and can contribute to the generation of
electrons and, in turn, to ion acceleration mechanisms. Particle-in-cell (PIC) simulations by
Wilks et al., (2001), and Pukhov, (2001), and observations by Zepf et al., (2003), and Karsch
et al., (2003), show that ions can be produced at the target front and the rear sides
simultaneously, even if the generation processes are quite different. Here the laser pulse
contrast has a profound effect on accelerated ions and their cut-off energy (Mackinnon et al.,
2002, Kaluza et al., 2004, Lindau et al., 2005).
The acceleration is most effective on light ions (specifically protons), which are usually
present on target surfaces in the form of contaminants like hydrocarbons and water, or can
be present among the constituents of the solid target (e.g. as in plastic targets). The heaviest
ion population of the target provides a positive charge, which offers much more inertia and
makes the charge separation responsible for the huge accelerating field. Part of this heavy
population can also be effectively accelerated, on a longer time scale, if the protons are not
enough to acquire most of the energy contained in the electric field, or if protons are
removed before the arrival of the laser pulse.
The complex, non-linear nature of laser-driven plasma dynamics and ion acceleration
phenomena requires the development of an innovative diagnostic complex allowing
Characterisation and Manipulation of Proton Beams Accelerated
by Ultra-Short and High-Contrast Laser Pulses
405
simultaneous measurements of different plasma parameters (using visible- and XUV-light,
X-rays, Gamma-rays, ion and electrons) with high temporal, spectral and spatial resolution
together with laser pulse parameters. This requirement is especially important because of
both: shot-to-shot fluctuations of laser pulse parameters and inherent shot-to-shot variations
in the local target parameters, which can derogate the whole plasma dynamics.
In laser-matter interaction studies one of the important research tasks is to investigate the
energy distributions of emerging charged particles, in which the different laser energy
absorption mechanisms are hidden and the energy redistribution among the plasma
components become apparent. As a basic diagnostic the Thomson spectrometer has been
widely and successfully used for analyzing the energy spectra of laser accelerated charged
particles. In Fig.1 a typical experimental setup of laser plasma interaction experiments with
Thomson parabola spectrometers and, as an example, spectral traces recorded with absolute
calibrated micro-channel-plate (MCP) detector (Ter-Avetisyan, et al., 2005) are shown.
Fig. 1. a) A typical experimental setup of laser plasma interaction experiments with
Thomson parabola spectrometers and, as an example, b) measured accelerated ion spectra
from heavy water droplet irradiated at 35 fs, ∼1 J, ∼10
19
W/cm
2
intensity is shown.
Several modifications of the basic spectrometer design allow a comprehensive and precise
analysis of ion acceleration. In particular, (i) the simultaneous measurement of ion and
electron spectra in the same direction allow to understand the measured particularities in
the ion spectra resulting from the evolution of a two-electron component (hot and cold)
plasma (Ter-Avetisyan et al., 2004a). (ii) The complexity of the temporal (Ter-Avetisyan, et
al., 2005) and spatial characteristics (Schreiber et al., 2006) of laser driven ion source could be
demonstrated by precise measurement of the proton/ion trajectories, and its applicability
for proton deflectometry (Ter-Avetisyan et al., 2008, Sokollik et al., 2008), and (iii) proton
source tomography revealed detailed properties of the laser driven ion source (Ter-
Avetisyan et al., 2009a). Latest is crucial in view of planning proton beam steering systems.
The comprehensive set of on-line diagnostics, which are complementary each other and can
be used simultaneously, is a very powerful tool for laser plasma interaction studies. In each
experiment only various diagnostics would allow unambiguous demonstration of ion
acceleration processes in their whole complexity, providing a set of data also for theoretical
interpretation.
Coherence and Ultrashort Pulse Laser Emission
406
2. Specific features of accelerated ion and electron dynamic
2.1 Dips in ion emission spectrum and electron dynamics
Several physical mechanisms have been considered for the appearance of high-energy
electrons, and have been proposed as a way to understand the generation of ions with
kinetic energies of several tens of MeV during the short laser-pulse interaction with dense
plasmas, (Malka & Miquel, 1996, Clark et al., 2000b, Forslund & Brackbill, 1982, Fews et al.,
1994, Beg et al., 1997, Gitomer et al., 1986). A theory has been developed (Wickens et al.,
1978, Wickens &.Allen, 1979) for the free expansion of the laser plasma with hot (T
h
) and
cold (T
c
) electron temperature components, as a way to treat these non-equilibrium effects
and to describe the ion energy distribution. It was shown that the energy fraction carried by
fast ions depends on the temperature and concentration of the electrons in the plasma. This
leads to an ion-emission velocity spectrum whose most notable feature is a pronounced dip
in the distribution (Kishimoto et al., 1983). The slopes of the upper (-(M/ZkT
c
)
1/2
) and lower
(-(M/ZkT
h
)
1/2
) asymptotes in the ion velocity spectrum makes possible a determination of the
effective absolute hot- and cold-electron temperatures (Wickens &.Allen, 1981). (Here, M is
ion mass, Z is charge state, kT is cold- or hot-electron energy).
The dip in the velocity distribution corresponds to an internal electrostatic sheath appearing
due to hot- and cold-electron isothermal expansion, where ions are strongly accelerated in a
small region. This dip develops in a region of self–similar flow where the ions experience
rapid acceleration due to an abrupt increase in the electric field. This increase occurs at the
location in the expanding plasma where most of the cold electrons are reflected,
corresponding to a step in the ion charge density (Wickens &.Allen, 1981). The depth of the
dip as a function of the peak field is a sensitive function of the hot-to-cold electron
temperature ratio T
h
/T
c
in the ion spectra, while the position in the spectrum depends on the
hot-to-cold electron density ratio n
h
/n
c
.
In a very short pulse (35 fs) and high intensity laser plasma several groups of electrons with
different temperatures can be generated (Zhidkov et al., 2001), which could then cause
multiple dips in the ion energy spectra. No hint of this has been observed so far, and
therefore detailed measurements of the ion and electron spectra are required to find
correlations between these processes.
Here we report on precise measurements of the spectral density distribution of the ion
emission from plasmas created by 35 fs laser pulses at intensities of (0.8 - 1.2)×10
19
W/cm
2
. A
pulse from a multi-TW Ti: Sapphire laser (Kalachnikov et al., 2002) with a maximum energy
of 750 mJ, was focused with an f/2.5 off-axis parabolic mirror onto water droplets of ~ 20
µm diameter (Hemberg et al., 2000). Measurements were made of ion spatial and energy
distributions, X-ray spectral properties, the electron spectrum emitted, and the correlation of
maximum electron energies with the cut-off energies of proton and deuteron spectra.
The ion energies have been measured with a Thomson parabola spectrometer, into which
the ions enter through a 200 µm aperture. The ions are detected by a 40 mm MCP coupled to
a phosphor screen. The signal from the phosphor screen is imaged with a charge-coupled
device (CCD– camera). An
241
Am
α
-particle source (energy 5.4 MeV) with known emittance
is used to calibrate the setup (Ter-Avetisyan, et al., 2005). This sensitive, calibrated detection
technique allows the measurement of an ion spectrum from a single laser shot in absolute
terms.
A typical camera picture taken with a single laser shot, showing ion traces from a heavy
water droplet, is depicted in Fig.2 and the deduced deuteron spectra is shown in the inset.
Characterisation and Manipulation of Proton Beams Accelerated
by Ultra-Short and High-Contrast Laser Pulses
407
Fig. 2. Color image from the MCP-phosphorous screen of an emitted ion spectra (deuterons
and oxygen ions, right blob – “zero” point: radiation impact along spectrometer axis) from a
heavy water droplet taken from a single laser shot in backward (135
0
to laser propagation)
direction with the Thomson spectrometer. In inset the deuteron spectrum is plotted.
The most interesting features in the picture are the clearly visible dips along the deuteron
trace. As mentioned before, the same feature has been observed for proton emission from
water droplets, and has been observed in backward (135° to the laser axis) as well as in
forward (laser propagation direction) emission. The occurrence of the spectral dips was
reproducible in the experiment, although the exact position, depth, and fine structure varied
from shot to shot due to small variations in the laser parameters and beam alignment in our
setup. This is, to our knowledge, the first observation of these dips in ultra-short (sub 50 fs)
high intensity laser-plasma interaction experiments.
The generated hot electron spectrum was measured with a GAFchromic film (HD-810) in a
direction transverse to the laser axis using a 0.27 T magnet spectrometer. The film is
sensitive to electrons above 10 keV due to its layer characteristic (Busch, et al., 2003). The
measured time-integrated hot electron spectrum (Fig.3a) shows a maximum at an energy of
about 0.7 MeV with a tail expanding to 2 or 3 MeV.
From the measured electron spectra, one can deduce a hot electron component with a
temperature of (0.63 ± 0.03) MeV. This fits well with the energy the electrons can acquire
from the ponderomotive force F
p
of the laser pulse (Kruer & Estabrook, 1985):
/
pp
FdUdz=− ,
14 2 2
( ) 9.33 10 ( / ) ( )
p
UeV IW cm m
λ
μ
−
=× , where
p
U is the ponderomotive
energy. This gives a potential energy of 0.6 MeV for our laser intensity, proving a rather
efficient laser energy transfer to the electrons. Because up to 20% of the laser energy can be
absorbed in energetic electrons (Wilks et al., 1992), a significant number of electrons with
energies of several hundreds of keV is produced. The electron impact ionization cross
section at the energies 400-500 keV is about 10
-19
cm
-2
( />bin/Ionization/table.pl?ionization=H2O), therefore these highly energetic electrons can
cross the target without being significantly slowed. A space-charge field accumulated in the
droplet captures the hot electrons with energies below about 200 keV (low energy cut off in
Fig.3a). The potential due to these electrons and the estimated electron density is sufficient
to create electrostatic acceleration fields of the order of 1 MV/μm (Busch, et al., 2003) which,
in turn, can accelerate ions to MeV energies. Electrostatic or magnetic fields around the
Coherence and Ultrashort Pulse Laser Emission
408
target will influence the directionality of ion emission. However, for our spherical target, we
expect a relatively isotropic ion emission distribution, which can be shown by
measurements (Busch, et al., 2003, Karsch et al., 2003).
A strong correlation between the maximum ejected electron energies and the deuteron
cutoff energies could be directly established (Fig.3b) with the help of a re-designed Thomson
spectrometer allowing to measure in one laser shot the emitted ion and electron spectrum in
a same direction. For that the second MCP detector was added to that side of the
spectrometer where the electrons are deflected. In Fig.3b, a variation in the maximum
energies of the ejected electrons by only a factor of 1.2 changes the deuteron cutoff energy by
a factor of about 5. This extreme sensitivity emphasizes the predominant role of the energy
transfer to the electrons for the ion acceleration.
0123
0.1
1
10
T=630 keV
electron signal (arb.units)
energy (MeV)
1.4 1.5 1.6 1.7
0.2
0.4
0.6
0.8
cutoff deuteron energy (MeV)
maximum electron energy (MeV)
(a) (b)
20 40 60 80 100 120 140
10
1
10
2
10
3
33 keV
20 keV
7 keV
counts (arb.units)
energy (keV)
(c)
Fig. 3. Electrons, ions and x-rays emitted of heavy water micro droplet. a) Hot electron
energy distribution (superposition of ∼50 000 shots). Slope fits to an exponential decay with
a temperature T= 630 keV parameter. b) Correlated maximum energies of emitted electrons
and deuterons in same laser shot. c) X-ray emission spectra from heavy water droplet.
The space charge field built up by the trapped hot electrons in the target is responsible for
ion acceleration properties (Fig.3a), therefore, these electrons have been studied further in
details. According to a simple bremsstrahlung model (Griem, 1964), hard X-ray emission
Characterisation and Manipulation of Proton Beams Accelerated
by Ultra-Short and High-Contrast Laser Pulses
409
from the plasma is defined by the electron density distribution inside the target. For highly
energetic electrons crossing the droplet, the target is “thin”, so their bremsstrahlung is
weaker and the spectral intensity is constant (Blochin, 1957).
A calibrated X-ray CCD-camera operating in a single-photon detection mode was used for
energy-dispersive X-ray measurement (Ter-Avetisyan, et al., 2003). In the experiments, the
CCD-camera was mounted at an angle of 90° to the laser propagation direction and at a
distance of 100 cm from the plasma source. A 200 nm Zr filter and a beam aperture was used
to block the optical light and the scattered X-rays. The resolution of our spectral diagnostics
is about 0.5 keV. A typical X-ray spectrum is shown in Fig.3c. The slope of the distribution
shows the existence of multi-temperature components, and can be fitted assuming three
different effective temperatures of about (7±0.3) keV, (20±4) keV, and (33±12) keV.
0.2 0.4 0.6 0.8 1.0 1.2 1.4
1
10
100
1000
protons @ 5 keV in 256 nsr
energy (MeV)
0.0 0.1 0.2 0.3 0.4 0.5
1
10
100
1000
deuteron @ 5 keV in 256 nsr
energy (MeV)
(a) (b)
Fig. 4. Single shot proton a) and deuteron b) spectrum with typical dips along the trace:
squares – experiment, line – simulation (parameter cf. text)
Recently, a fluid model based on a single electron temperature approximation was applied
successfully for high intensity laser-driven ion acceleration (Mora, 2003). Accurate results
could be obtained for the structure of the ion front, the ion energy spectrum, and the cutoff
ion energy. In the present letter, on the other hand we explain the dips in the emitted ion
spectrum (Fig.2) by relying on the fact that we have an electron spectrum characterized by
several electron temperatures. This is the precondition for an application of the fluid model
(Wickens et al., 1978, Wickens &.Allen, 1979, Kishimoto et al., 1983). Figures 4a and 4b
compare experimental proton and deuteron energy distributions with calculations based on
the theory of Wilkens et al. (1978). A reasonable fit for the depth and position of the dip in
the proton spectrum (Fig.4a) is obtained when the hot-to-cold electron temperature ratio T
h
/T
c
is assumed to be about 9.8, and the hot-to-cold electron density ratio n
h
/n
c
is about
1/100. Individual electron temperatures T
c
= 7.5 keV and T
h
= 74 keV compare quite well to
the range of temperatures derived from the X-ray emission. Here, T
h
is lower by a factor of
about 2, but this can be due to the restricted linearity range (< 50 keV) in the X-ray
measurement. Also, if one takes into account that bulk ion energy scales with the hot
electron temperature as E
ion
= 4.5 T
h
(Wickens &.Allen, 1979), a mean ion energy E
ion
=330
keV would be derived, in remarkably good agreement with the ion temperature inferred
from the ion slope (Fig.4a). This is somewhat different from the original model where the
ion energy is predicted to be similar to the hot cf. cold electron energies. A sharp proton
Coherence and Ultrashort Pulse Laser Emission
410
cutoff energy occurs at about 1.3 MeV. Notice that the analytical velocity distribution
derived in (Wilkens et al. 1978) breaks down if the temperature ratio T
h
/T
c
exceeds 9.9. In
order to overcome this problem, a more complex electron velocity distribution was included
in (Kishimoto et al., 1983) [33].
For a heavy water droplet, presented in Fig.4b where the cutoff energy occurs at about 0.55
MeV, the model with a hot-to-cold electron temperature ratio T
h
/T
c
=7.7 and an electron
density ratio n
h
/n
c
=1/25 fits the measurement quite well. The individual temperatures are
T
c
=11 keV and T
h
= 85 keV. The model shows how small changes in T
e
and n
e
have large
effects on spectral slopes.
From the structure of the emitted ion spectrum such important parameters as hot- and cold-
electron temperatures and their density ratio can be determined. Due to the short laser pulse
the hot electron population shows a multi-temperature behaviour. This, in turn, can cause
multi-dips in the ion spectrum. It is worth noting that the results demonstrated here could
open a way to tailor the ion spectra (Nishihara at al., 2001) from short pulse laser-driven
plasmas by choosing proper electron distributions appropriate to particular applications.
2.2 Laser pulse contrast and electron dynamic
Two different laser energy absorption mechanisms at the front side of a laser-irradiated foil
have been found to occur, such that two distinct relativistic electron beams with different
properties are produced. One beam arises from the ponderomotively driven electrons
propagating in the laser propagation direction, and the other is the result of electrons driven
by resonance absorption normal to the target surface. These properties become evident at
the rear surface of the target, where they give rise to two spatially separated sources of ions
with distinguishable characteristics when ultra-short (40 fs) high-intensity laser pulses
irradiate a foil at 45° incidence. The two, clearly distinguishable branches of electron
trajectories have been measured by Čerenkov diagnostics. This correlates with proton
emission from two separated sources, which have been resolved with a high-spatial-
resolution Thomson spectrometer (Schreiber et al., 2006). The crucial parameters of the
experiment are the laser pulse intensity and the contrast ratio.
In the experiments, a 40 fs pulse from a multi-TW Ti: Sapphire laser was focused onto a thin
(6 µm) aluminum foil target at 45° with an intensity of about 2x10
19
W/cm
2
. The temporal
contrast of the laser pulse was characterized by a scanning third-order cross correlator with
a dynamic range of 10
10
, having a resolution of 150 fs and a scanning range of ± 200 ps. The
pulse shape several ns before the main pulse was controlled by a fast photodiode with
temporal resolution of about 300 ps. In typical operating conditions, the amplified
spontaneous emission (ASE) pedestal of the laser pulse, several picoseconds before the pulse
peak, was at a level of (0.8 - 5)×10
-7
relative to the peak intensity. This is termed “low”
contrast. The ASE pedestal could be reduced by driving the Ti: Sapphire laser amplifiers in
specific delayed pump modes. This led to a reduction of pulse energy by up to 550 mJ, but it
permitted an improvement of the ASE level down to (1 – 3)×10
-8
, which is referred to as
“high” contrast. In both cases, no pre-pulses were observed.
The Čerenkov method, applied as an electron diagnostic, uses the partial conversion of the
electron bunch energy into a flux of photons in a medium where the electron velocity is
higher than the light velocity (Stein et al., 2004). A 50 µm tesa foil (polypropylene with
chemical composition (- C
3
H
6
-)
n
, index of refraction - 1.49) used as a Čerenkov radiator was
attached with very thin Acrylat glue to the target rear, and imaged with an objective (f = 8
cm) and a magnification of about 15 to a gated charge-coupled device (CCD) camera. It is
Characterisation and Manipulation of Proton Beams Accelerated
by Ultra-Short and High-Contrast Laser Pulses
411
assumed that a 50 µm path length in this low Z substance has a negligible effect on the
energy and main direction of the electrons. Propagating through the foil, the electron beam
undergoes filamentation (Manclossi et al., 2006), but nonetheless with unaltered beam
directions emerging from the target. To block any light from the laser pulse and its
harmonics, a 6 mm Schott BG18 filter and a 3 mm VG8 filter were inserted into the beam
path. These filters yield a spectral window centered at 510 nm with a half width of 70 nm. A
weak and uniformly distributed background signal from transition radiation is omitted as a
result. For the medium and the geometry used, the detected Čerenkov light is associated
with electrons in the 180 – 240 keV energy interval.
Measurements of the ion energies were carried out with a Thomson spectrometer (Ter-
Avetisyan et al., 2005). In order to achieve high spatial resolution, we set up a Thomson
spectrometer in a 1:12 imaging mode (Schreiber et al., 2006), providing spatial resolution of
about 20 µm. This estimation takes into account the laminarity of the proton beam, and is
measured from the spreading of a spectral trace which is a consequence of the divergence of
the proton beamlet intercepted by a screen with a 30 µm pinhole.
The Čerenkov medium behind the target made it impossible to use both diagnostics
simultaneously for the single laser shot. Therefore, correlations between the data sets are
statistically relevant. Due to a 10 Hz repetition rate of the Ti:Sapphire laser, and using on-
line detection systems for both diagnostics, the statistical uncertainties could be minimized.
Figure 5 shows spatially resolved CCD pictures of Čerenkov radiation behind the 6 µm Al
target at 45
o
laser incidence (a - c), and it shows the evolution of the Čerenkov signal as a
function of target thickness (d). The arrows inserted in the pictures show the target
irradiation and Čerenkov emission geometry. In the pictures, one of the two components of
the hot electron current produced is identified as a consequence of hot electrons driven
along the target normal due to resonance absorption, and the other component along the
laser propagation axis is due to the ponderomotive force. Whereas in Fig.5a both electron
components make a comparable contribution to the resulting Čerenkov emission, resonantly
and ponderomotively driven electrons are dominant in Figs.5b and 5c, respectively. The
appearances of the emission patterns are statistical, and correlated with the statistics of the
laser pulse contrast shot-to-shot fluctuation data.
Fig. 5. CCD pictures of Čerenkov radiation (arrows show emission direction) at 45
o
laser
incidence resulting from electrons propagating: (a) in the laser direction and normal to the
target; or (b) perpendicular to the laser direction only; and (c) in the laser direction only. (d)
Čerenkov light distributions as a function of Al-target thickness.
Coherence and Ultrashort Pulse Laser Emission
412
The evolution of the Čerenkov signal as a result of target thickness is shown in Fig.5d. With
a 3 μm target the two components are merged together, while at 6 μm they are clearly
separated and at the target thickness is 15 μm, further broadening of the electron beams
propagating inside the target occurs, and blurs the Čerenkov emission. In the experiments
reported in Ref. (Stein et al., 2004), these two groups of separately moving hot electrons at
the target rear side also were observed. Here we investigate the dynamics of the hot electron
populations, and the consequences for the ion acceleration processes at “low” and “high”
laser pulse contrasts.
Fig. 6. A CCD picture of a proton spectrum at 45
o
laser incidence on a 6 µm Al target,
measured in the direction of the target normal. The inset shows proton spectra from a 3 µm
target thickness at similar irradiation conditions.
The resonantly and ponderomotively driven electron populations at the target rear side create
two spatially separated electrostatic fields, from where the ions/protons can be accelerated.
Therefore, one can expect ion emission from two spatially separated sources if the laser pulse
contrast is between 10
-8
–10
-7
, where both laser energy absorption mechanisms are equivalent.
Indeed, the CCD picture of the proton spectrum in Fig.6, measured in the direction of the
target normal, shows two parallel proton parabolas, thus confirming the existence of the two
sources of proton emission. The lower trace results from the source created by electrons from
resonance absorption, and the upper one from the source created by ponderomotively driven
electrons. The appearance of the second source (or second proton trace) is in good agreement
with the detection of two electron populations by Čerenkov diagnostics (Fig.5a). This feature is
never observed at normal laser incidence on the target. Figure 6 also shows that the parabolas
are not perfect. This coincides with the previous findings (Schreiber et al., 2006) that the source
position could be variable. Note that the two parallel traces in Fig.6 change in a similar
manner, while the proton spectrum of a 3 µm thick target (inset of Fig.6) shows an
independent character, which indicates a complex source dynamics.
In order to see the differences in the electron acceleration processes and the implications for
the following ion acceleration, we performed two-dimensional (2D) particle-in-cell (PIC)
simulations of laser irradiation onto targets with different scales of pre-plasmas. The targets
are 2 µm thick and have densities of 40 n
c
. The pre-plasma is assumed to have an exponentially
decreasing profile with two scale lengths. For the overdense region where the density is higher
than 4 n
c
, the scale length is 0.1 µm. For the lower density region resulting from an expanding
ma
g
netic deflectio
n
ener
gy
, MeV
1
0.2 0.5 1234
electric deflection
200
Characterisation and Manipulation of Proton Beams Accelerated
by Ultra-Short and High-Contrast Laser Pulses
413
corona plasma, the scale lengths are 0.3 µm for the small pre-plasma case and 3.5 µm for the
large pre-plasma case. The initial electron temperature is 1 keV, and ions are kept immobile.
The targets are irradiated by p-polarized laser pulses from the left boundary with wavelengths
of 1µm. The laser pulses ramp up in five laser cycles, and sustain a peak intensity of 2×10
19
W/cm
2
that is uniform in the y-direction. The pulse duration is 40 fs. The boundary conditions
are absorbing in the x-direction, and periodic in the y-direction.
-5
-5
0
0
5
5
130
20
32
80
50
200
electron momentum p
x
(mc)
Electron momentum p
y
(mc)
-5
-5
0
0
5
5
50
1000
550
300
170
91
electron momentum p
y
(mc)
electron momentum p
x
(mc)
a)
b)
Fig. 7. Electron momentum distribution observed in PIC simulation at the target rear surface
for a) “small” L = 0.3 µm scale length pre-plasma case, and for b) L = 3.5 µm “large” scale
length pre-plasma case. Laser pulses irradiate the target from the left boundary.
The differences resulting from the dominant acceleration processes are seen from the
angular distribution of accelerated electrons. In Fig.7, the angular electron momentum
distributions observed in the PIC simulation at the target rear surface are shown for the a)
“small” L=0.3 µm scale-length pre-plasma case, and for the b) L=3.5 µm “large” scale-length
pre-plasma case. In the small pre-plasma case, ponderomotive acceleration and vacuum
heating play dominant roles in energy absorption by electrons. Due to vacuum heating,
laser energy is absorbed by low energy bulk electrons that are mainly accelerated in the
target-normal direction. High energy electrons generated by ponderomotive acceleration
propagate in the laser irradiation direction, and are reflected back toward the target at the
specular angle, as can be seen clearly in the figure. For the large pre-plasma case, high
energy electrons are mainly accelerated by resonance absorption in the target normal
direction and are reflected back also in the normal direction.
These high energy electrons induce a strong magnetic field around the critical surface. In the
small pre-plasma case, a magnetic field with uniform intensity is induced along the critical
surface. This surface magnetic field prevents low energy electrons from propagating into the
target, and makes them flow along the surface (Nakamura et al., 2004). In the large pre-
plasma case, a magnetic field is formed via Weibel instability (Weibel, 1959), which is in the
target-normal direction. The surface field tends to make electrons flow along the surface,
which leads to a uniform structure of the interaction surface. The target-normal magnetic
field acts to collimate electron jets and return currents that are periodic along the surface. As
a result, the critical density surface is rather smooth in the small pre-plasma case and
modulated in the large pre-plasma case.
Coherence and Ultrashort Pulse Laser Emission
414
9.1
1.7
0.3
0.055
0.010
20
20
40
9.1
1.7
0.3
0.055
0.010
20
0 20
40
60
X-coordinate
Y (μm)
)b( )a(
0
50.0
50.0
Fig. 8. Ion density distribution for a) large (L = 3.5 µm) and b) small (L = 0.3 µm) pre-plasma
cases. Laser irradiation is from the left boundary, where the spot size is 15 μm, and the spot
centre corresponds to y = 8.5 µm at the left boundary. Two arrows in b) indicate the trace of
the laser spot centre and the target-normal projection of the spot centre.
These different electron acceleration processes lead to differences in the lateral distributions
of the rear side sheath field and proton acceleration as follows. The target size is 2 µm in
thickness and 50 µm in width. The targets consist of 50% protons and 50% C
4+
. Laser
conditions are the same as above except that the laser pulses have a spot size of 15 µm with
a super-Gaussian distribution. The boundary conditions are absorbing in the x- and y-
directions. Ion density profiles at 150 fs after the pulse has ended are shown in Fig.8.
For the large pre-plasma case, the ion distribution is symmetric with respect to the laser axis
passing through the laser focal point at the critical surface. Since a large part of the hot
electrons propagate in the target-normal direction, the sheath field structure is similar to the
normal incidence case. For the small pre-plasma case, however, the proton distribution is
non-uniform and asymmetric. As is seen in previous simulations, very energetic electrons
are accelerated in the laser propagation direction, and lower energy electrons are generated
in the target-normal direction via vacuum heating. These two components result in two
acceleration fronts of protons, which are clearly seen in Fig.8b and detected in the
experiment. The distance between the two acceleration points depends on target thickness
and size of pre-plasma. In PIC simulation, the target is thinner and the density is lower than
in the experiments. Thus the separation distance is considered to be larger than is visible in
PIC simulation. Also, in Fig.8 we show the angular distributions for pre-plasma scales of 0.3
and 3.5 µm in order to see clear differences, but similar results are seen at much smaller
differences also. The important thing is that the dominant acceleration process changes
when the scale length becomes smaller than the wavelength.
A PIC simulation of the experimental parameters shows that the dominant electron
acceleration process depends on the profile of the pre-plasma. For plasmas where the scale
length of the pre-plasma is larger than the laser wavelength, a plasma wave is resonantly
excited at the critical density surface, which results in the generation of fast electrons
propagating in the target-normal direction (Estabrook & Kruer, 1978). If the pre-plasma
scale length is smaller than the laser wavelength, a well-collimated electron beam is
accelerated by ponderomotive forces in the propagation direction of the laser (Wilks et al.,
1992, Kruer & Estabrook, 1985). Correspondingly, protons are accelerated in a target-normal
Characterisation and Manipulation of Proton Beams Accelerated
by Ultra-Short and High-Contrast Laser Pulses
415
direction from two spatially separated sources. The laser intensity and the contrast
determine the laser absorption process and thus they control the entire acceleration scenario.
PIC simulations confirm these findings.
2.3 Energy resolved spatial characteristics of laser accelerated protons
As we have seen, interactions of relativistic-intensity laser pulses with targets with and
without pre-plasmas are significantly different from the perspective of the dominant
electron acceleration processes and the energy coupling to plasmas.
To clarify the proton acceleration process that is uniquely observed for small pre-pulses,
oblique irradiation, and in thin targets we incorporate particle diagnostics which provide a
microscopic measurement of the proton acceleration with PIC simulations. We found that
the laser-accelerated proton source drifts on the rear surface of the target in the direction of
projection of the laser wave vector onto the surface. The drift of the proton source is
explained by the lateral movement of the sheath field. This moving proton source leads to
the observation of a limited range of proton energies at any given point along the target
surface.
The proton source was investigated with an experimental setup and geometry similar to
those in section 1.2. The ion emission spectrum was measured with an absolutely calibrated
Thomson parabola spectrometer (Ter-Avetisyan et al., 2005) set up in magnifying imaging
mode (Schreiber et al., 2006). The spectrum is imaged through a 30 μm pinhole, located at a
distance of 5 cm from the source, on a detector screen 75 cm behind the pinhole, at 45° laser
incidence on a 13 μm aluminum target; see Fig.9.
d)
Z/A
S
U
(2-6) keV
Laser
B ~ 0.27 T
X
Y
50 mm
350 mm 400 mm
N
target
pinholes
30 μm
150 μm
45
0.2 0.5 1 2 3 4
0.2 0.5 1 2 3 4
a)
0.2 0.5 1
2
3
b)
0.2 0.5 1 2 3 4
energy, MeV
c)
Fig. 9. a), b), c) CCD picture of the proton spectrum at 45
0
laser incidence on a target
measured in the direction of target normal with a magnified imaging ratio of 1:15. The ideal
parabola trace is the solid line in the figure a) inset. b) Proton spectrum from a Mylar target.
c) Proton spectrum from Al target when proton beam passes through two pinholes. d)
Schematic figure of the geometry of two pinhole measurement.