báo cáo hóa học:" Changes in androgens and insulin sensitivity indexes throughout pregnancy in women with polycystic ovary syndrome (PCOS): relationships with adverse outcomes" pot
Bạn đang xem bản rút gọn của tài liệu. Xem và tải ngay bản đầy đủ của tài liệu tại đây (511.05 KB, 8 trang )
RESEARC H Open Access
Changes in androgens and insulin sensitivity
indexes throughout pregnancy in women with
polycystic ovary syndrome (PCOS): relationships
with adverse outcomes
Angela Falbo
1
, Morena Rocca
1
, Tiziana Russo
1
, Antonietta D’Ettore
2
, Achille Tolino
2
, Fulvio Zullo
1
, Francesco Orio
3
,
Stefano Palomba
1*
Abstract
Background: Given the high rate of pregnancy and perinatal complications recently observed in patients with
polycystic ovary syndrome (PCOS) and the lack of data on the serum variations in androgens and insulin sensitivity
indexes in pregnant women with PCOS, the current stud y was aimed to assess thes e changes and their potential
effect on pregnancy outcomes in a population of women with PCOS.
Methods: Forty-five pregnant patients with ovulatory PCOS (PCOS group) and other 42 healthy pregnant women
(control group) were studied assaying serum androgen levels and insulin sensitivity indexes throughout pregnancy
serially, and recording obstetrical outcomes.
Results: Serum androgen levels and insulin resistance indexes were significantly (p < 0.05) higher in PCOS than in
control group at study entry, these differences were sustained throughout pregnancy, and their changes resulted
significantly (p < 0.05) different between PCOS and control group. In PCOS patients, women who had a
complicated pregnancy showed serum androgen levels and insulin sensitivity indexes significantly (p < 0.05) wor se
in comparison to subjects without any pregnancy and/or neonatal complications.
Conclusions: PCOS patients have impaired changes in serum androgen levels and insulin sensitivity indexes during
pregnancy. These alterations could be implicated in the pregnancy and neonatal compl ications frequently
observed in women affected by PCOS.
Background
Polycystic ovary syndrome (PCOS) is a heterogeneous
disorder characterized by biochemical alteration, i.e.
hyperandrogenism and insulin resistance, and ovarian
impairment, resulting in chronic a novulation. The
chronic anovulation is not the only factors influencing
the reduced reproductive chances in PCOS patients. In
fact, an increased incidence of complications throughout
pregnancy was also observed in PCOS women a fter
meta-analytic analysis [1].
Recently, we confirmed in a well selected population
of PCOS patients an inc reased relative risk (RR) for
complicated pregnancy [1.7, 95% confidence interva l
(CI) 1.12-2.96] with a total incidence of adverse out-
comes of 31.4% [2]. In addition, the risk for adverse out-
comes in PCOS resulted significantly related to ovarian
dysfunction and biochemical hyperandrogenism [3].
Moreover, o ur previous study evaluated only baseline
androgen levels in PCOS population and no relationship
with insulin sensitivity indexes was investigated [3]. In
addition, to the moment, no report was aimed to evalu-
ate the dynamic of the hormonal and metabolic patterns
in pregnant women with PCOS.
The current study is a parallel analysis of a larger pre-
viously published clinical report [2] aimed to study
* Correspondence:
1
Department of Obstetrics & Gynecology, University “Magna Graecia” of
Catanzaro, Catanzaro, Italy
Full list of author information is available at the end of the article
Falbo et al. Journal of Ovarian Research 2010, 3:23
/>© 2010 Falbo et al; licensee BioMed Cen tral Ltd. This is an Open Access article d istributed under the terms of the Creative Commons
Attribution License ( which permits unrestricted use, distribution, an d reproduction in
any medium, provided the original work is properly cited.
changes in androgens and insulin sensitivity indexes
throughout pregnancy in PCOS patients, and their effect
on pregnancy outcomes.
Methods
The study was a pproved by the Institutional Review
Board (IRB) of the Department of Obstetrics and Gyne-
cology of the University “Magna Graecia” of Catanzaro.
The protocol was carefully explained to each subject
before entering the study and their written consent was
obtained.
Between February 2003 and April 2008, subjects with
ovulatory PCOS (PCOS group) and age- and body
mass index (BMI)-matched healthy primigravidas were
initially enrolled in a wider study protocol [2]. Ovula-
tory PCOS was diagnosed before pregnancy and con-
firmed at study entry according to the presence of
polycystic ovaries (PCO) and clinical/biochemical
hyperandrogenism without chronic oligo-anovulation
[4], while the healthy state of the controls was deter-
mined by their medical history, physical and pelvic
examination, complete blood chemistry, and transvagi-
nal ultrasonography [2].
Age > 35 years, obesity ( BMI > 30 Kg/m2), multiple
pregnancies, gestational age higher than 7 weeks as
assessed by crown-rump length (CRL) measurement,
pre-malignancies or malignancies, medical conditions or
other concurrent medical illnesses, cigarettes’ smoking,
drug/alcoho l use, organic pelvic disease, uteri ne malfor-
mations, previous pelvic surgery, no compliance to our
study-protocol, and current or previous (within the last
six months) use of any hormonal and/or anti-diabetic
and/or fertility drugs were considered as exclusion cri-
teria for both cases and controls.
Each subject received folic acid (0.4 mg daily) and was
instructed to follow usual diet and physical activity
throughout the study.
Serial clinical, biochemical and ultrasonographic
assessments for mother and/or fetal wellbeing monitor -
ing were per formed during the study according to o ur
schedule [2,3].
Clinical evaluation consisted in obstetric examination,
Papanicolau smear test (at study entry alone), Ferriman-
Gallwey score [5] calculation, anthropometric measure-
ments [including height, weight, BMI and waist-to-hip
ratio (WHR)], heart rate ( HR) and blood pressure (BP)
assessments. In order to evaluate the subjects’ physical
activity, job, daily activities, and family history of com-
plicated pregnancies specific questionnaires were com-
pleted by each woman.
Each subject underwent serial drawn blood samples to
evaluate serum androgen levels and insulin sensitivity.
All blood samples were obtained in the morning
between 08.00 h and 09.00 h after an overnight fasting
and resting in bed at study entry (within the 7
th
week of
gestation), and at the 12
th
,the20
th
and the 32
nd
weeks
of gestation. Particularly, total serum t estosterone (T),
androstenedione (A), dehydroepiandrosterone sulfate
(DHEAS), and sex-hormone binding globulin (SHBG)
were assayed. Glucose and insulin concentrations were
assayed at fasting and, only at baseline, after oral glucose
tolerance test (OGT T). The area under curve (AUC) for
glucose and insulin, as well as the homeostasis model of
assessment (HOMA) [fasting glucose (mmol/L) × fasting
insulin (μU/mL)⁄22.5] [6], the fasting glucose-to-insulin
ratio (GIR) (mg/10- 4U) [7], and the free androgen index
(FAI) [T (nmol/l)/SHBG × 100]) [8] were calculated in
each subject.
All pla sma hormone concentrations were measure d by
specific radioimmunoassay (RIA), whereas SHBG levels
using an immunoradiometric assay (IRMA) [9]. Overall,
intra- and inter-assay coefficie nts of variation (CV) were
less than 10%.
Pregnancy/perinatal outcomes were evaluated in each
subject as already detailed [2].
Statistical analysis
The Kolmogorov -Smirnov statistic with a Lilliefors sig-
nificance lev el was used for testing normalit y. Since our
data resulted normally distributed, results were
expressed as mean ± standard deviation (SD). Continu-
ous variables were analyzed with the one-way analysis of
variance (ANOVA) and ANOVA for repeated measures
with Bonferroni test for the post hoc analysis.
For categorical variables, the Pearson chi-square test
was performed; Fisher’sexacttestwasusedforthefre-
quency tables when more than 20% of the expected
values were lower than five.
Variations (Δ) in serum T, A, DHEAS, SHBG, and
fasting insulin levels, and in HOMA, GIR and FAI were
calculated at each follow-up in both groups for the over-
all population, these data were also adjusted for age and
BMI and analyzed in sub-populations distinguished on
the basis of the presence/absence of adverse pregnancy
and neonatal outcomes.
Data were analyzed using the per-protocol analysis.
The level of statistical significance was set at p <0.05
for all statistical analyses. The Statistics Package for
Social Sciences (SPSS 14.0.1, 18 Nov 2005; SPSS Inc.,
Chicago, IL) was used for all calculations.
Results
Forty-five and 42 subjects from the PCOS and control
group, respectively, were included in the final analysis.
In fact, part of the original study population (20 subjects
for the PCOS group and 22 subjects for the control
group) did not give their consent to par ticipate to the
current study protocol, while in 8 and 9 subjects from
Falbo et al. Journal of Ovarian Research 2010, 3:23
/>Page 2 of 8
the PCOS and control groups, respectively, data of each
follow-up visit were not available for the analysis.
The main clinical data from PCOS and control group
atstudyentryareshowninTable1.TheWHRand
the Ferriman-Gallwey score, such as the AUC
glucose
,
AUC
insulin
,andAUC
glucose
/AUC
insulin
were significantly
(p < 0.05) higher in the PCOS than in the control
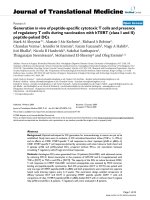
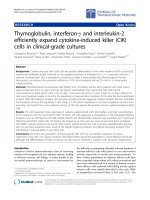
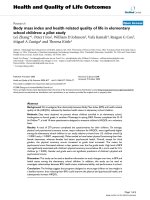
group (Table 1). Similarly, serum levels of T, A, and
DHEAS were significantly (p < 0.05) higher in the
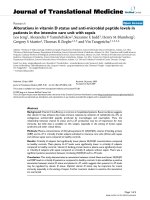
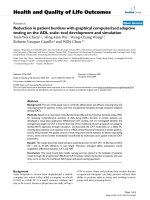
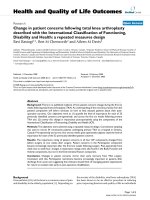
PCOS than in the control group (Figure 1). FAI and
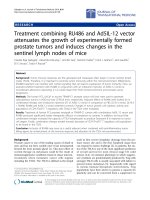
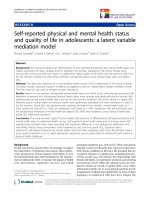
SHBG (Figure 2), such as fasting insulin concentra-
tions, HOMA, and GIR (Figure 3) also differed signifi-
cantly (p < 0.05) between groups.
At each follow-up assessment, serum T, A and DHEA S
levels were significantly (p < 0.05) higher in PCOS than
in control group ( Figure 1). Significant (p <0.05)
increases at the 20
th
and 32
nd
weeks of gestation were
observed in T and DHEAS levels, in the PCOS group
alone, whereas they resulted unchanged in the control
group. In both PCOS and control groups, A levels
resulted unchanged throughout pregnancy (Figure 1).
SHBG levels and FAI were signific antly (p <0.05)
lower and higher, respectively, in PCOS than in contr ol
group (Figure 2). In bot h PCOS and control groups,
SHBG levels were significantly (p <0.05)increasedat
each follow-up visit, while FAI resulted significant ly (p <
0.05) reduced from 20
th
weeks of gestation (Figure 2).
Fasting insulin levels, GIR and HOMA were signifi-
cantly (p < 0.05) different between PCOS and control
groups at each follow-up assessment. In PCOS group,
fasting insulin levels and HOMA were significantly (p <
0.05) increased at the 20
th
and 32
nd
weeks of gestation,
whereas GIR significantly (p < 0.05) reduced at the same
follow-ups. Conversely, no significant change during
pregnancy was observed in any insulin sensitivity index
in the control group.
Table 2 shows the variations in T, A, DHEAS, SHBG
and fasting insulin levels, and in HOMA, GIR and FAI
in PCOS and control groups. Significant differences (p <
0.05) were observed in the variations i n T, DHEAS,
SHBG and fasting insulin levels, and HOMA, GIR and
FAI between PCOS and control groups at each follow-
up assessment. No further significant difference was
observed between two groups.
A total of 13 out of 45 (28.9%) from the PCOS group
and4outof42(9.5%)fromthecontrolgroup(p =
0.044) had adverse pregnancy and/or neonatal out-
comes. In particular, pre-eclampsia occurred in 6 and 1
subjects from PCOS and control group, respectively;
whereas a pregnancy-induced hypertension was diag-
nosed in 7 and 3 subjects from PCOS and control
group, respectively. Significant differences between
groups were observed in fetal birth weight (3121.4 ±
762.1 vs. 3459.8 ± 673.2 g for PCOS and control groups,
respectively; p = 0.008), while gestational age at delivery
was not significantly different between groups (37.5 ±
2.7 vs. 38.9 ± 2.2 wks for PCOS and control groups,
respectively; p = 0.641).
InTable2areshownthevariationsinT,A,DHEAS,
SHBG and fasting glucose and insulin leve ls, and in
HOMA, GIR and FAI in the sub-populations distin-
gui shed on the basis of the pres ence/absence of ad vers e
pregnancy/perinatal outcomes and adjusted for age and
BMI. A significant (p < 0.05) difference in serum T,
DHEAS, SHBG, and fasting insulin levels, and in
HOMA, GIR and FAI was observed between patients
who had and who had not adve rse pregnancy/perinatal
outcomes only in PCOS group, whereas any difference
was observed in healthy controls (Table 2).
Discussion
Based on previous results [1,2], PCOS should be consid-
ered a heterogeneous disorder related to a higher risk
for complicated pregnancy. In particular, the risk for
any adverse pregnancy/neon atal outcome seemed to be
affected by specific PCOS features, i .e. ovarian dysfunc-
tion and biochemical hyperandrogenism, whereas no
significant effect was detected for clinical hyperandro-
genism and ovarian morphology [3]. However, the
dynamic of both androgens and insul in sensitivit y
indexes during pregnancy and their relati onship with
complications were not investigated [3].
Considering the study protocol, elevated androgen
levels were o bserved in PCOS patients just during the
Table 1 Main clinical data in cases (PCOS group) and controls (control group) at baseline
PCOS group (n. 45) Control group (n. 42) P
Age (yr) 27.9 ± 3.6 28.2 ± 4.2 0.759
BMI (Kg/m
2
) 24.5 ± 2.7 24.8 ± 3.0 0.607
WHR 0.8 ± 0.1 0.7 ± 0.1 0.035
Ferriman-Gallwey score 10.1 ± 2.5 5.1 ± 3.6 < 0.001
OGTT
AUC
glucose
(mg/dL/120 min) 1012.1 ± 51.6 1061.7 ± 99.4 0.005
AUC
insulin
(μU/mL/120 min) 8698.0 ± 2715.9 3898.5 ± 1895.5 < 0.001
AUC
glucose
/AUC
insulin
ratio 0.13 ± 0.01 0.25 ± 0.14 < 0.001
Falbo et al. Journal of Ovarian Research 2010, 3:23
/>Page 3 of 8
Figure 1 Serum androg en levels recorded at di fferent times throughout pregna ncy in PCOS and control groups.*p <0.05vs. control
group; °p < 0.05 vs. baseline and 12
th
gestational week.
Figure 2 SHBG and FAI recorded at different times throughout pregnancy in PCOS and control groups.*p < 0.05 vs. control group; ^p <
0.05 vs. previous follow-up; °p < 0.05 vs. baseline and 12
th
gestational week.
Falbo et al. Journal of Ovarian Research 2010, 3:23
/>Page 4 of 8
pre-pregnancy stage. O n the o ther hand, any pre-
pregnancy data regarding insulin resistanc e was not
available in our sample, even if it is likely to hypothesize
that insulin levels were higher in PCOS subjects than in
healthy controls also before pregnancy. Nevertheless,
both insulin resistance and hyperandrogenism are clini-
cal features of PCOS before and during pregnancy, and
could be implicated in the development of pregnancy
complications. The right timing for these processes are
not still clarified and should be further investigated.
In the current study, the potential androgens and
insulin sensitivity changes throughout pregnancy were
studied in PCOS as well as in healthy women. To this
regard, we performed a parallel analysis of a larger pre-
viously published clinical study [2], reporting data on
hyperandrogenemia and insulin resistance available in
the first (i.e. at study entry and at 12
th
weeks of preg-
nancy), the second (i.e. 20
th
weeks of pregnancy), and
the third (i.e. 32
nd
weeks of pregna ncy) trimester of
pregnancy.
As expected considering the original population and
other reports [10-14], PCOS patients were more hyper-
androgenic and insulin resistant than healthy controls at
study entry. These differences were maintaine d later
throughout pregnancy.
Interesting data rose from the study of the dynamic of
the androgens and insulin-resistance indexes. In agree-
ment with our results, Sir-Peterman et al. [14] pre-
viously showed that PCOS women had s ignificantly
higher concentrations of serum androgen levels than
non-PCOS women. Moreover, similar profi le of andro-
gen concentrations and other sexual steroids during
pregnancy in PCOS and hea lthy women was described
by the same authors [14] suggesting the ovarian origin
of the androgens, although a placental source cannot be
totally discarded. On the contrar y, in the current study,
significant i ncreases in serum T and DHEAS levels were
detected only in women affected by PCOS during the
second trimester of pregnancy , and such trend was sus-
tained in the late pregnancy.
Figure 3 Insuli n sensitivity indexes at different times throughout pregnancy in PCOS and control groups.*p < 0.05 vs. control group;
°p < 0.05 vs. baseline and 12
th
gestational week.
Falbo et al. Journal of Ovarian Research 2010, 3:23
/>Page 5 of 8
The consequences for these findings are not still
clear. However, co ntroversia l data [15-18] are a vail able
in literature regarding the pathogenetic implications of
hyperandrogenemia during pregnancy on the complica-
tions development. In particular, a significant associa-
tion between circulating maternal T levels and reduced
birth weight was previously shown [12,19]. To this
regard, meta-analytic data reported a lower birth
weight in the most common hyperandrogenic condi-
tion, such as PCOS women. In the current study, a sig-
nificant difference in birth weight was also reported
between PCOS and healthy women. Several potential
mechanisms could be involved, i.e. maternal energy
homeostasis changes, reduction of nutrient transport
through placenta, and direct effect of hyperandrogen-
ism on the fetal growth.
Several authors [15,16] reported high androgen levels
in women with pre-eclampsia. In fact, androgens could
mediate hemodynamic changes underlying pre-eclampsia
development by inducin g a state of sympathetic hyperac-
tivity and vascular hyperactivity [20]. To this regard, in
the current, such as in previous studies [1,2], a higher
rate of pre-eclampsia and pregnancy-induced hyperten-
sion has been reported in PCOS women.
Notwithstanding the increase in androgen levels
observed in the current study, a reduced bioavailability
of androgens was found in pregnant PCOS such as in
healthy women. In fact, due to the liver induction of
Table 2 Variations in serum androgen levels and in insulin sensitivity indexes in the general and sub-populations
distinguished on the basis of the presence/absence of adverse obstetric outcomes
Group PCOS group Control group
Total
population
Adverse
outcome
No adverse
outcome
Total
population
Adverse
outcome
No adverse
outcome
T (ng/mL)
Δ(0-12) 0.11 ± 0.02* 0.15 ± 0.01° 0.05 ± 0.02 0.03 ± 0.001 0.04 ± 0.003 0.03 ± 0.002
Δ(0-20) 0.22 ± 0.01* 0.29 ± 0.02° 0.16 ± 0.01 0.02 ± 0.002 0.03 ± 0.002 0.02 ± 0.004
Δ(0-32) 0.31 ± 0.02* 0.36 ± 0.01° 0.24 ± 0.01 0.02 ± 0.001 0.03 ± 0.002 0.02 ± 0.004
A (ng/mL)
Δ(0-12) 0.16 ± 0.01 0.17 ± 0.01 0.17 ± 0.02 0.13 ± 0.01 0.16 ± 0.01 0.12 ± 0.04
Δ(0-20) 0.44 ± 0.02 0.43 ± 0.02 0.45 ± 0.02 0.22 ± 0.01 0.20 ± 0.04 0.23 ± 0.03
Δ(0-32) 0.74 ± 0.01 0.74 ± 0.01 0.74 ± 0.02 0.25 ± 0.01 0.25 ± 0.03 0.24 ± 0.01
DHEAS (ng/mL)
Δ(0-12) 32.25 ± 2.51* 35.69 ± 2.1° 28.97 ± 2.8 10.51 ± 2.16 11.01 ± 2.31 9.43 ± 2.77
Δ(0-20) 175.11 ± 4.92* 184.63 ± 5.2° 166.87 ± 4.5 9.70 ± 1.97 11.26 ± 2.05 9.04 ± 2.52
Δ(0-32) 185.28 ± 6.42* 193.33 ± 6.13° 172.54 ± 6.98 11.34 ± 2.43 12.12 ± 3.06 9.90 ± 2.28
SHBG (nmol/L)
Δ(0-12) 10.71 ± 3.15* 7.48 ± 3.51° 14.13 ± 4.24 26.76 ± 8.34 25.43 ± 8.96 27.61 ± 7.56
Δ(0-20) 90.36 ± 9.44* 73.55 ± 8.34° 116.45 ± 9.08 141.37 ± 9.21 139.12 ± 12.02 153.11 ± 8.42
Δ(0-32) 93.69 ± 8.81* 72.79 ± 7.53° 119.81 ± 8.90 275.18 ± 12.88 268.07 ± 11.32 282.16 ± 13.02
FAI (%)
Δ(0-12) -1.13 ± 0.73* -0.69 ± 0.34° -1.54 ± 0.77 -2.53 ± 0.47 -2.47 ± 0.29 -2.59 ± 0.42
Δ(0-20) -0.92 ± 0.51* -0.12 ± 0.09° -1.88 ± 0.54 -3.13 ± 0.62 -2.99 ± 0.89 -3.23 ± 0.55
Δ(0-32) -1.01 ± 0.90* -0.35 ± 0.06° -1.73 ± 0.49 -3.35 ± 0.51 -3.19 ± 1.01 -3.42 ± 0.47
Fasting insulin (μU/
mL)
Δ(0-12) 1.93 ± 0.36* 2.10 ± 0.21° 1.24 ± 0.43° 1.02 ± 0.52 1.26 ± 0.73 0.98 ± 0.36
Δ(0-20) 2.64 ± 1.13* 2.98 ± 1.05° 2.12 ± 1.02° 1.41 ± 0.24 1.58 ± 0.89 1.14 ± 0.41
Δ(0-32) 2.71 ± 1.55* 3.12 ± 1.23° 2.31 ± 1.51° 1.85 ± 0.73 2.22 ± 0.93 1.44 ± 0.67
GIR (mg/10
-4
U)
Δ(0-12) 0.34 ± 0.01* 0.22 ± 0.01° 0.41 ± 0.01 0.12 ± 0.03 0.09 ± 0.01 0.18 ± 0.02
Δ(0-20) 1.02 ± 0.03* 0.78 ± 0.04° 1.76 ± 0.02 0.13 ± 0.05 0.10 ± 0.01 0.17 ± 0.05
Δ(0-32) 1.33 ± 0.06* 1.02 ± 0.02° 1.64 ± 0.01 0.25 ± 0.03 0.20 ± 0.04 0.30 ± 0.01
HOMA
Δ(0-12) 0.62 ± 0.01* 0.84 ± 0.02° 0.46 ± 0.01 -0.18 ± 0.04 -0.20 ± 0.05 -0.10 ± 0.03
Δ(0-20) 0.91 ± 0.04* 1.02 ± 0.03° 0.86 ± 0.02 -0.27 ± 0.12 -0.37 ± 0.15 -0.18 ± 0.10
Δ(0-32) 1.12 ± 0.06* 1.48 ± 0.05° 0.89 ± 0.03 -0.26 ± 0.06 -0.34 ± 0.05 -0.19 ± 0.06
*p < 0.05 vs. control group; °p < 0.05 vs. no adverse outcome.
Falbo et al. Journal of Ovarian Research 2010, 3:23
/>Page 6 of 8
SHBG, the FAI is improved as compared to pregnancy
start. Thus, other factors, mainly related to insulin resis-
tance impairment, cannot be excluded in generating
pregnancy complications in PCOS. In fact, the insulin
resistance indexes measured were worsened at the sec-
ond and third trimester of pregnancy in our sample of
non-obese PCOS patients when compared to healthy
controls with similar age and BMI.
Insulin resistance c ould be per se sufficient to induce
endothelial dysfunction directly or indirectly through
multiple pathways, and thus predispose cardiovascular
disease and to major pregnancy complications in the
third trimester, including pre-eclam psia and IUGR [21].
In particular, even if not always demonstrated [22], sev-
eral data [23-26] supported the association between
insulin r esistance and subsequent pre-eclam psia. In par-
ticular, two prospective studies [23,24] showed an
increased risk of pre-eclampsia in women with impaired
insulin resistance during the second trimester of preg-
nancy. Similarly, more recent data [25,26] remarked an
association also between first trimester insulin resistance
and subsequent pre-eclampsia. In fact, insulin resistance,
in concert with other contributing factors, including
hyperandrogenism [27], inflammation [28] and increased
weight gain [29], seems to impair the trophoblastic/pla-
cent al angiogenesis and to be a causative factor for pre-
eclampsia development.
Finally, in order to evaluate the effects of the changes
in androgens and insulin sensitivity indexes throughout
pregnancy on the pregnancy and/or neonatal outcomes,
a sub-analysis of our sample according to the presence/
absence of complicated pregnancy was performed.
Although on a very small sample, our data on PCO S
women confirmed previous report on pregnant women
without a specific diagnosis of PCOS [15-18]. In fact,
PCOS women who had a complicated pregnancy were
more hyperandrogenic and insulin resistant throughout
pregnancy in comparison with those who had not a
pregnancy complications. Moreover, the dyn amic during
pregnancy of serum T, DHEAS, SHBG, FAI, fasting
insulin, GIR and HOMA differed significantly according
to the pregnancy outcomes showing an impairment of
androgen and free androgen levels and insulin resistance
markers. On the other hand, no relevant differences
were obtained in our healthy population between sub-
jects who had a worse pregnancy outcome in compari-
son with those who had not any adverse outcome.
Conclusions
PCOS patients have impaired changes in serum andro-
gen levels a nd insulin s ensitivity indexes during preg-
nancy. These alterations could be implicated in
pregnancy and neonatal complications frequently
observed in women affecte d by PCOS. Further data
deriving from well-powere d studies would be necessary
in order to c onfirm the relationship between hormonal
and metabolic dynamic during pregnancy and risk of
pregnancy complications in women affected by PCOS,
and in order to clarify the specific pathogenetic
mechanisms.
List of abbreviations
A: Androstenedione; AUC: Area under curve; BP: Blood pressure; BMI: Body
mass index; CRL: Crown-rump length; DHEAS: Dehydroepiandrosterone
sulfate; GIR: Fasting glucose-to-insulin ratio; FAI: Free androgen index; HR:
Heart rate; HOMA: Homeostasis model of assessment; IRMA:
Immunoradiometric assay; IRB: Institutional Review Board; CV: Intra- and
inter-assay coefficients of variation; OGTT: Oral glucose tolerance test; PCO:
Polycystic ovaries; PCOS: Polycystic ovary syndrome; RIA: Radioimmunoassay;
RR: Relative risk; SHBG: Sex-hormone binding globulin; SD: Standard
deviation; T: Total testosterone; WHR: Waist-to-hip ratio.
Author details
1
Department of Obstetrics & Gynecology, University “Magna Graecia” of
Catanzaro, Catanzaro, Italy.
2
Department of Obstetrics & Gynecology,
University “Federico II” of Naples, Naples, Italy.
3
Endocrinology, “Parthenope”
University, Naples; Italy.
Authors’ contributions
SP conceived of the study, and participated in its design and coordination.
FA conceived of the study, participated in the study design and performed
the statistical analysis. MR, TR and AD participated in the patients’ enrolment.
FO, AT and FZ participated in the manuscript drafting and critical discussion.
All authors read and approved the final manuscript.
Competing interests
The authors declare that they have no competing interests.
Received: 28 June 2010 Accepted: 13 October 2010
Published: 13 October 2010
References
1. Boomsma CM, Eijkemans MJ, Hughes EG, Visser GH, Fauser BC, Macklon NS:
A meta-analysis of pregnancy outcomes in women with polycystic ovary
syndrome. Hum Reprod Update 2006, 12:673-683.
2. Palomba S, Falbo A, Russo T, Battista L, Tolino A, Orio F, Zullo F: Uterine
blood flow in pregnant patients with polycystic ovary syndrome:
relationships with clinical outcomes. BJOG 2010, 117:711-721.
3. Palomba S, Falbo A, Russo T, Tolino A, Orio F, Zullo F: Pregnancy in
women with polycystic ovary syndrome: the effect of different
phenotypes and features on obstetric and neonatal outcomes. Fertil Steril
.
4. Rotterdam ESHRE/ASRM-Sponsored PCOS Consensus Workshop Group:
Revised 2003 consensus on diagnostic criteria and long-term health
risks related to polycystic ovary syndrome. Fertil Steril 2004, 81:19-25.
5. Ferriman D, Gallwey JD: Clinical assessment of body hair growth in
women. J Clin Endocrinol Metab 1961, 21:1440-1447.
6. Matthews DR, Hosker JP, Rudenski AS, Naylor BA, Treacher DF, Turner RC:
Homeostasis model assessment: insulin resistance and b-cell function
from fasting plasma glucose and insulin concentrations in man.
Diabetologia 1985, 28:412-419.
7. Ducluzeau PH, Cousin P, Malvoisin E, Bornet H, Vidal H, Laville M, Pugeat M:
Glucose-to-insulin ratio rather than sex hormone-binding globulin and
adiponectin levels is the best predictor of insulin resistance in nonobese
women with polycystic ovary syndrome. J Clin Endocrinol Metab 2003,
88:3626-3631.
8. Morley JE, Patrick P, Perry HM III: Evaluation of assays available to
measure free testosterone. Metabolism 2002, 51:554-559.
9. Orio F Jr, Lucidi P, Palomba S, Tauchmanovà L, Cascella T, Russo T,
Zullo F, Colao A, Lombardi G, De Feo P: Circulating ghrelin
concentrations in the polycystic ovary syndrome. J Clin Endocrinol
Metab 2003, 88:942-945.
Falbo et al. Journal of Ovarian Research 2010, 3:23
/>Page 7 of 8
10. Mizuno M, Lobotsky J, Lloyd CW, Kobayashi T, Murasawa Y: Plasma
androstenedione and testosterone during pregnancy and in the
newborn. J Clin Endocrinol Metab 1968, 28:1133-1142.
11. Rivarola MA, Forest MG, Migeon CJ: Testosterone, androstenedione and
dehydroepiandrosterone in plasma during pregnancy and at delivery:
concentration and protein binding. J Clin Endocrinol Metab 1968, 28:34-40.
12. Berger NG, Repke JT, Woodruff JD: Markedly elevated serum testosterone
in pregnancy without foetal virilization. Obstet Gynecol 1984, 63:260-262.
13. McClamrock AD, Adashi EY: Gestational hyperandrogenism. Fertil Steril
1992, 57:257-274.
14. Sir-Petermann T, Maliqueo M, Angel B, Lara HE, Pérez-Bravo F,
Recabarren SE: Maternal serum androgens in pregnant women with
polycystic ovarian syndrome: possible implications in prenatal
androgenization. Hum Reprod 2002, 17:2573-2579.
15. Acromite MT, Mantzoros CS, Leach RE, Hurwitz J, Dorey LG: Androgens in
preeclampsia. Am J Obstet Gynecol 1999, 180:60-63.
16. Serin IS, Kula M, Başbuğ M, Unlühizarci K, Güçer S, Tayyar M: Androgen
levels of preeclamptic patients in the third trimester of pregnancy and
six weeks after delivery. Acta Obstet Gynecol Scand 2001, 80:1009-1013.
17. Carlsen SM, Jacobsen G, Romundstad P: Maternal testosterone levels
during pregnancy are associated with offspring size at birth. Eur J
Endocrinol 2006, 155:365-370.
18. Vanky E, Salvesen KA, Asberg A, Carlsen SM: Haemoglobin, C-reactive
protein and androgen levels in uncomplicated and complicated
pregnancies of women with polycystic ovary syndrome. Scand J Clin Lab
Invest 2008, 68:421-426.
19. Sir-Petermann T, Hitchsfeld C, Maliqueo M, Codner E, Echiburú B, Gazitúa R,
Recabarren S, Cassorla F: Birth weight in offspring of mothers with
polycystic ovarian syndrome. Hum Reprod 2005, 20:2122-2126.
20. Shobel HP, Fischer T, Heuszer K, Geiger H, Schmieder RE: Preeclampsia: a
state of sympathetic overactivity. N Engl J Med 1996, 335:1480-1485.
21. Lampinen KH, Rönnback M, Groop PH, Kaaja RJ: A relationship between
insulin sensitivity and vasodilation in women with a history of
preeclamptic pregnancy. Hypertension 2008, 52:394-401.
22. Seely EW, Solomon CG: Insulin resistance and its potential role in
pregnancy-induced hypertension. J Clin Endocrinol Metab 2003,
88:2393-2398.
23. Sowers JR, Saleh AA, Sokol RJ: Hyperinsulinemia and insulin resistance are
associated with preeclampsia in African-Americans. Am J Hypertens 1995,
8:1-4.
24. Joffe GM, Esterlitz JR, Levine RJ, Clemens JD, Ewell MG, Sibai BM,
Catalano PM: The relationship between abnormal glucose tolerance and
hypertensive disorders of pregnancy in healthy nulliparous women.
Calcium for Preeclampsia Prevention (CPEP) Study Group. Am J Obstet
Gynecol 1998, 179:1032-1037.
25. Wolf M, Sandler L, Muñoz K, Hsu K, Ecker JL, Thadhani R: First trimester
insulin resistance and subsequent preeclampsia: a prospective study. J
Clin Endocrinol Metab 2002, 87:1563-1568.
26. Thadhani R, Ecker JL, Mutter WP, Wolf M, Smirnakis KV, Sukhatme VP,
Levine RJ, Karumanchi SA: Insulin resistance and alterations in
angiogenesis: additive insults that may lead to preeclampsia.
Hypertension 2004, 43:988-992.
27. Thadhani R, Ecker J, Kettyle E, Sandler L, Frigoletto F: Pulse pressure and
risk of preeclampsia: a prospective study. Obstet Gynecol 2001, 97:515-520.
28. Wolf M, Kettyle E, Sandler L, Ecker JL, Roberts J, Thadhani R: Obesity and
preeclampsia: the potential role of inflammation. Obstet Gynecol 2001,
98:757-762.
29. Sibai BM, Ewell M, Levine RJ, Klebanoff MA, Esterlitz J, Catalano PM,
Goldenberg RL, Joffe G: Risk factors associated with preeclampsia in
healthy nulliparous women. The Calcium for Preeclampsia Prevention
(CPEP) Study Group. Am J Obstet Gynecol 1997, 177:1003-1010.
doi:10.1186/1757-2215-3-23
Cite this article as: Falbo et al.: Changes in androgens and insulin
sensitivity indexes throughout pregnancy in women with polycystic
ovary syndrome (PCOS): relationships with adverse outcomes. Journal of
Ovarian Research 2010 3:23.
Submit your next manuscript to BioMed Central
and take full advantage of:
• Convenient online submission
• Thorough peer review
• No space constraints or color figure charges
• Immediate publication on acceptance
• Inclusion in PubMed, CAS, Scopus and Google Scholar
• Research which is freely available for redistribution
Submit your manuscript at
www.biomedcentral.com/submit
Falbo et al. Journal of Ovarian Research 2010, 3:23
/>Page 8 of 8