báo cáo hóa học:" Analysis of ovarian tumor pathology by Fourier Transform Infrared Spectroscopy" pdf
Bạn đang xem bản rút gọn của tài liệu. Xem và tải ngay bản đầy đủ của tài liệu tại đây (724.66 KB, 6 trang )
RESEA R C H Open Access
Analysis of ovarian tumor pathology by Fourier
Transform Infrared Spectroscopy
Ranjana Mehrotra
1*
, Gunjan Tyagi
1
, Deepak K Jangir
1
, Ramesh Dawar
2
, Noopur Gupta
2
Abstract
Background: Ovarian cancer is the second most common cancer among women and the leading cause of death
among gynecologic malignancies. In recent years, infrared (IR) spectroscopy has gained attention as a simple and
inexpensive method for the biomedical study of several diseases. In the present study infrared spectra of normal
and malignant ovarian tissues were recorded in the 650 cm
-1
to 4000 cm
-1
region.
Methods: Post surgical tissue samples were taken from the normal and tumor sections of the tissue. Fourier
Transform Infrared (FTIR) data on twelve cases of ovarian cancer with different grades of malignancy from patients
of different age groups were analyzed.
Results: Significant spectral differences between the normal and the ovarian cancerous tissues were observed. In
particular changes in frequency and intensity in the spectral region of protein, nucleic acid and lipid vibrational
modes were observed. It was evident that the sample-to-sample or patient-to-patient variations were small and the
spectral differences between normal and diseased tissues were reproducible.
Conclusion: The measured spectroscopic features, which are the spectr oscopic fingerprints of the tissues, provided
the important differentiating information about the malignant and normal tissues. The findings of this study
demonstrate the possible use of infrared spectroscopy in differentiating normal and malignant ovarian tissues.
Background
Ovarian cancer is one of the leading causes of cancer-
related deaths among women worldwide. In India, the
Indian Council of Medical Research reports the incidence
rate of ovarian cance r as 4.2 per 100,000 women [1].
A woman has a lifetime risk of ovarian cancer of around
1.5%, which makes it the second most common gyneco-
logic malignancy [2]. Ovarian cancer usually occurs in
women over the age of 50 years, but it can also affect
younger women. Two types of ovarian cancers are found
based on the cell types. Epithelial ovarian cancer, which
starts in the surface layer covering the ovary and consti-
tutes 80 to 90% of all tumo urs of the ovary. Germ line
ovarian tum ors which are derived from the germ cells of
the ovary and occur much less frequently. The survival
rate of ovarian cancer patient depends upon the stage at
which the cancer is diagnosed. But ovarian cancer is hard
to detect early, as early stage is generally asymptomatic.
More than 75% of ovarian cancers are diagnosed with
late stage disease. Patients would have a significantly-
improved survival if their cancer could be d etect ed while
still limited to the ovary [3].
There is a widespread interest in developing screening
methods for early ovarian cancer detection because of
the high mortality associated with late stage disease.
Presently, the test available for screening ovarian cancer
patients focus on two areas. One is the assessment of
certain biomarkers in the blood. The se cond area is of
producing detailed images of ovaries through various
imaging techniques. The most commonly used blood
serum biomarker is Cancer Antigen 125 (CA-125) [4].
Specificity is not achieved by this test as other types o f
cancer can raise the CA-125 levels such as breast, endo-
metrium, gastrointestinal tract, and lung cancer. CA-125
testing is also not effective in women who are pre-
menopausal because the CA-125 level fluctuates during
the menstrual cycle [5].
On the imaging area of study several imaging techniques
have been employed such as Computed Tomography
* Correspondence:
1
Optical Radiation Standards, National Physical Laboratory, (Council of
Scientific and Industrial Research, New Delhi), Dr K S Krishnan Marg, New
Delhi 110012, India
Full list of author information is available at the end of the article
Mehrotra et al . Journal of Ovarian Research 2010, 3:27
/>© 2010 Mehrotra et al; licensee BioMed Central Ltd. This is an Open Access article distributed under the terms of the Creative
Commons Attribution License ( which permits unrestrict ed use, distribution, and
reproduction in any medium, pro vided the original wor k is properly cited.
(CT), Magnetic Resonance Imaging (MRI) and Ultrasound
Imaging. Studies have shown that ultrasound gives a poor
accuracy in detecting early stage disease [6]. A much more
accurate ultrasound imaging screening test is the Trans
Vaginal Ultrasonography (TVS) which gives impressi ve
results, however it is inefficient in distinguishing between
benign an d malignant masses. The only way to diagnose
ovarian cancer with certainty is an exploratory operation.
But it is not possible in cases when the woman is in poor
health or the disease is advanced.
Current screening technique s are challenge d due to
cost-ineffectiveness, variable false-positive results, and
the asymptomatic nature of the early stages of ovarian
cancer. Thus, it is required to develop an accurate,
quick, convenient, and inexpensive method for detecting
early cancer of ovaries at molecular level. Spectroscopy
is increasingly used now days to characterize physical
and chemical changes occurring in tissues and cells. It
offers possibilities for new diagnostic and t herapeutic
approaches [7]. Spectroscopic techniques such as fluor-
escence and nuclear magnetic resonance (NMR) have
been employed to distinguish cancerous and non-
cancerous states of a tissue [8]. Fluorescence spectro-
scopy can provide biochemical information about the
state of a tissue, but suffers from broad band fluores-
cence features [9]. There are only a small number of
endogenous fluorophores in cancero us tissue to provide
fluorescent signals and hence give rise to undesirable
broad spectral features [10]. Tissue analysis by NMR
spectroscopy requires highly sophisticated instrumenta-
tion and still suffers with unresolved peaks due to con-
strained molecular motions [11].
With the advances in vibrational spectros copic techni-
ques, its application in medical biology is increa sing day
by day [12,13]. Fourier transform infrared spectroscopy
(FTIR) is a relatively simple, rapid and nondestructive
technique that is adaptable for solids, liquids, and gases
with a minimal sample preparation and can be used for
both qualitative identification and the quantitative analy-
sis of various components in a complex mixture [14,15].
Analysis of characteristic group frequencies in a spec-
trum allows qualitative estimates of chemical composi-
tion in these materials. Biomolecular features like
conformational state, side chain length and inter/intra
chain bondings can be measured easily using infrared
spectroscopy. Rec ently, the applicati on of infrare d spec-
troscopy in biomedical sciences has increased a lot and
various new clinical applications have been reported in
the literature th ese applications include analysis of bone
[16], skin [17], lung [18], breast [19], prostate [12] and
cervical tissues [15]. Furthermore, this technique has
been used in anticancer drug investigations [20-22], can-
cer grading (14), and studies on nucleic acid from tumor
cells [23]. Fourier transform infrared spectroscopy has
been extensively employed in the field of cancer
research to address the problems of tumor biology
[24-30]. The results of our previous research have
shown its advantage in discrimination of breast cancer
tissue from normal breast tissue [31]. In the present
work, we examine the cancerous and normal tissues of
ovaries to obtain information about ovarian cancer at
molecular level with FTIR technique.
Methods
Tissue sampling
Tissue samples of 12 cases of ovarian cancer were
obtained from Dharamshila Hospital, Delhi. Informed
consent from patients have been taken prior to surgery.
Post surgical cancer tissue and normal tissue (2-3 cm
away from the tumor) samples were collected. All the
samples were of stage II and III. For each case two sam-
ples were cut, one was put on the glass sli de and was
used for histological review. The other part of the tissue
was frozen (-28°C) to obtain cryostat sections (2-4 μm)
which were taken on zinc selenide (ZnSe) crystal plates.
ThetissuesectionswereplacedontheZnSeplates
without any fixative and were used for spectral analysis.
Spectral measurements
Varian 660 IR spectrometer equipped with DTGS detec-
tor and KBr beam splitter was used to record the spec-
tra. FTIR spectra were collected in the t ransmission
mode. The spectra wer e scanned in the mid-IR range
from 650 to 4000 cm
-1
with a resolution of 4 cm
-1
.Two
hundred and fifty six scans were collected for each spec-
trum and the spectra were ratioed against the back-
ground spectrum. The spectra were normalized after the
baseline correction. Second order derivative of all the
spectra were calculated using savitzky-Golay 2
nd
order
polynomial with 11 data points.
Results and discussion
The spectra of the normal and cancerous ovarian tissue
from different patients were recorded. The infrared
spectrum of ovarian cancer tissue was found to be dif-
ferent from infrared spectrum of normal ovarian tissue.
The malignant tissue exhibited deviations, in infrared
bands assigned to biomolecular bonds, from their nor-
mal count erparts in all the cases studied. The malignant
ovarian tissue spectra appeared to be more complicated
as compared to normal ovarian tissue spectra. The spec-
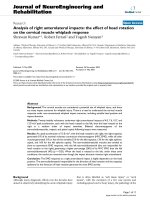
tral assignments were based on literature [29]. Figure 1
shows the overlaid IR spectra of the normal and malig-
nant tissue in the region 900-1300 cm
-1
[32] The t wo
major bands in this region at 1078 cm
-1
and 1238 cm
-1
are mainly due to the symmet ric and asymmetric
stretching modes of phosphodiester groups respectively
[15,33]. As most of the phosphodiester groups in
Mehrotra et al . Journal of Ovarian Research 2010, 3:27
/>Page 2 of 6
biological tissues are found in nucleic acids [34,35],
these tw o bands are associated to the n ucleic acid con-
tent of a cell. Malignant tissue shows a strong peak at
1069 cm
-1
, which is present as a broad peak of lesser
intensity at 1078 cm
-1
in the spectrum of normal tissue.
The anti symmetric phosphate stretching vibra tions at
1238 cm
-1
in normal tissue appears as a broad shoulder
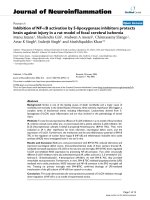
in the spectrum of malignant tissue. The spectral shift-
ing and increased intensity of phosphate bands become
clearer in the second order derivative spectra of the
region 900-1300 cm
-1
(Figure 2). The differenc e observed
for symmetric and anti symmetric phosphate vibrations
indicate t owards the higher content of DNA in malig-
nant tissue caused by characteristic endless replication
of DNA in cancerous cells. The results obtained for
nucleic acid are in corroboration with the findings of
Anastassopoulou et al and Krafft et al, where increased
intensity of nucleic acid bands were observed in cancer-
ous tissue suggesting higher proliferative activity in
malignant cells compared to the normal ones [36,37].
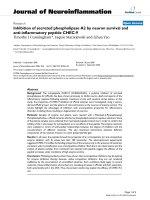
Significant difference between the normal and malig-
nant ovarian tissue spectra is observed in the region of
1500-1700 cm
-1
(Figure 3). This region denotes amide I,
II and III bands of proteins. Vibrational bands at 1630,
1642 and 1647 cm
-1
(amide I) arise mainly due to C = O
stretching vibrations of the amide group of the protein
backbone. T hese are primarily characterized by the alpha
helix secondary structure of proteins [38]. The absorp-
tion bands at 1536, 1543 and 1554 cm
-1
arising from
amide N-H bending vibrations are attributed to beta
she et secondary structure of protei ns [39-41]. This spec-
tral region is sensitive to changes in the molecular geo-
metry and hydrogen bondings of peptide g roups [39]. In
comparison to normal tissue, malignant tissue spectrum
exhibits shifting along with intensity variation in the
bands assigned to alpha and beta structures. The increase
in intensity is more prominent in the region assigned to
beta structure as compared to alpha structure i n the
spectrum of malignant tissue. This could be attributed to
alpha to beta conversion in the secondary structure of
proteins in malignant t issue. These results are in corro-
boration with the findings of Yamada et al where the ana-
lysis of secondary structure of proteins reveal increased
amount of beta sheet in necrotic area of carcinoma as
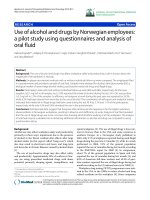
compared to alpha helix [24]. Moreover the bands in the
protein region are disturbed in the spectrum of malig-
nant tissue as compared to clear IR bands in the spec-
trum of normal ovarian tissue. Second order derivative
spectra of protein (Figure 4) region clearly depicts that IR
Figure 1 Overlaid IR spectra of normal and malignant ovarian
tissue in the region 900-1300 cm
-1
.
Figure 2 Overlaid second order derivative IR spectra of normal
and malignant ovarian tissue in the region 900-1300 cm
-1
.
Figure 3 Overlaid IR spectra of normal and malignant ovarian
tissue in the region1500-1700 cm
-1
.
Mehrotra et al . Journal of Ovarian Research 2010, 3:27
/>Page 3 of 6
bands of proteins in the malignant tissue are complicated
and more in number as compared to normal tissue. Pro-
teins play an important role in the physiological pro-
cesses of living systems. Major functions of an organism
are regulated by enzymes and hormones which are pro-
teins. Protein content of a cell can be considered a diag-
nostic t ool to determine the physiological phase of a cell
[42]. The depletion of protein profile in the spectrum of
malignant ovarian tissue indicates towards induced diver-
sification of energy to meet the impending energy
demands during the malignant stress of cell [43].
Figure 5 shows the overlaid IR spectra of normal and
malignant tissue in the region 2820 - 2980 cm
-1
.This
region is associated with the stretching vibrations of
lipid hydrocarbons. Remarkable changes are observed in
this region for m alignant tissue as compared to its
normal counterpart. Two peaks at 2850 cm
-1
and 2919
cm
-1
result from stretching vibrations of the CH
2
and
CH
3
groups in acyl chains of lipids [38]. These peaks
underwent a significant increase in intensity in malig-
nant tissue as compared to normal tissue. The increase
in intensity is more clearly seen in second order deriva-
tive spectra of normal and malignant tissue in the region
2820-2980 cm
-1
(Figure 6). This increase in intensity
indicates enhancement in lipid contents in malignant
cells. These results are in corroboration with the find-
ings of struchkov et al where considerable increase of
neutral lipids in nulei of Ehrlich ascites carcinoma was
observed [44]. Also tumor cells have dysregulat ed meta-
bolism as compared to normal cells; they undergo glyco-
lytic rather oxidative metabolism and synthesize greater
amount of fatty acids than normal cells. It is also
reported earlier that tumor cells exhibit increase in de
novo fatty acid synthesis, where as normal cells are
thought to acquire fatty acids primarily from dietary
sources [45]. Nomura et al demonstrate the increase of
an enzyme monoacyl glycerol lipase (MAGL) in high
grade human ovarian cells, due to which the lipid con-
tent of malignant cells increases [46]. These reports sup-
port our observation of increased intensity in the
characteristic lipid bands in the IR spectrum of malig-
nant ovarian tissue.
Conclusion
Theresultsofthepresentstudyhaveshownthat
remarkable difference exist bet ween the IR spectra of
normal and malignant tissue in t erms of absorption fre-
quencies and intensities of prominent absorption bands
of cellular biomolecules. The differences observed in the
spectra of normal and malignant tissue reflect changes
in the content of nucleic acid and lipids. Protein
Figure 4 Overlaid second order derivative IR spectra of normal
and malignant ovarian tissue in the region 1500-1700 cm
-1
.
Figure 5 Overlaid IR spectra of normal and malignant ovarian
tissue in the region 2820-2890 cm
-1
.
Figure 6 Overlaid second order derivative IR spectra of normal
and malignant ovarian tissue in the region 2820-2890 cm
-1
.
Mehrotra et al . Journal of Ovarian Research 2010, 3:27
/>Page 4 of 6
absorption bands indicate the presence of ne w proteins
as well as changes in their conformation and composi-
tion. Spectral absorption patterns observed for major
biomolecules; nucleic acid, proteins and lipids can be
viewed as IR spectral signatures which can be used for
distinguishin g malignant ovarian tissue from the normal
tissue. Based on this, we can compare the infrared spec-
trum of malignant tissue with its corresponding normal
tissue, and establish a new way to diagnose malignant
tumors. Prospectively, in conjunction with o ther mar-
kers this technique could be useful in diagnosis of ovar-
ian cancer.
Acknowledgements
Authors are thankful to Department of Science and Technology, New Delhi,
India for providing the financial support (Grant No. DST/TSG/PT/2006/50).
Author details
1
Optical Radiation Standards, National Physical Laboratory, (Council of
Scientific and Industrial Research, New Delhi), Dr K S Krishnan Marg, New
Delhi 110012, India.
2
Department of Pathology, Dharamshila Cancer Hospital
and Research Centre, Vasundhara Enclave, Delhi 110096, India.
Authors’ contributions
RM contributed in the conception and design of the idea, interpreted the
data, performed the statistical analysis and given final approval for the
version to be published. GT contributed towards acquisition and analysis of
data and preparation of manuscript. DKJ participated in coordination of the
study and helped to design the manuscript. RD and NG provided the
samples, helped in biological corroboration of spectral data and revision of
manuscript. All authors read and approved the final manuscript.
Competing interests
The authors declare that they have no competing interests.
Received: 16 September 2010 Accepted: 21 December 2010
Published: 21 December 2010
References
1. In Biennial Report (1990-96) of National Cancer Registry Programme, Indian
Council of Medical Research: New Delhi. Edited by: Nandkumar A. National
Printing Press: Bangalore; 2001:62-63.
2. American Cancer society. [].
3. Hoskins WJ: Prospective on ovarian cancer: Why prevent? J Cell Biochem
Suppl 1995, 23 :189-199.
4. Fritsche HA, Bast RC: CA 125 in Ovarian Cancer: Advances and
Controversy. Clin Chem 1998, 44:1379-1380.
5. Togashi K: Ovarian cancer: the clinical role of US, CT and MRI. Eur Radiol
2003, 13:87-104.
6. O’Rourke J, Mahon SM: A Comprehensive Look at the Early Detection of
Ovarian Cancer. Clin J Oncol Nurs 2002, 7:41-47.
7. Alfano R, Tata D, Cordero J, Tomashefshy P, Longo F, Alfano M: Laser
induced fluorescence spectroscopy from native cancerous and normal
tissues. IEEE J Quantum Electron 1984, 20:1507-1511.
8. Servick-Muraca E, Richards-Kortum R: Quantitative optical spectroscopy for
tissue diagnosis. Annu Rev Phys Chem 1996, 47:556-606.
9. Liu Q, Chen K, Martin M, Wintenberg A, Lenarduzzi R, Panjehpour M,
Overholt BF, Vo-Dinh T: Development of a synchronous fluorescence
imaging system and data analysis methods. Opt Express 2007,
15(20):12583-12594.
10. Haka AS, Shafer-Peltier KE, Fitzmaurice M, Crowe J, Dasari RR, Feld MS:
Diagnosing breast cancer by using Raman spectroscopy. PNAS 2005,
102(35):12371-12376.
11. Whitehead TL, Kieber-Emmons T: Applying in vitro NMR spectroscopy and
1 H NMR metabonomics to breast cancer characterization and
detection. Prog Nucl Magn Reson Spectrosc 2005, 47:165-174.
12. Paluszkiewicz C, Kwiatek WM: Analysis of human cancer prostate tissues
using FTIR microspectroscopy and SRIXE technique. J Mol Struct 2001,
565-566:329-334.
13. Weng SF, Ling XF, Song YY, Xu YZ, Zhang X, Yang L, Sun W, Zhou X, Wu J:
FTIR fiber optics and FT-Raman spectroscopic studies for the diagnosis
of cancer. Am Clin Lab 2000, 19:20.
14. Andrus PG, Strickland RD: Cancer grading by Fourier transform infrared
spectroscopy. Biospectroscopy 1998, 4:37-46.
15. Wood BR, Quinn MQ, Tait B, Romeo M, Mantsch HH: A FTIR spectroscopic
study to identify potential confounding variables and cell types in
screening for cervical malignancies. Biospectroscopy 1998, 4 :75-91.
16. Rehman I, Smith R, Hench LL, Bonfield W:
Structural evaluation of human
and sheep bone and comparison with synthetic hydroxyapatite by FT-
Raman spectroscopy. J Biomed Mater Res 1995, 29:1287-1294.
17. Wong PTT, Goldstein SM, Grekin RC, Godwin TA, Pivik C, Rigas B: Distinct
infrared spectroscopic patterns of human basal cell carcinoma of the
skin. Cancer Res 1993, 53:762-765.
18. Das RM, Ahmed MK, Mantsch HH, Scott JE: FT-IR spectroscopy of
methylmercury- exposed mouse lung. Mol Cell Biochem 1995, 145:75-79.
19. Redd DC, Feng ZC, Yue KT, Gansler TS: Raman Spectroscopic
Characterization of Human Breast Tissues: Implications for Breast Cancer
Diagnosis. Appl Spectrosc 1993, 47:787-791.
20. Binoy J, Abraham JP, Joe IH, Jayakumar VS, Pettit GR, Nielsen OF: NIR-FT
Raman and FT-IR spectral studies and ab initio calculations of the anti-
cancer drug combretastatin-A4. J Raman Spectros 2004, 35:939-946.
21. Jangir DK, Tyagi G, Mehrotra R, Kundu S: Carboplatin interaction with callf-
thymus DNA: A FTIR spectroscopic approach. J Mol struct 2010,
969:126-129.
22. Tyagi G, Jangir DK, Singh P, Mehrotra R: DNA interaction studies of an
anti-cancer plant alkaloid vincristine using Fourier transform infrared
spectroscopy. DNA Cell Biol 2010, 29(11):693-699.
23. Dovbeshko GI, Chegel VI, Gridina NY, Repnytska OP, Shirshov YM,
Tryndiak VP, Todor IM, Solyanik GI: Surface enhanced IR absorption of
nucleic acids from tumor cells: FTIR reflectance study. Biopolymers 2002,
67(6):470-86.
24. Yamada T, Miyoshi N, Ogawa T, Akao K, Fukuda M, Ogasawara T,
Kitagawa Y, Sano K: Observation of molecular changes of a necrotic
tissue from a murine carcinoma by Fourier-transform infrared
microspectroscopy. Clin Cancer Res 2002, 8:2010-2014.
25. Argov S, Ramesh J, Salman A, Sinelnikov I, Goldstein J, Guterman H,
Mordechai S: Diagnostic potential of Fourier-transform infrared
microspectroscopy and advanced computational methods in colon
cancer patients. J Biomed Opt 2002, 7:248-254.
26. Yano K, Ohoshima S, Gotou Y, Kumaido K, Moriguchi T, Katayama H: Direct
measurement of human lung cancerous and noncancerous tissues by
fourier transform infrared microscopy: can an infrared microscope be
used as a clinical tool? Anal Biochem 2000, 25:287-218.
27. Romeo MJ, Wood BR, Quinn MA, McNaughton D: Removal of blood
components from cervical smears: Implications for cancer diagnosis
using FTIR spectroscopy. Biopolymers 2003, 72:69-76.
28. Wong PT, Senterman MK, Jackli P, Wong RK, Salib S, Campbell CE, Feigel R,
Faught W, Fung Kee Fung M: Detailed account of confounding factors in
interpretation of FTIR spectra of exfoliated cervical cells. Biopolymers
2002, 67:376-386.
29. Ramesh J, Kapelushnik J, Mordehai J, Moser A, Huleihel M, Erukhimovitch V,
Levi C, Mordechai S:
Novel methodology for the follow-up of acute
lymphoblastic leukemia using FTIR microspectroscopy. J Biochem Biophys
Methods 2002, 51:251-261.
30. Wang JS, Shi JS, Xu YZ, Duan XY, Zhang L, Wang J: FT-IR spectroscopic
analysis of normal and cancerous tissues of esophagus. World J
Gastroenterol 2003, 9:1897-1899.
31. Mehrotra R, Gupta A, Kaushik A, Prakash N, Kandpal Hem: Infrared
spectroscopic analysis of tumor pathology. Indian J Exp Biol 2007,
45:71-76.
32. Rehman S, Movasaghi Z, Darr JA, Re hman IU: Fou rier Transfo rm
Infrared Spectroscopic Analysis of Breast Cancer Tissues; Identifying
Differences between Normal Breast, Invasive Ductal Carcinoma, and
Ductal Carcino ma In Situ o f the Breast. Appl Spectrosc Rev 2010 ,
45:355-368.
33. Banyay M, Sarkar M, Graslund A: A library of IR bands of nucleic acids in
solution. Biophys Chem 2003, 104:477-488.
Mehrotra et al . Journal of Ovarian Research 2010, 3:27
/>Page 5 of 6
34. Wong PTT, Papavassiliou ED, Rigas B: Phosphodiester Stretching Bands in
the Infrared Spectra of Human Tissues and Cultured Cells. Appl Spectrosc
1991, 45(9):1563-1567.
35. Sheeler P, Bianchi DE: Cell Biology John Wiley and Sons, New York; 1980.
36. Anastassopoulou J, Arapantoni P, Boukaki E, Konstadoudakis S,
Theophanides S, Valavanis C, Conti C, Ferraris P, Giorgini G, Sabbatini S,
Tosi G: Micro-FT-IR Spectroscopic Studies Of Breast Tissues. In Brilliant
Light in Life and Material Sciences. Volume 13. Edited by: Tsakanov V,
Wiedemann H. Springer Netherlands; 2007:273-278.
37. Krafft C, Sobottka SB, Schackert G, Salzera R: Analysis of human brain
tissue, brain tumors and tumor cells by infrared spectroscopic mapping.
Analyst 2004, 129:921-925.
38. Liu C, Zhang Y, Yan X, Zhang X, Li C, Yang W, Shi D: Infrared absorption of
human breast tissues in vitro. J Lumin 2006, 119-120:132-136.
39. Dukor RK: Applications in Life, Pharmaceutical and Natural Sciences. In
Handbook of Vibrational Spectroscopy. Volume 5. Edited by: Chalmers JM,
Griffiths PR. John Wiley 2002:3335-3361.
40. Mantsch HH, Choo-Smith L, Shaw RA: Vibrational spectroscopy and
medicine: an alliance in the making. Vib Spectrosc 2002, 30:31-41.
41. Sahu RK, Mordechai S: Fourier transform infrared spectroscopy in cancer
detection. Future Oncol 2005, 1(5):635-647.
42. Yu LR, Zhou M, Conrads TP, Veenstra TD: Diagnostic proteomics: Serum
proteomic patterns for the detection of early stage cancers. Dis Markers
2004, 19:209-218.
43. Cazares LH, Adam BL, Ward MD, Nasim S, Schellhammer PF, Semmes J,
George L: Normal, Benign, Preneoplastic, and Malignant Prostate Cells
Have Distinct Protein Expression Profiles Resolved by Surface Enhanced
Laser Desorption/Ionization Mass Spectrometry. Clin Cancer Res 2002,
8:2541-2552.
44. Rajkapoor B, Jayakar B, Murugesh N: Antitumor activity of Indigofera
aspalathoides on Ehrlich ascites carcinoma in mice. Indian J Pharmacol
2004, 36:38-40.
45. Wong PTT, Lacelle S, Yazdi HM: Normal and malignant human colonic
tissues investigated by pressure tuning FT-IR spectroscopy. Appl
Spectrosc 1993, 47:1830-1836.
46. Nomura DK, Long JZ, Nissen S, Hoover HS, Shu-Wing Ng, Cravatt BF:
Monoacylglycerol lipase regulates a fatty acid network that promotes
cancer pathogenesis. Cell 2010, 140:49-61.
doi:10.1186/1757-2215-3-27
Cite this article as: Mehrotra et al.: Analysis of ovarian tumor pathology
by Fourier Transform Infrared Spectroscopy. Journal of Ovarian Research
2010 3:27.
Submit your next manuscript to BioMed Central
and take full advantage of:
• Convenient online submission
• Thorough peer review
• No space constraints or color figure charges
• Immediate publication on acceptance
• Inclusion in PubMed, CAS, Scopus and Google Scholar
• Research which is freely available for redistribution
Submit your manuscript at
www.biomedcentral.com/submit
Mehrotra et al . Journal of Ovarian Research 2010, 3:27
/>Page 6 of 6