báo cáo hóa học:" Differential expression of aldehyde dehydrogenase 1a1 (ALDH1) in normal ovary and serous ovarian tumors" docx
Bạn đang xem bản rút gọn của tài liệu. Xem và tải ngay bản đầy đủ của tài liệu tại đây (2.47 MB, 13 trang )
RESEA R C H Open Access
Differential expression of aldehyde
dehydrogenase 1a1 (ALDH1) in normal
ovary and serous ovarian tumors
Krishna Penumatsa
1
, Seby L Edassery
1
, Animesh Barua
1,2,3
, Michael J Bradaric
1
, Judith L Luborsky
1,3*
Abstract
Background: We showed there are specific ALDH1 autoantibodies in ovarian autoimm une disease and ovarian
cancer, suggesting a role for ALDH1 in ovarian pathology. However, there is little information on the ovarian
expression of ALDH1. Therefore, we compared ALD H1 expression in normal ovary and benign and malignant
ovarian tumors to determine if ALDH1 expression is altered in ovarian cancer. Since there is also recent interest in
ALDH1 as a cancer stem cell (CSC) marker, we assessed co-expression of ALDH1 with CSC markers in order to
determine if ALDH1 is a potential CSC marker in ovarian cancer.
Methods: mRNA and protein expression were compared in normal human ovary and serous ovarian tumors using
quantitative Reverse-Transcriptase PCR, Western blot (WB) and semi-quantitative immunohistochemistry (IHC).
ALDH1 enzyme activity was confirmed in primary ovarian cells by flow cytometry (FC) using ALDEFLUOR assay.
Results: ALDH1 mRNA expression was significantly reduced (p < 0.01; n = 5) in malignant tumors compared to
normal ovaries and benign tumors. The proportion of ALDH1+ cells was significantly lower in malignant tumors
(17.1 ± 7.61%; n = 5) compared to normal ovaries (37.4 ± 5.4%; p < 0.01; n = 5) and benign tumors (31.03 ± 6.68%;
p < 0.05; n = 5). ALDH1+ cells occurred in the stroma and surface epithelium in normal ovary and benign tumors,
although surface epithelial expression varied more in benign tumors. Localization of ALDH1 was heterogeneous in
malignant tumor cells and little ALDH1 expression occurred in poorly differentiated malignant tumors. In benign
tumors the distribution of ALDH1 had features of both normal ovary and malignant tumors. ALDH1 protein
expression assessed by IHC, WB and FC was positively correlated (p < 0.01). ALDH1 did not appear to be co-
expressed with the CSC markers CD44 , CD117 and CD133 by IHC.
Conclusions: Total ALDH1 expression is significantly reduced in malignant ovarian tumors while it is relatively
unchanged in benign tumors compared to normal ovary. Thus, ALDH1 expression in the ovary does not appear to
be similar to breast, lung or colon cancer suggesting possible functional differences in these cancers.
Significance: These observations suggest that reduced ALDH1 expression is associated with malignant
transformation in ovarian cancer and provides a basis for further study of the mechanism of ALDH1 in this process.
Introduction
In previous studies we identified aldehyde dehydrogen-
ase 1A1 (ALDH1) as a novel antigen in ovarian autoim-
munity associated with unexplained infertility and
premature menopause [1]. We also found t hat patients
with ovarian cancer have anti-ALDH1 antibodies [2].
This prompted us to investigate the expression of
ALDH1 in normal ovaries and ovarian tumors.
ALDH1 is a cytosolic isoform encoded by the
ALDH1A1 gene at chromosome 9q21 [3]. ALDH1
belongs to the aldehyde dehydrogenase superfamily
which is responsible for the oxidation of aldehydes to
their corresponding carboxylic acids [4,5]. It is widely
expressed during normal tissue development and h ome-
ostasis and is also found in immune cells [4-6]. Further-
more, ALDH1 expression is frequently altered in
* Correspondence:
1
Pharmacology, Rush University Medical Center, 1735 W Harrison Street,
Chicago, IL 60612, USA
Full list of author information is available at the end of the article
Penumatsa et al. Journal of Ovarian Research 2010, 3:28
/>© 2010 Penumatsa et al; licensee BioMed Central Ltd. This is an Open Acces s ar ticle distri buted under the terms of the Creative
Commons Attribution License ( which permits unrestricte d use, distribution, and
reproduction in any medium, provided the original work is properly cited.
malignant tumors compared to their respective healthy
tissues [7-10].
ALDH1 is responsible for tissue specific irreversible
oxidation of retinal to the signaling molecule, retinoic
acid (RA) [11]. RAs act through retinoic acid receptors
and function in differentiation, reduced cell prolifera-
tion, tissue homeostasis and apoptosis in various cell
types including ovary [12-17]. In ovarian cancer the
expression of the retinol binding proteins involved in
RA metabolism is reduced [18]. Also it was shown that
in the intestine RA from dendritic cells imprints T and
B cell homing, induces Treg cell differentiation [19,20]
and induces tolerance [21]. This suggests ALDH1 and
its product RA could influence tumor growth either
through regulation of immune cells or by direct effects
on tumor cell growth.
Moreb e t al. using knock-down of the ALDH1A1 and
ALDH3A1 genes in lung cancer cells showed that
ALDH1A1 and ALDH3A1 accounted for cyclophospha-
mide resistance, cell growth and in addition a ffected
other genes which have been implicated in cellular
homeostasis and malignant transformation [22].
Recently, Deng et al. showed that increased ALDH1
expression was correlated with a chemo-resistant pheno-
type in ovarian cancer cell lines [7]. These findings sug-
gest a critical role for ALDH1 in cancer and responses
to drug treatment. Differences in tumor responses to
treatment could be related to ALDH1 expression since
it differs among different cancers [7] and is heteroge-
neously expressed among individuals for each cancer
[23-25].
Aldehyde dehydrogenases are involved in steroid
production, reproduction, oocyte maturation and
early embryo development [26-29]. ALDH1 expres-
sion in normal human ovary and mouse ovary is
among the highest compared to other tissues [30,31].
Inflammation is thought to be a predisposing event
in malignant transformation [32]. Consistent with a
possible modification of ALDH1 by inflammation,
Rae et al. observed that exposing human ovarian
cells to inflammatory stimuliresultedindown-regu-
lation of ALDH1 [33]. Furthermore, ALDH1 expr es-
sion is higher at early tumor stages [24,34] and may
be correlated with clinical outcomes [7,24] in ovar-
ian cancer.
In addition, studies in cancer stem cell biology
revealed that ALDH1 enzyme activity can be used as a
functional marker for isolating hematopoietic stem cell s
[35]. This has led to recent studies of ALDH1 as a mar-
ker in breast cancer stem cells [36]. The association of
cancer stem cells (CSC) with ALDH1 in solid tumors
has been shown primarily by its co-expression in cells
expressing CSC markers [8,36,37]. This has not been
investigated in ovarian cancer.
The high expression of ALDH1 in normal ovary, the
established role of ALDH1 in detoxification and che-
motherapy resistance and the potential role of ALDH1
in CSC in other tumors suggest that ALDH1 may have
a significant role in o varian cancer. There is little infor-
mation on the relative expression of ALDH1 in human
ovary and ovarian tumors. Therefore, to establish a basis
for further studies on the mechanism of ALDH1 in
ovarian cancer, we examined ALDH1 expression and
localization in normal ovary and ovarian tumors in
order to determine if ALDH1 expression is altered, if
the cell types expressing ALDH1 changes and if ALDH1
expression in benign tumors resembles normal ovary or
malignant tumors. We also examined the possibility that
ALDH1 is co-expressed with th e CSC markers CD44,
CD117 and CD133 in order to determine if ALDH1 is
associated with putative stem cells in ovarian cancer.
Materials and methods
Patients and tissue collection
Tissue was obtained from the Department of Pathology
at Rush University Medical Center, Chicago, IL. All pro-
cedures followed an Institutional Review Board (IRB)
approved protocol. Ovarian tissue was obtained from
women with normal ovaries at hysterectomy (mean age
47.4 ± 3.4 years; n = 11), patients with benign serous
ova rian tumor s (mean age 56.1 ± 13.6 years; n = 9) and
primary ovarian cancer patients with malignant serous
ovarian tumors (mean age 58 ± 11.1 years; n = 8). The
tumor histology and tumor grade were determined by
diagnostic evaluation by a pathologist. Malignant serous
tumors comprised Grade 3 (n = 6) and Grade 1 (n = 2)
with Stage II (n = 3) and Stage III (n = 5) pathology.
The criterion for inclusion in the study was women ≥
40 years old (range 43-76 years; mean age 54.2 ± 11.6
years) and for the patients with benign or malignant
ovarian tumors the inclusion c riteria included primary
serous ovarian tumors. The criteria for exclusion were
previous history of any cancer and prior chemotherapy
or radiation treatment.
Assessment of mRNA expression
Total RNA was isolated using TRIZOL reagent (Invitro-
gen, Carlsbad, CA) according to the manufacturer’ s
recom mendation. RNA was measured at an optical den-
sity (OD) of 260 nm and the p urity was evaluated using
an OD 260/280 nm absorbance ratio ≥1.7. Before the
first strand synthesis, 1 μg of total RNA was treated
with DNase to remove trace genomic DNA. cDNA was
synthesized using 500 ng of DNase trea ted RNA with a
High-Capacity cDNA Reverse Transcription kit (Applied
Biosystems, Foster City, CA) according to manufac-
turer’ s recommendation. Primer pairs were designed
using Oligoperfect Designer software (Invitrogen) for
Penumatsa et al. Journal of Ovarian Research 2010, 3:28
/>Page 2 of 13
ALDH1A1 [GenBank: NM_000689; in-between e xon 6
and exon 7]. The Primer sequences were: ALDH1A1
Forward (5’- TTGGAATTTCCCGTTGGTTA-3’)and
Reverse (5’- CTGTAGGCCCATAACCAGGA-3’); Actin
Forward (5’-CTGTGGCATCCACGAAACTA-3’ )and
Reverse (5’- ACATCTGCTGGAAGGTGGAC -3’). The
PCR amplifications were carried out in a 25 μl reaction
volume containing 25 ng of cDNA using Platinum Taq
DNA Polymerase (Invitrogen) according to manufac-
turer’s recommendation. The mixture was denatured at
94°C (3 minutes) followed by 35 cycles at 94°C (30 sec-
onds) and 54°C (30 seconds) to anneal and 72°C (1 min-
ute) for extension followed by a final extension at 72°C
(10 minutes) in a programmable Peltier Thermo Cycler
(PTC-200, MJ Research Inc. Ramsey, MN). The PCR
products were separated by el ectro phoresis in a 3% (W/
V) agarose gel (Invitrogen) and visualized using ethi-
dium bromide stain (Fischer Scientific, Pittsburg, P A).
Amplicon from one positive sample each from normal
ovary and ovarian serous carcinoma was purified using a
QIAquick PCR purification kit (QIAGEN, Valencia, CA)
and sequenced at DNA sequencing facility (University of
Illinois at Chicago) using an ABI 3100 Genetic analyzer
(Applied Biosystems). The amplicon sequences were
blasted against the NCB I RefSeq human mRNA data-
base and confirmed with a perfect match for ALDH1A1
gene [GenBank: NM_000689.3]. Quantitative Reverse
Transcriptase-PCR (qRT-PCR) was carried out using
SYBR green master mix in an ABI 7500 RT-PCR system
and analyzed using the ΔCt method with human Actin
as an internal control according to the manufacturer’s
recommendation (Applied Biosystems). The ΔΔCt was
determined by subtracting ΔCt of each sample from the
average ΔCt of normal ovary. The differences in ALDH1
mRNA expression levels we re calculated as the fold
change using the formula 2
-ΔΔCt
as previously described
[38].
Immunohistochemical (IHC) detection of protein
expression and localization
Tissues were fixed in formaldehyde, embedd ed in paraf-
fin and sectioned (6 μm thick). Sections were mounted
on microscope slides (Fischer Scientific, Pittsburg, PA),
dried (16 hours; 37°C), deparaffinized in xylene, rehy-
drated in graded alcohols and rinsed with tap water.
Sections were examined for histopathology following
routine staining with hematoxylin and eosin (H&E;
Sigma-Aldrich,St.Louis,MO).ALDH1,CD44,CD117
and CD133 expression was visualized using mouse anti-
human ALDH1 mAb (clone 44, BD Transduction Lab
San Jose, CA), mouse anti-human CD44 mAB (clone
IM7; BioLegend, San Diego, CA), rabbit anti-human
CD117 polyclonal antibody (C-19; c-Kit; Santa Cruz Bio-
technology, Santa Cruz, CA) and mouse anti-human
CD133 mAb (clone EMK08; eBioscience, San Diego,
CA) respectively. Staining was carried out according to
the manufacturer’ s protocol (Vector Laboratories,
Burlingame, CA). In brief, antigens were unmasked by
treating with antigen Unmasking solution (Vector
Laboratories) and boiling in a microwave. Endogenous
peroxidase was inactivated using substrate (0.3% H
2
O
2
in methanol; 20 minutes; 22°C). Sections were washed
with phosphate buffer and non-specific binding sites
were blocked with normal horse serum (30 minutes).
The sections were then incubated with mouse anti-
human ALDH1 antibody (1:200) diluted in phosphate
buffer containing 1% Bovine Ser um Albumin (BSA;
Sigma-Aldrich, St. Louis, MO) in a humid chamber (2
hours, 22°C). The bound anti-human ALDH1 antibody
was detected using ABC Universal kit a nd the antigen-
antibody reaction was visualized with 3, 3-diaminobenzi-
dine peroxide substrate (DAB; brown color). As a
control for secondary antibody binding directly to sec-
tions, the ALDH1 antibody was omitted. Sections were
briefly rinsed in water, counterstained with hematoxylin
(Fischer Scientific) and rinsed in running water (15 min-
utes). Double label immunostaining was carried out
according to the manufacturer’s multiple labeling proto-
col (Vector Laboratories). In brief, the ALDH1 stained
sections were further treated with normal horse serum
(30 minutes) to block non-specific binding sites. Sec-
tions were then incubated with anti-human CD44 or
CD177 or CD133 antibo dy (1:100, diluted in 1% BSA in
phosphate buffer) and processed as described for anti-
ALDH1 alone, except that the color was developed with
DAB and Nickel peroxide substrate (gray/black color).
Finally, the sections were dehydrated in graded alcohols
and xylene, and covered using Permount (Fischer Scien-
tific). Sections were examined by light microscopy
(Olympus BX-41, Center Valley, PA) and i mages cap-
tured and evaluated with MicroSuite Five software
(Olympus).
Semi-quantitative Immunohistochemistry
ALDH1 protein expression and localization was assessed
using a unbiased cell counting stereology method with a
microscope (Olympus BX60, Center Valley, PA) inter-
faced with a digital camera (CX9000; MBF Bioscience
Williston, VT), motorized stage and image analys is soft-
ware (StereoInvestigator 8.1, MBF Bioscience, Williston,
VT). Cell estimation was performed using optical frac-
tionator procedure [39]. Three sections/sample (tripli-
cates) were evaluated. Briefly sections were outlined and
scanned at low magnification (×12.5). The thickness of
each section was measured at higher magnification
(×600) in three separate areas, and the average thickness
of each section was calculated. Cells were counted under
higher magnification (×600) using an oil immersion
Penumatsa et al. Journal of Ovarian Research 2010, 3:28
/>Page 3 of 13
objective. Cell counts were estimated within a dissector
height of 7 μm, using an 800 × 800 μm
2
grid size and a
60 × 60 μm
2
counting frame size. The coefficient of
error was calculated based on the Gundersen equation
[40]. ALDH1 staining was quantified using average
number of ALDH1 positive cells divided by the average
number of Hematoxylin counterstained cells in each
group and expressed as % mean ± standard deviation
(SD).
Western blot and densitometry analysis
Total protein was extracted from tissue and separated
by one-dimensional Western blot using 10% gradient
Tris-HCl gels (Bio-Rad, Hercules, CA; 10 μg total pr o-
tein/lane) using standard procedures as described pre-
viously [1]. Proteins were transferred to a nitrocellulose
memb rane (0.45 μm; Bio-Rad). Recombinant ALDH1A1
(rALDH1; 1 μg/lane) produced in collaboration with Dr.
Jim Dias (University of Albany, Albany, NY) was used as
a positive control. Mouse anti-human ALDH1 (1:2000;
clone 44, BD Transduction Lab San Jose, CA) and per-
oxidase-conjugated donkey anti-mouse IgG (1:5000;
Jackson ImmunoResearch Laboratories, West Grove,
PA) antibody was used to detect ALDH1. Human b-
actin was used as a loading control and was detected
with mouse anti-actin (1:2000; Sigma, St. Louis, MO).
Antibodies were diluted in Blocker solution (Sigma)
containing 0.05% Tween 20 (Bio-Rad). The membranes
were washed after each step using Tris-buffered saline
(10 mM Tris and 0.15 M NaCl, pH7.5) containing
0.05% Tween 20. The protein bands were detected using
SuperSignal West Dura substrate (Thermo Scientific,
Rockford, IL). MagicMa rk XP Western standards (Invi-
trogen, Carlsbad, CA) were used to estimate molecular
weight. Digital images were obtained with a Chemidoc
XRS Imaging System (BioRad) and analyzed by Quantity
One software (Bio-Rad) according to manufacturer’s
recommendation. The relative density of each ALDH1
band was expressed as a ratio of the density of ALDH1
band and the corresponding b-actin band.
Assessment of ALDH1 expression and enzyme activity by
flow cytometry
The tissue was dissociated mechanically and enzymati-
cally using a solid human tissue dissociation protocol
(Stemcell Technologies, Vancouver, BC) with minor
modifications. In brief, tissue was minced, washed in
cold Dulbecco’s Phosphate Buffered Saline (DPBS; Invi-
trogen, Carlsbad, CA) and suspended in Dulbecco’ s
Modified Eagle Medium/Nutrient Mixture F-12
(DMEM/F12; Invitrogen) supplemented with 5% Fetal
Bovine Serum (FBS; Invitrogen), collagenase type I
(Worthington, Lakewood, NJ) and DNase 1 (Stemcell
Technologies) f ollowed by i ncubation with gentle
agitation (2 hours; 37°C). The cell pellet and ti ssue
fragments were separated by centrif ugation (5 minutes;
100 × g) followed by a wash with DPBS. A single-cell
suspension was obtained after filtering through 40 μm
sterile nylon mesh (BD Falcon, San Jose, CA). The flow
through was collected in a fresh tube, centrifuged
(5 minutes; 100 × g), washed and suspended in DPBS.
To remove and lyse red blood ce lls the cells were trea-
ted with ammonium chloride solution (BioLegend, San
Diego, CA; 10 minutes; 4°C). Cells were then suspended
in DPBS with 2% BSA and the cell count was deter-
mined using a Coulter Counter (Beckman, Brea, CA).
Aldehyde dehydrogenase enzyme activity in viable
cells was determined using a fluorogenic dye based
ALDEFLOUR assay (Stemcell Technologies) according
to the manufacture r’s instructions. In brief, cells were
suspended (0.5 × 10
6
cells/mL) in ALDEFLUOR assay
buffer containing ALDH substrate (Bodipy-Aminoacetal-
dehyde) and incu bated (45 minutes; 37°C). As a refer-
ence control, the cells were suspended in buffer
containing ALDEFLUOR substrate in the presence of
diethylaminobenzaldehyde (DEAB), a specific ALDH1
enzyme inhibitor. Propidium iodide (2 μg/mL; Sigma, St.
Louis, MO) was used to exclude dead cells. The cells
were analyzed using a FACSCalibur flow cytomet er (BD
Biosciences, Rockville, MD) and t he data was analyzed
using FlowJo 7.6.1 software (Tree Star, Ashland, OR).
Statistical Analysis
The outcome variable s were e xpressed as mean ± SD.
SPSS (Student version 7.5, SPSS Inc., Chicago, IL) was
used for statistics. The independent samples t-test was
used to test the statistical difference between groups.
Correlation was analyzed by calculating a Pearson corre-
lation coefficient (r). P values < 0.05 were considered
statistically significant.
Results
ALDH1 mRNA expression
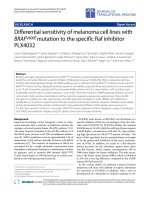
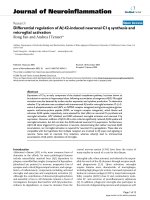
ALDH1 mRNA expression was significantly lower in
malignant ovarian tumors (n = 5) compared to normal
ovary (p < 0.001; n = 5) and benign ovarian tumors
(p = 0.008; n = 5) (Figure 1). There was no significant
difference in ALDH1 mRNA expression between normal
ovary and benign ovarian tumors (p = 0.18). The target
amplified gene was confirmed as ALDH1A1 [GenBank:
NM_000689.3] (data not shown).
ALDH1 protein expression and localization
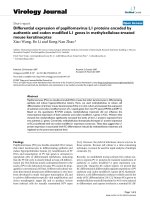
The proportion of ALDH1 immunostained cells was sig-
nificantly lower in malignant ovarian tumors (17.1 ±
7.6%; n = 5) compared to normal ovaries (37.4 ± 5.4%; p
= 0.001; n = 5) and benign ovarian tumors (31.0 ± 6.7%;
p = 0.015; n = 5) (Fi gure 2A). T here was no significant
Penumatsa et al. Journal of Ovarian Research 2010, 3:28
/>Page 4 of 13
difference between normal ovary and benign ovarian
tumors (p = 0.11), thus confirming the mRNA data. The
ALDH1 mRNA expression levels and the proportion of
immunostained cells was positively correlated (r = 0.7;
p < 0.01).
ALDH1 protein was detected as a single band at 55
kDa i n all of the ovarian tissues tested by Western blot
(Figure 2B). Densitometry analysis of the blots showed
lower levels of ALDH1 in malignant tumors compared
to normal ovary and benign tumors. Furthermore, a
higher ALDH1 band intensity was detected in a well dif-
ferentiated malignant tumor (lane 15; Figure 2B) com-
pared to poorly d ifferentiated tumors (lane 11 -14;
Figure 2B). A strong positive correlation was observed
between the levels of ALDH1 protein expression in
Western blot and proportion of ALDH1 immunostained
cells (r = 0.8; p < 0.01) among the tested samples.
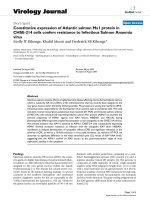
ALDH1 immunostaining was observed in various cell
types in normal ovary and serous ovarian tumors. In
normal ovary, a diffuse ALDH1 staining pattern was
observed in the stroma in fibroblasts-like cells and
fibrous tissue. In addition, the surface epithelial cells
stained intensely although there were occasional cells
without stain (Figure 3A and 3B). The smooth muscle
cells surrounding the blood vessels and the granulosa
cell layer surrounding developing foll icles did not stain
for ALDH1; however, the stromal cells in the perivascu-
lar regions and in the developing theca layer of follicles
showed ALDH1 staining (Figure 3C and 3D). The
fibrous tissue between cords of luteal cells in the
regressing corpus luteum (corpus albican s) also stained
for ALDH1 but not the cells of corpus luteum (Figure
3E and 3F).
The staining pattern of ALDH1 in uninvolved areas
adjacent to benign serous ovarian tumors was similar to
that of normal ovary (Figure 4A). In contrast to normal
ovary, strong ALDH1 expression was observed near
some neo-angiogenic blood vessels in benign ovarian
tumors (Figure 4C). In additio n, staining of the surface
epithelium was patchy compared to normal ovary (Fig-
ure 3A) and contained areas of intense staining adjacent
to areas of no staining (Figure 4D - 4F).
In malignant serous ovarian tumors ALDH1 staining
varied (strong to weak or no staining; Figure 5) and was
seen primarily in the fibroblast like cells in the stroma
and a few well differentiated tumor epithelial cells
(Figure 5B). Well differentiated malignant tumor cells
(Figure 5A - 5B) showed higher ALDH1 expression
compared to poorly differentiated t umor cells (Figure
5C - 5F). Interestingly, ALDH1 staining differed in the
same malignant tumor tissue based on cell ular differen-
tiation (Figure 6). Poorly differentiat ed regions of solid
tumor cell nests (Figure 6B and 6C) had little or no
ALDH1 expression compared to the adjacent, highly
stained differentiated regions with micro-papillary tumor
architecture (Figure 6A and 6B).
To further invest igate ALDH1 expression in high
grade malignant serous ovarian tumors, sections were
co-stained with CD44, CD117 and CD133 to determine
if there was an association with CSC markers (Figure 7).
2.0
1.5
1.0
.5
0.0
ALDH1 mRNA relative expression
Normal
ovar
y
Benign
tumor ovar
y
Malignant
tumor ovar
y
Figure 1 ALDH1 mRNA expression differs among normal ovary, benign tumors and malignant tumors. AL DH1 mRNA levels determined
by qRT-PCR were significantly lower in malignant tumors than in normal ovary and benign tumors. ALDH1 mRNA did not significantly differ
between benign tumors and normal ovary. Values for ALDH1 were normalized to actin as an internal control. The boxplots represent the median
(dark horizontal line), range (whiskers), and 25th-75th percentile (box) for each group (n = 5/group).
Penumatsa et al. Journal of Ovarian Research 2010, 3:28
/>Page 5 of 13
(
A
)
50
40
30
20
10
0
(B)
% ALDH1 Immunoreactive Cells
Relative density
Normal
ovary
Benign
tumor ovary
Malignant
tumor ovary
ALDH1
ȕ-acti
n
Normal ovary
Benign
tumor ovar
y
Malignant
tumor ovary
rALDH1
Figure 2 ALDH1 protei n expression differs among normal ovary, benign tu mors and malignant tumors.[A]ThenumberofALDH
expressing cells was significantly lower in malignant tumors than in normal ovary and benign tumors. The boxplots represent the median (dark
horizontal line), range (whiskers), and 25th-75th percentile (box) for each group (n = 5/group). Quantification of ALDH1+ cells was performed
using StereoInvestigator software. [B] Protein was detected in tissue homogenates by Western blot (10 μg protein/lane). A single
immunoreactive band reacted with mouse anti-ALDH1 (upper panel). Recombinant ALDH1 (1 μg; lane 16) was used as a positive control. Human
actin was used as a loading control (lower panel). Densitometry analysis confirmed differential ALDH1 protein expression in ovarian tissues. Each
sample was plotted on Y-axis as ratio of the relative density of ALDH1 normalized to actin.
Penumatsa et al. Journal of Ovarian Research 2010, 3:28
/>Page 6 of 13
ALDH1 and CSC markers were expressed in different
cell populations. CD44 was expressed in lymphocytes in
and near blood vessels as expected. CD117 (Figure 7C
&7D) and CD133 (Fig ure 7E &7F) expression was loca-
lized in tumor epithelial cells while ALDH1 immunos-
taining occurred in the tumor stroma. We evaluated
sections from 3 poorly differentiated malignant ovarian
tumors and found occasional cells (< 1%) that were
co-stained with ALDH1 and CD44. However, it is not
clear whether they were tumor cells or infiltrating lym-
phocytes. We did not find any visible co-staining with
ALDH1 and CD117 or CD133 markers.
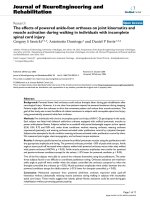
ALDH1 enzyme activity in ovarian cells
The mean fluorescence intensity (MFI) was signifi-
cantly decreased in malignant ovarian tumors (15 ± 8.8
MFI; n = 3) compared to normal ovary (92.3 ± 24
MFI; p = 0.02; n = 3) and benign ovarian tumors (74 ±
18.7 MFI; p = 0.018; n = 3) (Figure 8). While no signif-
icant difference in MFI was observed between normal
ovary and benign tumo rs (p = 0.3). In addition, the
proportion of ALDH
Bright
cells was lower in malignant
ovarian tumors (6.4 ± 2.9%) compared to normal ovary
(22.8 ± 6.4%) and benign tumors (16.3 ± 5.6%). The
ALDEFLUOR assay was positively correlated with the
proportion of cells expressing ALDH1 by semi-quanti-
tative immunohistochemistry (r = 0.77; p < 0.01).
Overall, the estimation of enzyme activity in ovarian
cells was consistent with ALDH1 mRNA and protein
expression levels.
Discussion
In summary, the ALDH1 expression and enzyme activity
was lower in malignant ovarian tumors compared to
BV
F
S
SE
CA
S
S
A
B
C
D
E F
SMC
Figure 3 Immunohistochemical localization of ALDH1 in normal ovaries. [A-B] Intens e staining of numerous cells of stroma (S) and surface
epithelial cells (SE) was observed in normal ovary. Insets showing examples of ALDH1 stained stromal and epithelial cells and an example of an
occasional unstained epithelial cell at high magnification (×1000). [C] ALDH1 staining was absent in smooth muscle cells (SMC; dotted outline)
surrounding blood vessel (BV) and [D] in the granulosa cell layer (black arrow) lining follicles (F). However, the theca layer (dotted arrow) and
neighboring stromal cells (S) expressed ALDH1. [E-F] Representative images of ALDH1 stained cells (arrow; fibroblast like cells) within the corpus
albicans (CA). Sections were counterstained with hematoxylin. (Original magnifications: ×200, ×400, ×400, ×400, ×100 and ×400 respectively).
Penumatsa et al. Journal of Ovarian Research 2010, 3:28
/>Page 7 of 13
normal ovary, while benign ovarian tumors exhibited
expression levels slightly lower but similar to normal
ovaries. This is strikingly different than in breast, lung
or colon cancers in which ALDH1 expression is limited
in the normal tissue but is significantly increased in
malignant tissue [8,10,36].
Our results are consistent with studies using g ene
expression microarrays which showed that the ALDH1A1
gene was down-regulated in malignant ovarian tumors
compared to benign ovarian tumors [41,42] or to nor-
mal ovary [43,44]. This is the first report which com-
pares ALDH1 expression and enzyme activity in normal
ovary and serous ovarian tumors in one study. ALDH1
was localized in surface epithelial cells and stroma in
the cortical and medullary regions of normal ovary and
was not evident within follicles or blood vessel endothe-
lial cells. The widespread and high expression in normal
ovary is consistent with studies which suggest that
ALDH1 has an obligatory functional role in normal
ovarian physiology. [27,28]
The ALDH1 protein expression and enzyme activity
were correlated. However, the proportion of ALDE-
FLUOR positive cells (ALDH
Bright
) was smaller than the
proportion of ALDH1 immunostained cells s uggesting
that not all ALDH1 may be active. This was also
observed by Deng et al. [7].
Our study also shows for the first time that ALDH1
expression in malignant serous ovarian tumors is het-
erogeneous and the localization appears t o be based on
the level of cellular differentiation. It is known that
patients with well differentiated (low-grade) malignant
ovarian tumors have a higher survival rate than patients
with less differentiated (high-grade) tumors [45].
ALDH1 staining was substantially lower in less differen-
tiated tumor cells compared to differentiated tumor
cells. Since the degree of morphological differentiation
is associated with malignant potential, this s uggests a
potential relationship to clinical outcomes. The higher
expression of ALDH1 in benign tumors without malig-
nant potential is congruent with this observation. It is
also interesting to note that low-grade tumors show
poor responses to chemotherapy compared to high-
grade tumors [ 46]. This is thought to be due to more
rapid metabolism of chemotherapeutics which could be
correlated with our observation of higher ALDH1
expression in low- grade tumors. Thus, further studies
S
S
SE
BV
S
B
D E
F
Control
A
C
Figure 4 Immunohistochemical localization of ALDH1 in benign serous ovarian tumors. [A] Uninvolved regions adjacent to benign tumors
have a similar staining pattern as normal ovary. [B] Intense staining was observed in stromal (S) and surface epithelial (SE) cells of benign tumors.
The inset shows a primary antibody control (anti-ALDH1 omitted). [C] The ALDH1 staining pattern surrounding neo-angiogenic blood vessels
(arrow) in a benign tumor ovary differs from normal ovary. [D] Discontinuous pattern of ALDH1 expression was observed along the surface
epithelium of benign tumor projections. [E] ALDH1 staining was predominantly expressed in surface epithelial cells of serous papillary projections
with less apparent staining of stroma compared to uninvolved areas adjacent to benign tumors. [F] A representative example from the same
tissue sample as in E with little or no ALDH1 expression. Sections were counterstained with hematoxylin. (Original magnifications: ×200, ×400,
×400, ×200, ×400 and ×400 respectively).
Penumatsa et al. Journal of Ovarian Research 2010, 3:28
/>Page 8 of 13
are warranted to assess the possibility that ALDH1
expression could be used in pathology evaluation of tis-
sue histology to predict disease prognosis and response
to chemotherapy in ovarian cancer.
Previous studies showed that higher ALDH1 expres-
sion in tumor c ells is associated with poor clinical out-
comes in breast, [36,47] lung, [10,48] colon [8] cancer
patients. However, Chang et al. reported that higher
ALDH1 e xpression in tumor cells was correlated with a
favorable patient prognosis in ovarian cancer [24]. They
examined the relationship of ALDH1 levels to survival
in ovarian cancer patients and did not analyze the histo-
logical subtypes o f ovarian tumors s eparately. In
contrast, Deng et al. observed that a relatively high
number of ALDH1 exp ressing tumor cells in malignant
serous ovarian tumors was correlated with poor survival
[7]. These contrasting clinical outcome observations in
ovarian cancer could be due to a number of factors
including differences in cell counting methodology and
differences in the tumor types in the study groups.
Although we did not examine the relationship of
ALDH1 to survival (the data was not available), the
association of very low or no ALDH1 expression with
poorly differentiated tumors is consistent with the con-
cept that los s of ALDH1 is associated with an aggressive
tumor type. This is also consistent with our finding that
A B
C D
E
F
Figure 5 Immunohistochemical localization of ALDH1 in malignant serous ovarian tumors. ALDH1 expression was heterogeneous in
malignant tumors. [A-B] A well differentiated tumor showing ALDH1 expression in numerous cells of epithelium and stroma with varying
staining intensities (black arrows) or no staining (white arrow). Note: the nuclei are small, regular and lack prominent nucleoli, which is
characteristic of a low grade tumor. [C-D] A poorly differentiated tumor showing absence of ALDH1 expression in tumor epithelial cells (white
arrows). A few adjacent tumor stromal cells (black arrow) expressed ALDH1. [E-F] Representative images of ALDH1 staining in a poorly
differentiated tumor. Characteristic tumor cells with activated nucleus (white arrow) show no ALDH1 expression, while adjacent stromal tissue
contained few ALDH1+ cells (black arrow). Sections were counterstained with hematoxylin. (Original magnifications: ×100, ×400, ×100, ×400,
×100 and ×400 respectively).
Penumatsa et al. Journal of Ovarian Research 2010, 3:28
/>Page 9 of 13
D
P
D
P
A
B
C
Figure 6 Expression of ALDH1 was absent in regions with poorly differentiat ed tumor cell morphology while adjacent differentiated
regions were highly stained. [A] Numerous cells expressed ALDH1 in differentiated tumor regions (D) with micro-papillary architecture. [B]
Representative section with adjacent areas showing strikingly different ALDH1 expression in differentiated and poorly differentiated regions. [C]
Reduced or absent ALDH1 expressing cells in poorly differentiated regions (P) with solid tumor cell nests. Sections were counterstained with
hematoxylin. (Original magnifications: ×200, ×100 and ×200 respectively).
ALDH1
CD44
ALDH1
CD117
ALDH1
CD133
A
B
C
D
E
F
Figure 7 ALDH1 and cancer stem cell (CSC) markers are expressed i n different cell populations in malignant ovarian tumors.[A-B]
shows ALDH1 (brown) and CD44 (black) immunostaining in different cells in the tumor stroma. Representative image showing CD44+ cells
(presumptively blood cells) primarily localized in or near blood vessels (dotted line). [C-D] shows localization of ALDH1 (brown) and CD117
(black) immunostaining in different cells. CD117+ cells were exclusively localized in the tumor epithelium. [E-F] shows ALDH1 (brown) and
CD133 (black) immunostaining in different cells. CD133+ cells were localized to the tumor apical surface of epithelial cells in discontinuous
patches of stained (solid arrows) and adjacent unstained cells (dotted arrows). Sections were not counterstained. (Original magnifications: ×200,
×400, ×200, ×400, ×200 and ×400 respectively).
Penumatsa et al. Journal of Ovarian Research 2010, 3:28
/>Page 10 of 13
ALDH1 expression in benign serous tumors (without
malignant potential) is similar to normal ovary. Thus,
our conclusion is similar to Chang et al., [24] even
though our study was restricted to serous ovar ian
tumors similar to Deng et al. [7]. Another design differ-
ence among the three studies was that in our study we
tabulated total ALDH1 immunostained cells, whereas
stromal immunostaining of ALDH1 was excluded in the
other studies. A s trength of our study is that ALDH1
expression was evaluated using three analytical method s
and used immun ohistochemis try to demon strate differ-
ences in ALDH1 distribution.
Recent observations s uggest ALDH1 is a marker for
CSCs in various malignancies and that ALDH1 in CSCs
is associated with chemoresistance and increased malig-
nant potential [7-9,36,37,47,48]. Chute et al. demon-
strated that ALDH1 enzyme activity is necessary for
human hematopoietic stem cell (HSC) differentiation,
and inhibition of this enzyme results in expansion of
HSCs [49]. In solid tumors the identity of CSCs [50]
and the role of ALDH1 is less clear [51]. Stem cells in
the human ovary are involved in ovarian development,
normal function and it has been suggested they have a
role in pathological conditions such as infertility and
ovarian cancer [52,53]. Putative CSCs isolated from
ovarian cancer cell lines [54], ascites [54,55] and primary
ovarian tumor tissues [56-58] displayed CSC growth
characteristics. Emerging evidence in ovarian cancer
sugg ests that cells expressing CD44, [56,57] CD117 [57]
or CD133 [58] cell-surface markers have CSC proper-
ties. However, the identification of CSC and their mole-
cular characteristics, as well as the clinical significance
of an ovarian CSC phenotype is not yet clear. We found
that ALDH1 appears to be expressed in different cell
populatio ns than CD44, CD117 and CD133. However, a
caveat is that we did not examine the entire tumor since
parts of the tumor are retained by the pat hologist for
diagnostic evaluation. Thus it is possible that the
CSCmightbeinanotherareaofthetumorthatwas
not sampled. In preliminary studies we examined
ABC
D
E
F
GHI
Figure 8 Flow cytometry analysis of normal ovarian cells, benign and malignant tumor c ells with ALDEFLUOR.TheALDH1enzyme
activity was calculated as a difference (Δ) in mean fluorescence intensity (MFI). The background in the presence of the ALDH1 inhibitor DEAB
(shaded gray) was subtracted from the mean fluorescence intensity of cells incubated with ALDEFLUOR alone (black line) for each cell
preparation. Normal ovarian cells (A-C; Δ = 92.3 ± 24 MFI) and benign tumor cells (D-F; Δ = 74 ± 18.7 MFI) show higher ALDH1 enzyme activity
than malignant tumor cells (G-I; Δ = 15 ± 8.8 MFI) as depicted in the overlay histogram plots.
Penumatsa et al. Journal of Ovarian Research 2010, 3:28
/>Page 11 of 13
co-expression of ALDH1 and the CSC markers by f low
cytometry and did not find a consistent patter n of asso-
ciation. Although we cannot conclude that ovarian
CSCs do not contain ALDH1, this initial examination
suggests differences from other solid tumors [8,36,37].
Thus, our findings and previous studies suggest that
ALDH1 may not be a n ideal mark er for isola ting CSCs
in ovarian cancer. Howeve r, these findings remain to be
confirmed.
Conclusions
We found that the total ALDH1 expression is signifi-
cantly reduced in malignant serous ovarian tumors com-
paredtonormalovariesandthatexpressioninbenign
serous ovarian tumors is similar to normal ovary.
ALDH1 was expressed in malignant tumor cells but at a
low level and was absent in the more aggressive poorly
differentiated malignant tumor cells. The heterogeneity
of ALDH1 expression pattern suggests ALDH1 could be
used as a novel indicator of prognosis and possibly as
an indicator of responses to chemotherapy. Further
investigation could facilitate understanding the role of
ALDH1 in the ovary and ovarian tumors.
Acknowledgements
The authors acknowledge Drs. Jacob Rotmensch and Alfred Guirguis of the
Department of Obstetrics and Gynecology for their contribution in tissue
collection and thank Jessica Drope for consenting and enrolling patients for
the study. The authors thank Drs. Jeffrey Kordower and Yaping Chu of the
Department of Neuroscience for their assistance and discussions on the use
of StereoInvestigator to count cells. The authors also thank Dr. Amanda
Marzo, Nadine Lerret and Jeffrey Martinson of the Flow cytometry Core
Facility for their help and discussions. Supported by NIH R01AI 055060-01
(JL), NIH R01CA134487 (IH & JL), DOD OC073325 (JL), SPORE P50CA83636
Development Award (JL), Rush University Segal award (JL) and Prevent
Cancer Foundation (AB).
Author details
1
Pharmacology, Rush University Medical Center, 1735 W Harrison Street,
Chicago, IL 60612, USA.
2
Pathology Rush University Medical Center, 1735 W
Harrison Street, Chicago, IL 60612, USA.
3
Obstetrics & Gynecology, Rush
University Medical Center, 1735 W Harrison Street, Chicago, IL 60612, USA.
Authors’ contributions
KP, JL and SE worked to develop the experimental design. KP performed the
experiments, statistical calculations and wrote the manuscript. SE facilitated
the PCR and gene sequencing, and assisted KP in data analysis. AB
developed the immunohistochemistry (IHC) protocols, facilitated tissue
collection and assisted in writing the manuscript. MB assisted with tissue
collection and IHC tissue processing. JL conceived the study, mentored KP
in scientific methods and data analysis and assisted in drafting and finalizing
the manuscript. All authors approved the final version of the manuscript.
Competing interests
The authors declare that they have no competing interests.
Received: 13 September 2010 Accepted: 22 December 2010
Published: 22 December 2010
References
1. Edassery SL, Shatavi SV, Kunkel JP, Hauer C, Brucker C, Penumatsa K, Yu Y,
Dias JA, Luborsky JL: Autoantigens in ovarian autoimmunity associated
with unexplained infertility and premature ovarian failure. Fertil Steril
2010, 94:2636-41.
2. Luborsky J, Seby L. Edassery, Krishna Penumatsa, Michael Bradaric, Yi Yu,
Karl Erik Hellstrom, Animesh Barua, Pincas Bitterman, Hellstrom I: Common
autoantibodies in ovarian cancer (OvCa) and infertility may define
biomarkers for OvCa risk. Proceedings of the 101st Annual Meeting of the
American Association for Cancer Research, Washington, DC Philadelphia (PA)
2010.
3. Vasiliou V, Nebert DW: Analysis and update of the human aldehyde
dehydrogenase (ALDH) gene family. Hum Genomics 2005, 2:138-143.
4. Sladek NE: Human aldehyde dehydrogenases: potential pathological,
pharmacological, and toxicological impact. J Biochem Mol Toxicol 2003,
17:7-23.
5. Marchitti SA, Brocker C, Stagos D, Vasiliou V: Non-P450 aldehyde oxidizing
enzymes: the aldehyde dehydrogenase superfamily. Expert Opin Drug
Metab Toxicol 2008, 4:697-720.
6. Visus C, Ito D, Amoscato A, Maciejewska-Franczak M, Abdelsalem A, Dhir R,
Shin DM, Donnenberg VS, Whiteside TL, DeLeo AB: Identification of
human aldehyde dehydrogenase 1 family member A1 as a novel CD8+
T-cell-defined tumor antigen in squamous cell carcinoma of the head
and neck. Cancer Res 2007, 67:10538-10545.
7. Deng S, Yang X, Lassus H, Liang S, Kaur S, Ye Q, Li C, Wang LP, Roby KF,
Orsulic S, et al: Distinct expression levels and patterns of stem cell
marker, aldehyde dehydrogenase isoform 1 (ALDH1), in human
epithelial cancers. PLoS One 5:e10277.
8. Huang EH, Hynes MJ, Zhang T, Ginestier C, Dontu G, Appelman H, Fields JZ,
Wicha MS, Boman BM: Aldehyde dehydrogenase 1 is a marker for normal
and malignant human colonic stem cells (SC) and tracks SC
overpopulation during colon tumorigenesis. Cancer Res 2009,
69:3382-3389.
9. Li T, Su Y, Mei Y, Leng Q, Leng B, Liu Z, Stass SA, Jiang F: ALDH1A1 is a
marker for malignant prostate stem cells and predictor of prostate
cancer patients’ outcome. Lab Invest 90:234-244.
10. Patel M, Lu L, Zander DS, Sreerama L, Coco D, Moreb JS: ALDH1A1 and
ALDH3A1 expression in lung cancers: correlation with histologic type
and potential precursors. Lung Cancer 2008, 59:340-349.
11. Duester G, Mic FA, Molotkov A: Cytosolic retinoid dehydrogenases govern
ubiquitous metabolism of retinol to retinaldehyde followed by tissue-
specific metabolism to retinoic acid. Chem Biol Interact 2003, 143-
144:201-210.
12. De Luca LM: Retinoids and their receptors in differentiation,
embryogenesis, and neoplasia. FASEB J 1991, 5:2924-2933.
13. Caliaro MJ, M armouget C, Guicha rd S, Mazars P, Valette A, Moisand A,
Bugat R, Jozan S: Response of four human ovarian carcinoma cell
lines to all-trans retinoic acid: relationship with i nduction of
differentiation and retinoic acid receptor expression. Int J Cancer
1994, 56:743-748.
14. Zhang D, Holmes WF, Wu S, Soprano DR, Soprano KJ: Retinoids and
ovarian cancer. J Cell Physiol 2000, 185:1-20.
15. Napoli JL: Biochemical pathways of retinoid transport,
metabolism, and signal transduction. Clin Immunol Immunopathol
1996, 80:S52-62.
16. Aebi S, Kroning R, Cenni B, Sharma A, Fink D, Los G, Weisman R, Howell SB,
Christen RD: all-trans retinoic acid enhances cisplatin-induced apoptosis
in human ovarian adenocarcinoma and in squamous head and neck
cancer cells. Clin Cancer Res 1997, 3:2033-2038.
17. De Palo G, Veronesi U, Camerini T, Formelli F, Mascotti G, Boni C, Fosser V,
Del Vecchio M, Campa T, Costa A, et al: Can fenretinide protect women
against ovarian cancer? J Natl Cancer Inst 1995, 87:146-147.
18. Cvetkovic D, Williams SJ, Hamilton TC: Loss of cellular retinol-binding
protein 1 gene expression in microdissected human ovarian cancer. Clin
Cancer Res 2003, 9:1013-1020.
19. Kang SG, Lim HW, Andrisani OM, Broxmeyer HE, Kim CH: Vitamin A
metabolites induce gut-homing FoxP3+ regulatory T cells. J Immunol
2007, 179:3724-3733.
20. Yokota A, Takeuchi H, Maeda N, Ohoka Y, Kato C, Song SY, Iwata M: GM-
CSF and IL-4 synergistically trigger dendritic cells to acquire retinoic
acid-producing capacity. Int Immunol 2009, 21:361-377.
21. Manicassamy S, Pulendran B: Retinoic acid-dependent regulation of
immune responses by dendritic cells and macrophages. Semin Immunol
2009, 21:22-27.
Penumatsa et al. Journal of Ovarian Research 2010, 3:28
/>Page 12 of 13
22. Moreb JS, Baker HV, Chang LJ, Amaya M, Lopez MC, Ostmark B, Chou W:
ALDH isozymes downregulation affects cell growth, cell motility and
gene expression in lung cancer cells. Mol Cancer 2008, 7:87.
23. Moreb JS, Zucali JR, Ostmark B, Benson NA: Heterogeneity of aldehyde
dehydrogenase expression in lung cancer cell lines is revealed by
Aldefluor flow cytometry-based assay. Cytometry B Clin Cytom 2007,
72:281-289.
24. Chang B, Liu G, Xue F, Rosen DG, Xiao L, Wang X, Liu J: ALDH1 expression
correlates with favorable prognosis in ovarian cancers. Mod Pathol 2009,
22:817-823.
25. Park SY, Lee HE, Li H, Shipitsin M, Gelman R, Polyak K: Heterogeneity for
stem cell-related markers according to tumor subtype and histologic
stage in breast cancer. Clin Cancer Res 16:876-887.
26. Deng L, Shipley GL, Loose-Mitchell DS, Stancel GM, Broaddus R, Pickar JH,
Davies PJ: Coordinate regulation of the production and signaling of
retinoic acid by estrogen in the human endometrium. J Clin Endocrinol
Metab 2003, 88:2157-2163.
27. Clagett-Dame M, DeLuca HF: The role of vitamin A in mammalian
reproduction and embryonic development. Annu Rev Nutr 2002,
22:347-381.
28. Vermot J, Fraulob V, Dolle P, Niederreither K: Expression of enzymes
synthesizing (aldehyde dehydrogenase 1 and reinaldehyde
dehydrogenase 2) and metabolizaing (Cyp26) retinoic acid in the mouse
female reproductive system. Endocrinology 2000, 141:3638-3645.
29. Mark M, Ghyselinck NB, Chambon P: Function of retinoic acid receptors
during embryonic development. Nucl Recept Signal 2009, 7:e002.
30. Stewart MJ, Malek K, Crabb DW: Distribution of messenger RNAs for
aldehyde dehydrogenase 1, aldehyde dehydrogenase 2, and aldehyde
dehydrogenase 5 in human tissues. J Investig Med 1996, 44:42-46.
31. Alnouti Y, Klaassen CD: Tissue distribution, ontogeny, and regulation of
aldehyde dehydrogenase (Aldh) enzymes mRNA by prototypical
microsomal enzyme inducers in mice. Toxicol Sci 2008, 101:51-64.
32. Coussens LM, Werb Z: Inflammation and cancer. Nature 2002, 420:860-867.
33. Rae MT, Niven D, Ross A, Forster T, Lathe R, Critchley HO, Ghazal P,
Hillier SG: Steroid signalling in human ovarian surface epithelial cells: the
response to interleukin-1alpha determined by microarray analysis. J
Endocrinol 2004, 183:19-28.
34. Tanner B, Hengstler JG, Dietrich B, Henrich M, Steinberg P, Weikel W,
Meinert R, Kaina B, Oesch F, Knapstein PG: Glutathione, glutathione S-
transferase alpha and pi, and aldehyde dehydrogenase content in
relationship to drug resistance in ovarian cancer. Gynecol Oncol 1997,
65:54-62.
35. Hess DA, Meyerrose TE, Wirthlin L, Craft TP, Herrbrich PE, Creer MH,
Nolta JA: Functional characterization of highly purified human
hematopoietic repopulating cells isolated according to aldehyde
dehydrogenase activity. Blood
2004, 104:1648-1655.
36. Ginestier C, Hur MH, Charafe-Jauffret E, Monville F, Dutcher J, Brown M,
Jacquemier J, Viens P, Kleer CG, Liu S, et al: ALDH1 is a marker of normal
and malignant human mammary stem cells and a predictor of poor
clinical outcome. Cell Stem Cell 2007, 1:555-567.
37. Ma S, Chan KW, Lee TK, Tang KH, Wo JY, Zheng BJ, Guan XY: Aldehyde
dehydrogenase discriminates the CD133 liver cancer stem cell
populations. Mol Cancer Res 2008, 6:1146-1153.
38. Cheng WF, Huang CY, Chang MC, Hu YH, Chiang YC, Chen YL, Hsieh CY,
Chen CA: High mesothelin correlates with chemoresistance and poor
survival in epithelial ovarian carcinoma. Br J Cancer 2009, 100:1144-1153.
39. West MJ: New stereological methods for counting neurons. Neurobiol
Aging 1993, 14:275-285.
40. Gundersen HJ, Jensen EB: The efficiency of systematic sampling in
stereology and its prediction. J Microsc 1987, 147:229-263.
41. Warrenfeltz S, Pavlik S, Datta S, Kraemer ET, Benigno B, McDonald JF: Gene
expression profiling of epithelial ovarian tumours correlated with
malignant potential. Mol Cancer 2004, 3:27.
42. Biade S, Marinucci M, Schick J, Roberts D, Workman G, Sage EH, O’Dwyer PJ,
Livolsi VA, Johnson SW: Gene expression profiling of human ovarian
tumours. Br J Cancer 2006, 95:1092-1100.
43. Ismail RS, Baldwin RL, Fang J, Browning D, Karlan BY, Gasson JC, Chang DD:
Differential gene expression between normal and tumor-derived ovarian
epithelial cells. Cancer Res 2000, 60:6744-6749.
44. Santin AD, Zhan F, Bellone S, Palmieri M, Cane S, Bignotti E, Anfossi S,
Gokden M, Dunn D, Roman JJ, et al: Gene expression profiles in primary
ovarian serous papillary tumors and normal ovarian epithelium:
identification of candidate molecular markers for ovarian cancer
diagnosis and therapy. Int J Cancer 2004, 112:14-25.
45. Grunt TW, Somay C, Pavelka M, Ellinger A, Dittrich E, Dittrich C: The effects
of dimethyl sulfoxide and retinoic acid on the cell growth and the
phenotype of ovarian cancer cells. J Cell Sci 1991, 100(Pt 3):657-666.
46. Shih Ie M, Kurman RJ: Ovarian tumorigenesis: a proposed model based
on morphological and molecular genetic analysis. Am J Pathol 2004,
164:1511-1518.
47. Croker AK, Goodale D, Chu J, Postenka C, Hedley BD, Hess DA, Allan AL:
High aldehyde dehydrogenase and expression of cancer stem cell
markers selects for breast cancer cells with enhanced malignant and
metastatic ability. J Cell Mol Med 2009, 13:2236-2252.
48. Jiang F, Qiu Q, Khanna A, Todd NW, Deepak J, Xing L, Wang H, Liu Z, Su Y,
Stass SA, Katz RL:
Aldehyde dehydrogenase 1 is a tumor stem cell-
associated marker in lung cancer. Mol Cancer Res 2009, 7:330-338.
49. Chute JP, Muramoto GG, Whitesides J, Colvin M, Safi R, Chao NJ,
McDonnell DP: Inhibition of aldehyde dehydrogenase and retinoid
signaling induces the expansion of human hematopoietic stem cells.
Proc Natl Acad Sci USA 2006, 103:11707-11712.
50. Welte Y, Adjaye J, Lehrach HR, Regenbrecht CR: Cancer stem cells in solid
tumors: elusive or illusive? Cell Commun Signal 2010, 8:6.
51. Neumeister V, Rimm D: Is ALDH1 a good method for definition of breast
cancer stem cells? Breast Cancer Res Treat 2010, 123:109-11.
52. Bukovsky A, Caudle MR, Virant-Klun I, Gupta SK, Dominguez R, Svetlikova M,
Xu F: Immune physiology and oogenesis in fetal and adult humans,
ovarian infertility, and totipotency of adult ovarian stem cells. Birth
Defects Res C Embryo Today 2009, 87:64-89.
53. Tilly JL, Rueda BR: Minireview: stem cell contribution to ovarian
development, function, and disease. Endocrinology 2008, 149:4307-4311.
54. Szotek PP, Pieretti-Vanmarcke R, Masiakos PT, Dinulescu DM, Connolly D,
Foster R, Dombkowski D, Preffer F, Maclaughlin DT, Donahoe PK: Ovarian
cancer side population defines cells with stem cell-like characteristics
and Mullerian Inhibiting Substance responsiveness. Proc Natl Acad Sci
USA 2006, 103:11154-11159.
55. Bapat SA, Mali AM, Koppikar CB, Kurrey NK: Stem and progenitor-like cells
contribute to the aggressive behavior of human epithelial ovarian
cancer. Cancer Res 2005, 65:3025-3029.
56. Alvero AB, Chen R, Fu HH, Montagna M, Schwartz PE, Rutherford T,
Silasi DA, Steffensen KD, Waldstrom M, Visintin I, Mor G: Molecular
phenotyping of human ovarian cancer stem cells unravels the
mechanisms for repair and chemoresistance. Cell Cycle 2009, 8:158-166.
57. Zhang S, Balch C, Chan MW, Lai HC, Matei D, Schilder JM, Yan PS,
Huang TH, Nephew KP: Identification and characterization of ovarian
cancer-initiating cells from primary human tumors. Cancer Res 2008,
68:4311-4320.
58. Curley MD, Therrien VA, Cummings CL, Sergent PA, Koulouris CR, Friel AM,
Roberts DJ, Seiden MV, Scadden DT, Rueda BR, Foster R: CD133 Expression
Defines a Tumor Initiating Cell Population in Primary Human Ovarian
Cancer. Stem Cells 2009.
doi:10.1186/1757-2215-3-28
Cite this article as: Penumatsa et al.: Differential expression of aldehyde
dehydrogenase 1a1 (ALDH1) in normal ovary and serous ovarian
tumors. Journal of Ovarian Research 2010 3:28.
Submit your next manuscript to BioMed Central
and take full advantage of:
• Convenient online submission
• Thorough peer review
• No space constraints or color figure charges
• Immediate publication on acceptance
• Inclusion in PubMed, CAS, Scopus and Google Scholar
• Research which is freely available for redistribution
Submit your manuscript at
www.biomedcentral.com/submit
Penumatsa et al. Journal of Ovarian Research 2010, 3:28
/>Page 13 of 13