báo cáo hóa học:" HIV/AIDS, growth and poverty in KwaZulu-Natal and South Africa: an integrated survey, demographic and economy-wide analysis" potx
Bạn đang xem bản rút gọn của tài liệu. Xem và tải ngay bản đầy đủ của tài liệu tại đây (332.06 KB, 13 trang )
BioMed Central
Page 1 of 13
(page number not for citation purposes)
Journal of the International AIDS
Society
Open Access
Research
HIV/AIDS, growth and poverty in KwaZulu-Natal and South Africa:
an integrated survey, demographic and economy-wide analysis
James Thurlow
1,2
, Jeff Gow*
3,4
and Gavin George
5
Address:
1
International Food Policy Research Institute, Washington DC, USA,
2
Department of Economics, University of Copenhagen,
Copenhagen, Denmark,
3
School of Accounting, Economics and Finance, University of Southern Queensland, Toowoomba, Australia,
4
Health
Economics and HIV/AIDS Research Division (HEARD), University of KwaZulu-Natal, Durban, South Africa and
5
HEARD, University of KwaZulu-
Natal, Durban, South Africa
Email: James Thurlow - ; Jeff Gow* - ; Gavin George -
* Corresponding author
Abstract
Background: This paper estimates the economic impact of HIV/AIDS on the KwaZulu-Natal
province and the rest of South Africa.
Methods: We extended previous studies by employing: an integrated analytical framework that
combined firm surveys of workers' HIV prevalence by sector and occupation; a demographic model
that produced both population and workforce projections; and a regionalized economy-wide
model linked to a survey-based micro-simulation module. This framework permits a full macro-
microeconomic assessment.
Results: Results indicate that HIV/AIDS greatly reduces annual economic growth, mainly by
lowering the long-run rate of technical change. However, impacts on income poverty are small, and
inequality is reduced by HIV/AIDS. This is because high unemployment among low-income
households minimises the economic costs of increased mortality. By contrast, slower economic
growth hurts higher income households despite lower HIV prevalence.
Conclusion: We conclude that the increase in economic growth that results from addressing HIV/
AIDS is sufficient to offset the population pressure placed on income poverty. Moreover, incentives
to mitigate HIV/AIDS lie not only with poorer infected households, but also with uninfected higher
income households.
Our findings reveal the substantial burden that HIV/AIDS places on future economic development
in KwaZulu-Natal and South Africa, and confirms the need for policies to curb the economic costs
of the pandemic.
Background
South Africa has one of the highest HIV prevalence rates
in the world, and KwaZulu-Natal (KZN) is its worst
afflicted province. Recent estimates indicate that 26.4% of
KZN's working age population is HIV positive, compared
to 15.9% in the rest of the country [1]. Unemployment
and income poverty in the province are also much higher
than the national average. More than a third of KZN's
population live below the US$2 a day poverty line and
two-fifths of the workforce is unemployed [2,3].
Published: 16 September 2009
Journal of the International AIDS Society 2009, 12:18 doi:10.1186/1758-2652-12-18
Received: 17 July 2009
Accepted: 16 September 2009
This article is available from: />© 2009 Thurlow et al; licensee BioMed Central Ltd.
This is an Open Access article distributed under the terms of the Creative Commons Attribution License ( />),
which permits unrestricted use, distribution, and reproduction in any medium, provided the original work is properly cited.
Journal of the International AIDS Society 2009, 12:18 />Page 2 of 13
(page number not for citation purposes)
Long-term trends in KZN are equally bleak. Recent evi-
dence indicates that economic growth continues to lag
behind the rest of the country, and that poverty is rising
faster than in other provinces. Therefore, a key challenge
for reviving economic development in South Africa, and
in KZN in particular, is to understand the constraints
imposed by HIV/AIDS on future economic growth and
poverty reduction.
Numerous studies estimate the micro-level impacts of the
pandemic (see [4] for an overview). These confirm the
severe detrimental effects imposed on infected individuals
and their households. However, while household-based
studies are better able to capture detailed non-economic
impacts, they typically overlook systemic or economy-
wide shocks from HIV/AIDS. These can have indirect or
"second-round" consequences for both infected and unin-
fected population groups. Some studies have assessed the
broader implications of HIV/AIDS for economic growth
and employment in South Africa (see, for example, [5]).
However, these macroeconomic studies were conducted
when detailed micro-level data on prevalence rates for dif-
ferent sectors and occupations were not yet available. This
information on HIV prevalence among firms and workers
permits a more accurate assessment of the consequences
of the pandemic. Moreover, the availability of these
micro-level estimates allows for more integrated
approaches to measuring socioeconomic outcomes.
In this paper, we estimate the growth and distributional
impacts of HIV/AIDS on KZN and the rest of South Africa
(Other SA). First, we conducted a firm survey in four of
KZN's largest sectors. Second, information on workers'
HIV prevalence rates from the survey was used to calibrate
an occupation-focused demographic model. Finally, the
demographic projections were imposed on a regionalized
dynamic computable general equilibrium (DCGE) model
linked to a household survey-based micro-simulation
model. This integrated macro-microeconomic framework
permits a more robust empirically based assessment of the
impacts of HIV/AIDS.
The next section briefly describes the survey and demo-
graphic projections, as well as outlining the methodology,
paying particular attention to the links between the demo-
graphic and DCGE models. The following section dis-
cusses the DCGE model's results and their implications
for future socioeconomic development in South Africa.
The final section summarizes the findings.
Methods
Demographic impacts of HIV/AIDS in South Africa
The first stage of our analysis combines two demographic
models. For a detailed description of the demographic
model and projections, see [6]. The first model estimates
provincial population projections for different popula-
tion groups. Based on these results, the second model esti-
mates workforce projections by occupational groups. The
parameters of the second demographic model are cali-
brated to HIV prevalence rates from a firm-level survey of
workers. This section describes the population projections
and HIV prevalence profile, followed by the firm survey
and workforce projections.
Population projections
The provincial version of the ASSA-2003 model from the
Actuarial Society of South Africa [1] was used to estimate
overall population projections for KZN and Other SA. The
model produces annual population estimates with and
without the effects of HIV/AIDS for the period of 1985 to
2025. The ASSA model disaggregates the total population
by province, gender, racial groups (African, Asian, col-
oured and white) and one-year age intervals. HIV in the
model is spread via heterosexual sexual activity among
adults, who are divided into risk groups according to sex-
ual behaviour. The calibration of the model is based on
epidemiological and medical research, population census
data, and HIV prevalence data from antenatal clinic sur-
veys and mortality statistics. Table 1 provides a profile of
HIV prevalence for the year 2002, which is the base year
for our economic analysis in later sections.
HIV prevalence is concentrated among working age Afri-
cans, especially younger females (20 to 34 years) and
slightly older males (35 to 49 years). By contrast, preva-
lence for the other racial groups is considerably lower for
all age cohorts. Moreover, prevalence among Africans is
heavily concentrated within KZN - a pattern that does not
exist for other races. Given the large African and KZN pop-
ulation, it is clear that this province and population group
forms the epicentre of South Africa's HIV pandemic. The
effects of this concentration are evident in the population
projections from the ASSA model (Table 2).
The long-term implications of HIV/AIDS for population
growth are pronounced. Without its effects, South Africa's
adult population is predicted to have reached 36.4 mil-
lion by 2025. AIDS deaths reduce this adult population by
7.8 million people, which is more than a quarter of the
expected population in 2025. The predicted loss of life in
KZN is even more staggering, with two-fifths of the adult
population having died from HIV/AIDS by 2025. The
pandemic is, however, expected to peak around 2010,
with HIV prevalence rates beginning to fall and AIDS-
related sickness and death declining after 2020. Despite
"turning the corner", the scale of the pandemic and its
concentration among working age adults will have grave
implications for South Africa's workforce.
Journal of the International AIDS Society 2009, 12:18 />Page 3 of 13
(page number not for citation purposes)
Firm survey and workforce projections
Previous studies relied on population projections to esti-
mate the economic consequences of HIV/AIDS in South
Africa. As part of our study, an AIDS Projection Model
(APM) was developed to estimate size of the workforce
with and without HIV/AIDS [6]. The model distinguishes
between three occupations (managers, skilled workers
and labourers), genders, two racial groups (African and
other races), and three age cohorts (20-34, 35-49 and 50-
64). The APM is a demographic model and so cannot pre-
dict changes in workforce composition (i.e., shifts in sec-
toral employment patterns driven by economic forces).
This is the domain of the economy-wide model.
However, the APM does combine the ASSA model's pop-
ulation projections with HIV test data from a firm survey
to predict the impact of HIV/AIDS on the size of the work-
force for different occupational groups. The changing sec-
Table 1: HIV prevalence among working age adults, 2002
Population group Gender Age cohort Population (millions) HIV prevalence (%)
Other SA KZN Other SA KZN
National Both All 35,252 9,250 8.7 13.4
Africans Male 20-34 3,695 990 19.6 30.6
35-49 2,241 507 24.8 41.3
50-64 961 236 11.9 21.4
Female 20-34 3,820 1,088 29.8 43.3
35-49 2,430 655 16.2 27.3
50-64 1,141 325 1.6 3.0
Other races Male 20-34 995 172 1.8 1.5
35-49 875 160 2.3 2.2
50-64 521 108 0.6 0.7
Female 20-34 1,011 174 3.9 3.6
35-49 924 170 3.2 3.0
50-64 571 120 0.4 0.4
Source: Own calculations using estimates from [1] and [6].
Other SA: Rest of South Africa
KZN: KwaZulu-Natal
Table 2: Demographic projections, 2002-2025
Population (millions) Prevalence rate (%) AIDS-sick rate (%)
No AIDS AIDS
KZN 1990 3.54 3.54 0.39 0.00
1995 4.13 4.12 7.35 0.11
2000 4.64 4.57 23.18 1.28
2005 5.25 4.87 27.95 3.49
2010 5.90 5.06 27.59 3.80
2015 6.52 5.24 26.85 3.79
2020 7.16 5.43 26.49 3.70
2025 7.70 5.52 26.17 3.70
Other SA 1990 13.51 13.51 0.16 0.00
1995 16.16 16.16 3.42 0.05
2000 18.53 18.40 13.16 0.63
2005 20.96 20.15 18.06 1.92
2010 23.27 21.35 18.99 2.26
2015 25.22 22.09 18.74 2.50
2020 27.10 22.71 18.18 2.50
2025 28.73 23.12 17.78 2.43
Source: Own calculations using estimates from [1].
Journal of the International AIDS Society 2009, 12:18 />Page 4 of 13
(page number not for citation purposes)
toral composition of employment is endogenously
determined by the DCGE model. It therefore provides the
critical link between the population projections and the
economic analysis in the next section.
The calibration of the APM was based on the firm survey
data collected during our study. Anonymous HIV tests
were conducted for 15 companies in four economic sec-
tors: agriculture, manufacturing, tourism and transport.
The 15 companies were surveyed over three years: two in
2005, 11 in 2006, and two in 2007. For convenience, we
treated all survey results as reflecting HIV prevalence in
2006. These are key sectors of the South African economy.
Together, they comprise 59.1% and 44.7% of KZN and
South Africa's gross domestic product respectively, and
55.8% and 49.1% of labour employment.
A total of 6197 workers were tested, but only 4464 ques-
tionnaires were completed successfully. The sample had
an overall HIV prevalence rate of 16.7%, with a 95% con-
fidence interval of ± 1.1%. Table 3 presents the prevalence
rates for male African workers by sector and occupation.
The survey-based estimates of HIV prevalence were
"smoothed" to account for wider confidence intervals for
specific subgroups of the sample (see [6]).
The survey reveals considerable heterogeneity across
workers. Prevalence rates are typically highest for labour-
ers (i.e., unskilled workers) within the agriculture and
tourism sectors. They are lowest for managers and profes-
sionals, with the exception of agriculture, where preva-
lence rates are similar for all three occupational groups.
Prevalence is significantly higher for the middle-age
cohort, which is consistent with observed national trends.
The survey clearly indicates that it is inappropriate to
make broad generalizations about the sectoral and occu-
pational trends of HIV prevalence. Therefore, the inclu-
sion of an empirically calibrated APM that produces
occupation-based workforce projections greatly enhances
the accuracy of our economic analysis vis-à-vis previous
studies. It also provides a crucial link between the eco-
nomic growth impacts of HIV/AIDS and its effects on
employment, poverty and inequality. The next section
describes how these demographic projections are incor-
porated within the economic modelling.
Estimating the economic impacts of HIV/AIDS
HIV/AIDS affects economic growth and poverty via vari-
ous impact channels. At the household level, a wide range
of factors influence poverty, including: vulnerability from
deteriorating livelihoods; heightened stigmatisation and a
fragmentation of social networks; and lower investments
in human capital and nutrition. These household-level
effects need to be aggregated in order to estimate the over-
all impact of the pandemic.
Moreover, while households are directly affected by HIV/
AIDS, there are also broader implications for the economy
as a whole. In our macro-microeconomic assessment, we
account for not only households, but also other actors or
institutions, such as firms, markets and government.
However, broadening our analysis necessarily excludes
some difficult-to-measure household-level impacts.
Therefore, given our focus on economic growth, we con-
centrate on the income dimensions of poverty. Ultimately
we identify five main impact channels for HIV/AIDS: pop-
ulation growth; labour supply; labour productivity; total
factor productivity; and savings and investment. This sec-
tion describes how these impact channels are captured in
the economy-wide model
Simplified general equilibrium model
Additional file 1 presents the equations of a simple
closed-economy computable general equilibrium (CGE)
model that illustrate how HIV/AIDS affects economic out-
comes in our analysis. The model is recursive dynamic
and so can be separated into a static "within-period" com-
ponent, where producers and consumers maximize prof-
its and utility, and a dynamic "between-period"
component, where the model is updated based on the
demographic model and previous period results to reflect
changes in population, labour supply, and capital and
technology accumulation.
In the static component of the model, producers in each
sector s and region r (i.e., KZN and Other SA) produce a
Table 3: HIV prevalence rates for male Africans by occupation,
2002
Sector Age cohort Occupation groups
Managers Skilled Labourers
Agriculture 20-34 33.9 29.8 35.0
35-49 37.8 32.6 38.2
50-64 16.8 16.3 19.1
Manufacturing 20-34 22.2 24.9 31.1
35-49 24.7 27.2 33.9
50-64 0.0 14.0 17.6
Tourism 20-34 29.9 34.1 37.6
35-49 33.8 37.3 40.9
50-64 0.0 18.4 20.0
Transport 20-34 13.4 20.5 32.5
35-49 14.3 22.4 35.1
50-64 7.5 11.3 17.9
Source: Own calculations using estimates from [6].
Journal of the International AIDS Society 2009, 12:18 />Page 5 of 13
(page number not for citation purposes)
level of output Q in time period t by employing the factors
of production F under constant returns to scale (exoge-
nous productivity
α
) and fixed production technologies
(fixed factor shares δ) (eq. [1]). Profit maximization
implies that factor payments W are equal to average pro-
duction revenues (eq. [2]). Labour supply L and capital
supply K are fixed within a given time period, implying
full employment of factor resources. Labour market equi-
librium is defined at the regional level so that labour is
mobile across sectors, but wages vary by region (eq. [6]).
National capital market equilibrium implies that capital is
mobile across both sectors and regions and earns a
national rental rate (i.e., regional capital returns are equal-
ized) (eq. [7]).
Factor incomes are distributed to households in each
region using fixed income shares based on households'
initial factor endowments (eq. [3]). Total household
incomes Y are then either saved (based on marginal pro-
pensities to save υ) or spent on consumption C (according
to marginal budget shares β) (eq. [4]). Consumption
spending includes a "subsistence" component λ that is
independent of income and determined by household
populations H. Savings are collected in a national savings
pool and used to finance investment demand I (i.e., sav-
ings-driven investment closure) (eq. [5]).
Nell empirically tests the causality between national sav-
ings and investment in South Africa, and confirms the
appropriateness of a savings-driven investment closure
[7]. Finally, a single price P equilibrates national product
markets, thus avoiding having to model inter-regional
trade flows (eq. [8]). A consumer price index weighted by
the aggregate household consumption basket is the
model's numéraire.
The model's variables and parameters are calibrated to
observed data from a provincial social accounting matrix
that captures the initial equilibrium structure of the KZN
and Other SA economies in 2002. A social accounting
matrix is a consistent database capturing all monetary
flows in an economy in a given year. It contains informa-
tion on the production technologies and demand struc-
tures of detailed sectors, regions and households, as well
as government revenues and expenditures and foreign
receipts and payments. Various datasets were used to
build the 2002 provincial social accounting matrix for
South Africa, including: national accounts; the 2000
Income and Expenditure Survey; the 2002 Labour Force
Survey; and the South African Standard Industrial Data-
base [8].
The income and expenditure data was reconciled using
cross-entropy estimation [9]. Parameters are then
adjusted over time to reflect demographic and economic
changes and the model is re-solved or a series of new equi-
libriums for the period of 2002 to 2015. Two simulations
are conducted - "AIDS" and "No AIDS" - and the differ-
ence in the variables' final values is interpreted as the
impact of HIV/AIDS. For more information on the social
accounting matrix, see [10].
Dynamic impacts of HIV/AIDS
Between periods, household populations H increase at
rates determined by the demographic model (eq. [9]).
Individual-level population projections DH are estimated
for each region r, population group p, gender g and age
cohort a, and then compared to predicted population lev-
els dh in the base year 2002. The 2002 year is an appropri-
ate base for both the "AIDS" and "No AIDS" scenario
since it predates most of the main effects of HIV/AIDS on
South Africa's working population. This ratio is multi-
plied by the observed demographic composition sh of
each household group h in the CGE model to arrive at
household-level population time series for 2002 to 2025.
Demographic compositions are drawn from the re-
weighted 2000 Income and Expenditure Survey [11]. Sim-
ilarly, labour supplies are based on demographic projec-
tions for occupation-based skill groups (eq. [10]). The
factor subscript f is a composite for a worker's population
group p, gender g, and occupation o. Population and
labour supply in the DCGE model draws directly on the
demographic projections DH and DL to capture the first
two impact channels of HIV/AIDS. By increasing mortal-
ity, the pandemic reduces consumer demand and the pro-
ductive capacity of the economy, both of which are likely
to have adverse impacts on economic growth.
The third impact channel is the effect of morbidity on
workers' productivity. This is captured in (eq. [11]), where
the labour productivity growth rate ε depends on the
exogenous productivity growth μ adjusted for share of the
population that is HIV positive DP or AIDS sick DA (i.e.,
suffering from full-blown AIDS). Selected values of DP
and DA for the entire population are given in the final two
columns of Table 2.
In the "No AIDS" scenario, DP and DA are zero and
labour productivity grows at
μ
. This growth rate is lower
in the "AIDS" scenario because we assume that HIV-posi-
tive workers are half as productive as uninfected workers
and that AIDS-sick workers are a fifth as productive. This
is caused by lower on-the-job productivity and more days
absent from work. Although the prevalence rates are esti-
mated by the demographic model, the impact of morbid-
ity on worker productivity must be assumed, because
there are few empirical studies estimating workers' pro-
ductivity losses from HIV/AIDS.
Journal of the International AIDS Society 2009, 12:18 />Page 6 of 13
(page number not for citation purposes)
Given the findings of the impact of HIV/AIDS on tea pick-
ers in Kenya, our assumptions may be an upper bound
estimate of productivity losses. However, as seen in the
next section, this impact channel is found to contribute
the least to the overall economic impact of HIV/AIDS
[12].
The fourth impact channel is the reduction in total factor
productivity (TFP) caused by systemic shocks to the econ-
omy (eq. [12]). For example, AIDS morbidity and mortal-
ity reduces the productivity of uninfected workers by
disrupting the production process. Moreover, the death of
education and health professionals has long-term detri-
mental effects on the entire economic system. Unfortu-
nately, this impact channel cannot be calibrated using the
firm survey or demographic model. Thus, given the lack of
evidence, we assume that AIDS reduces annual TFP
growth φ by around 0.5% per year. This is similar to the
TFP losses used in other studies of South Africa and Bot-
swana [5,13].
The final impact channel is the adverse effect on savings
and investment (see [14]). HIV/AIDS increases house-
holds' healthcare spending and lowers spending on other
products, such as food, shelter and clothing. As a coping
strategy, households draw on assets or savings. Accord-
ingly, it is assumed that an infected households' share of
disposable income spent on health care increases by 5%
and savings rates are reduced by the same amount (i.e., β
and υ in eq. [4]). This lowers the overall level of savings
and investment (eq. [5]).
Investment from the previous period is then converted
into new capital stocks using a fixed capital price κ (eq.
[13]). This is added to previous capital stocks after apply-
ing a fixed rate of depreciation π. New capital is allocated
to regions and sectors endogenously in order to equalize
capital returns. The model therefore endogenously deter-
mines the national rate of capital accumulation and sup-
ply of capital K. If HIV/AIDS reduces national income,
then it lowers the level of savings and funds that can be
invested in the economy, thus reducing the rate of capital
accumulation and further reducing long-term economic
growth.
Extensions to the full model
The simplified model illustrates how HIV/AIDS affects
economic outcomes in our analysis. However, the full
model drops certain assumptions. The full DCGE model
is an extended version of the national model described in
[10]. Constant elasticity of substitution (CES) production
functions allow factor substitution based on relative factor
prices (i.e., δ is no longer fixed).
The model identifies 25 sectors in KZN and Other SA. The
25 sectors are mapped onto the four sectors in the firm
survey. Most of the sectors in the DCGE model are in man-
ufacturing, but we assume similar prevalence rates for
mining. Similarly, we assign the tourism sector prevalence
rates to the retail trade sector, and the transport sector
prevalence rates to the remaining service sectors in the
DCGE model. Intermediate demand in each sector
(excluded in the simple model) is determined by fixed
technology coefficients.
Regional labour markets are further segmented across
race, gender and three occupation-based skill categories. A
nested demand system places skill levels above gender
and age groups. All factors are assumed fully employed,
and capital is immobile across sectors. New capital from
past investment is allocated to regions and/or sectors
according to profit rate differentials under a "putty-clay"
specification (see [15]).
The full model still assumes national product markets for
most commodities. However, international trade is cap-
tured by allowing production and consumption to shift
imperfectly between domestic and foreign markets
depending on the relative prices of imports, exports and
domestic goods. South Africa is a small country and so
world prices are fixed and the current account balance is
maintained by a flexible real exchange rate (i.e., price
index of tradable to non-tradeable goods). Production
and trade elasticities are econometrically estimated.
Households maximise a Stone-Geary utility function such
that a linear expenditure system determines consumption
and permits non-unitary income elasticities. The latter are
drawn from [16]. Households are disaggregated across
KZN and Other SA, the racial group of the household
head (i.e., African and other), and across 14 income
groups (i.e., 10 deciles with the top decile separated into
five income groups). These household groups pay taxes to
government, based on fixed direct and indirect tax rates.
Tax revenues finance exogenous recurrent spending result-
ing in an endogenous fiscal deficit.
Finally, the model includes a micro-simulation module in
which each household in the 2000 Income and Expendi-
ture Survey [11] is linked to its corresponding representa-
tive household in the DCGE model. Changes in
households' real consumption spending on each com-
modity are passed down from the DCGE model to the
household survey, where total per capita consumption
and poverty measures are recalculated.
In summary, the full DCGE model captures the detailed
sectoral and labour market structure of South Africa's
economy as well as the linkages between production,
Journal of the International AIDS Society 2009, 12:18 />Page 7 of 13
(page number not for citation purposes)
employment and household incomes. Moreover, the
results from the firm survey and demographic model are
explicitly integrated within the economic analysis.
Although not exhaustive, the five main impact channels
captured by the DCGE model provide a reasonable
approximation of the consequences of HIV/AIDS for
growth, poverty and inequality.
Results and discussion
Two simulations are conducted to estimate the impact of
HIV/AIDS during the period of 2002 to 2025. The "AIDS"
scenario captures the current growth path of KZN and
South Africa, drawing on the demographic projections for
population and labour supply, and observed trends for
TFP and labour productivity growth. Demographic projec-
tions provide time-series estimates for DH (eq. [9]), DL
(eq. [10]), and DP and DM (eq. [11]. Observed trends for
1990 to 2007 provide estimates of
μ
(eq. [11]),
φ
(eq.
[12]) and
π
and
κ
(eq. [13]). Together these parameters
define the exogenous dynamic component of the DCGE
model. Static component parameters and behavioural
elasticities are either econometrically estimated or drawn
from the 2002 social accounting matrix. Then, in the
hypothetical "No AIDS" scenario, we adjust the demo-
graphic projections to capture the higher population,
labour supply and productivity growth rates in the
absence of HIV/AIDS. In this section, we compare the
results from these two simulations.
Growth and employment
Tables 4 and 5 present the growth and employment
results from the DCGE model. Given the demographic
projections, HIV/AIDS reduces KZN's overall population
growth rate from an average 1.85% from 2002 to 2025 in
the "No AIDS" scenario to 0.79% in the "AIDS" scenario.
This is larger than the decline in the population growth
rate for Other SA due to the province's higher HIV preva-
lence. Similarly, declines in the African population are
substantially larger than for other races due to higher prev-
alence among Africans.
Declines in the labour supply caused by HIV/AIDS are
larger than declines in population growth (see Table 5).
For example, the population growth rate falls by 1.06% in
KZN, while employment growth falls by 1.12%. This
reflects the concentration of HIV infections among work-
ing age adults. Since employment growth exceeds popula-
tion growth, the dependency ratio falls slightly from 5.05
to 4.98 under the "No AIDS" scenario. This is driven by
African households, whose lower skilled workers have
higher prevalence rates and are more affected by HIV/
AIDS. Thus, part of African households' higher depend-
ency ratio is driven by HIV/AIDS, which reduces the Afri-
can working age population faster than the African
population as a whole. The reverse is true for other racial
groups, albeit only slightly.
Table 4: Growth and poverty results, 2002-2025
KwaZulu-Natal (KZN) Other South Africa (Other SA)
Initial, 2002 Annual growth (%) Initial, 2002 Annual growth (%)
AIDS No AIDS AIDS No AIDS
GDP (R billions) 171 2.84 4.44 872 3.04 4.46
GDP per capita (R) 18,464 2.03 2.54 24,723 2.23 2.88
Population (millions) 9,250 0.79 1.85 35,252 0.79 1.54
African 7,999 0.93 2.08 28,045 0.94 1.80
Other 1,252 -0.23 -0.03 7,207 0.17 0.37
Dependency ratio (pop/employment) 4.86 5.05 4.98 4.41 4.40 4.31
African households 5.57 5.62 5.38 4.94 4.82 4.60
Other households 2.69 2.73 2.82 3.12 3.13 3.21
Total factor productivity - 0.03 0.60 - -0.04 0.50
Household savings rate (%) 1.76 1.40 3.51 0.50 0.40 1.00
Health spending share of income (%) 13.55 20.87 14.33 14.02 21.44 14.90
Poverty rates (%)
Incidence of poverty (P0) 36.66 19.46 20.00 24.83 10.50 9.51
Depth of poverty (P1) 14.73 6.02 6.20 9.40 3.46 3.15
Severity of poverty (P2) 7.71 2.69 2.77 4.91 1.74 1.60
Number of poor people (thousands) 3,391 2,157 2,819 8,752 4,438 4,759
Number of AIDS deaths (thousands) - 3,011 0 - 7,793 0
Source: Provincial DCGE model results.
Notes: Poverty is based on US$2 a day poverty line (R161 per adult equivalent per month in 2000 prices).
R: South African rands
Journal of the International AIDS Society 2009, 12:18 />Page 8 of 13
(page number not for citation purposes)
High HIV prevalence and larger proportions of AIDS-sick
people explain why HIV/AIDS has a more negative effect
on labour productivity in KZN than in the rest of the
country (see Table 5). Based on observed trends, labour
productivity grows at 1.8% under the "AIDS" scenario.
However, this is below the 1.92% that would have been
achieved in KZN without AIDS-related morbidity and
absence from work. Productivity losses from HIV/AIDS
are largest for lower skilled African workers due to higher
HIV prevalence. These variations in the labour supply and
productivity impacts underline the importance of differ-
entiating skill and occupation groups when estimating the
macroeconomic impacts of HIV/AIDS.
Based on other studies, we assumed that HIV/AIDS
reduces annual TFP growth by 0.5% per year. Overall
losses in TFP growth in the DCGE model are slightly larger
due to endogenous shifts in resources towards more pro-
ductive industries (see Table 4). This makes the economy-
wide TFP growth rate about 0.6% higher in the "No AIDS"
scenario. It should also be noted that the reported changes
in the TFP growth rate are independent of the implied TFP
changes caused by labour productivity improvements.
Together, higher productivity and labour supply causes an
expansion of gross domestic product (GDP). The average
annual growth rate in GDP in KZN increases from 2.8% in
the "AIDS" scenario to 4.44% in the "No AIDS" scenario
(i.e., HIV/AIDS lowers KZN's GDP growth rate by 1.60%
per year). This is larger than the negative impact of HIV/
AIDS on the rest of South Africa's GDP growth rate, which
is reduced by 1.42% per year. Compounding these reduc-
tions in annual growth rates means that the KZN and the
rest of the South African economies would be 43% and
37% smaller in 2025, respectively, than they could have
been were it not for HIV/AIDS.
Industrial growth
Impacts differ by industry and region (see Table 6).
Although the overall decline in economic growth due to
HIV/AIDS is larger in KZN than in the rest of South Africa,
this is not the case for all individual sectors. The DCGE
model captures the varying skill intensities of employ-
ment by sector and region from the 2004 Labour Force
Survey [17]. This information indicates that the construc-
tion industry in KZN is more skill intensive than in the
rest of South Africa, with 18% of employment in KZN
comprising low-skilled workers compared to 26% in the
country as a whole. Thus, by reducing the supply of lower
skilled workers, HIV/AIDS hampers the construction
industry in the rest of South Africa more than it does in
KZN. Similarly, unskilled workers account for 22% of
employment in the rest of South Africa's water utilities
industry, compared to only 10% in KZN. Therefore, addi-
Table 5: Labour market results, 2002-2025
KwaZulu-Natal (KZN) Other South Africa (Other SA)
Initial, 2002 Annual growth (%) Initial, 2002 Annual growth (%)
AIDS No AIDS AIDS No AIDS
Employment (1000s) 1,902 0.63 1.75 7,988 0.81 1.64
African 1,436 0.90 2.24 5,677 1.05 2.11
Skilled 184 0.87 1.73 679 1.01 1.67
Semi-skilled 718 0.99 2.23 2,844 1.06 2.04
Low skilled 534 0.78 2.43 2,154 1.05 2.33
Other 466 -0.31 -0.24 2,311 0.15 0.24
Labour productivity - 1.80 1.92 - 1.80 1.88
African - 1.80 2.02 - 1.80 1.95
Skilled - 1.80 1.93 - 1.80 1.89
Semi-skilled - 1.80 2.02 - 1.80 1.96
Low skilled - 1.80 2.10 - 1.80 2.00
Other - 1.80 1.82 - 1.80 1.82
Wages (Rands) 75,511 3.09 4.05 96,054 2.94 3.93
African 59,219 2.48 2.88 91,944 2.67 3.33
Skilled 64,824 2.53 3.24 120,083 2.76 3.63
Semi-skilled 33,516 2.30 2.69 41,826 2.33 2.89
Low skilled 20,098 2.63 1.86 21,979 2.74 2.33
Other 91,803 3.44 4.68 100,163 3.19 4.41
Source: Provincial DCGE model results.
Journal of the International AIDS Society 2009, 12:18 />Page 9 of 13
(page number not for citation purposes)
tional GDP growth in these industries is higher in the rest
of South Africa than in KZN under the "No AIDS" sce-
nario.
Although HIV/AIDS has detrimental effects for industries
in the rest of South Africa, most of the industries that are
most severely hurt are in KZN. This is particularly true for
agriculture in KZN, where the AIDS seroprevalence survey
data and demographic model predicts especially high HIV
prevalence rates. Moreover, this impact on agriculture has
negative downstream implications for food processing in
KZN. Although the model does not capture rural-urban
differences, the large increase in agriculture's growth rate
under the "No AIDS" scenario suggests that HIV/AIDS
impacts are likely to be more severe in rural areas. Had the
model explicitly captured the higher HIV prevalence in
rural areas, the outcomes would have been more pro-
nounced.
Of KZN's industries adversely affected by HIV/AIDS, the
electrical machinery and electricity industries are most
severely undermined. The 2002 supply-use table [18] (on
which the DCGE is based) indicates that the electrical
machinery sector is less capital intensive than most other
industries in the economy. This means that the sector is
more vulnerable to the reductions in labour supply
caused by HIV/AIDS. Moreover, electrical machinery has
a high income elasticity (1.23), which suggests that
demand is particularly sensitive to changes in incomes.
By contrast, other light manufacturing industries, such as
food products and textiles, have lower income elasticities.
As a result, the fall in national income caused by HIV/
AIDS generates larger declines in demand for electrical
machinery than for food products or textiles. Finally, most
jobs in KZN's electrical machinery industry are for lower
skilled workers, who are most affected by HIV/AIDS.
Together these three characteristics of this industry
explain the considerable acceleration of growth in the "No
AIDS" scenario.
The water utilities industry in KZN is also less skill inten-
sive than in the rest of South Africa. However, unlike the
electrical machinery industry, the water utilities industry
is far more capital intensive than most other industries in
the economy. Thus, it is not so much the decline in labour
supply that undermines growth in this industry, but more
the negative consequences of HIV/AIDS for investment
and capital accumulation.
Table 6: Change in industrial growth results, 2002-2025
Point change in growth rate in "No AIDS" scenario
1
Ratio of KZN to Other SA growth rate changes
(1)/(2)
KZN Other SA
(1) (2)
All sectors (total GDP) 1.60 1.42 1.13
Agriculture 1.88 1.42 1.32
Mining 1.93 1.66 1.16
Food processing 1.74 1.40 1.24
Textiles & clothing 1.66 1.56 1.06
Wood products 1.46 1.46 1.00
Chemicals 1.22 1.47 0.83
Non-metal minerals 1.72 1.70 1.02
Machinery 1.53 1.61 0.95
Electrical machinery 2.28 1.67 1.37
Scientific equipment 1.64 1.41 1.16
Transport equipment 1.59 1.44 1.10
Other manufactures 1.55 1.53 1.01
Electricity 2.05 1.38 1.49
Water and gas 1.47 1.61 0.91
Construction 1.91 1.93 0.99
Trade services 1.82 1.47 1.23
Hotels & catering 1.64 1.45 1.13
Transport services 1.63 1.52 1.08
Communications 1.76 1.51 1.17
Financial services 1.89 1.53 1.24
Business services 1.95 1.49 1.31
Source: Provincial DCGE model results.
1. Point change in annual growth rate between "AIDS" and "No AIDS" scenarios
Journal of the International AIDS Society 2009, 12:18 />Page 10 of 13
(page number not for citation purposes)
Model results indicate that the share of investment in
GDP is 2.1% lower under the "AIDS" scenario. While
most of this decline in investment is due to the slowdown
in economic growth caused by HIV/AIDS, about 28% of
the decline results from lower household savings (see
Table 4). Thus, the deceleration in economic growth,
especially in certain sectors, is driven by the indirect mac-
roeconomic impacts of HIV/AIDS, rather than by its direct
impact on population and labour supply.
Poverty and inequality
The impact of HIV/AIDS on income poverty is small (see
Table 4). Poverty is measured using the US$2 per day pov-
erty line (which was equal to 161 South African rands per
person per month in 2000, the survey year for the micro-
simulation module). Model results indicate that without
HIV/AIDS, the incidence of poverty (or poverty head-
count) would be only slightly lower in the rest of South
Africa (i.e., 9.51 under the "No AIDS" scenario compared
to 10.50 under the "AIDS" scenario). Moreover, the pov-
erty headcount in KZN would be virtually unchanged (or
slightly higher) (see Figure 1).
The poverty outcomes are extremely sensitive changes in
the definition of the poverty line. This is especially true for
KZN since its growth incidence curve crosses the x-axis
almost at the final year poverty rate (see Figure 2). Greater
attention should therefore be paid to the distributional
impacts of HIV/AIDS. These impacts are small because the
net effect of HIV/AIDS on income poverty depends on two
opposing factors. On the one hand, the drop in the work-
ing age adult population and the rise in dependency ratios
reduce households' incomes. On the other hand, poverty
is based on per capita expenditures, which may increase if
the decline in household populations exceeds the loss of
income. The overall poverty impact therefore depends on
which of the two factors dominate.
It is surprising that the model predicts both slightly higher
poverty and falling dependency ratios in KZN in the "No
AIDS" scenario. We find that poverty remains virtually
unchanged because falling wages, caused by labour
demand constraints, implies that household incomes rise
slower than population growth (see Table 5). Falling
wages are more pronounced for lower skilled African
workers, whose wage growth rate falls from 2.63% under
the "AIDS" scenario to 1.86% under the "No AIDS" sce-
nario.
By contrast, higher skilled workers have lower HIV preva-
lence rates and these workers, therefore, benefit more
from faster economic growth (i.e., their wages rise). Thus,
the structural constraints that contribute to high unem-
ployment in the rest of South Africa remain even in the
absence of HIV/AIDS. More specifically, the results indi-
cate that KZN and South Africa would continue to become
more capital and skill intensive over time, even if the sup-
ply and productivity of lower skilled workers were not
undermined by HIV/AIDS.
It is also an apparent contradiction that poverty remains
virtually unchanged in KZN under the "No AIDS" sce-
nario despite an acceleration of per capita GDP growth by
0.5% (see Table 4). This finding underlines the impor-
tance of considering industry and household-level detail
that is not captured by aggregate growth models. Aggre-
gate GDP and consumption measures hide the distribu-
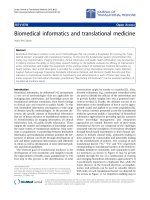
tional changes caused by HIV/AIDS. Figure 2 shows the
"growth incidence curves" for KZN and the rest of South
Africa. These curves show the change in the growth rate of
annual per capita expenditure for each individual in the
population ranked by initial expenditure levels.
The mean of both regions' curves is positive, reflecting the
increase in aggregate per capita incomes in the "No AIDS"
scenario. However, the fact that the growth incidence
curves are upward sloping means that lower income
households benefit less than higher income households
in the "No AIDS" scenario. This suggests that income ine-
quality would increase between 2002 and 2025 if HIV/
AIDS were eliminated.
A number of reasons explain this result. First, as men-
tioned earlier, the increased supply of lower skilled work-
ers is offset by falling wages, leaving per capita incomes
among households at the lower end of the distribution
largely unchanged. The reverse is true for higher skilled
workers whose wages rise with faster economic growth.
Secondly, unemployment is high among working age
adults living in poorer households. Therefore, reducing
adult mortality may not reduce these households'
dependency ratios, causing per capita incomes to fall. This
is the case for lower income households in KZN, whose
growth incidence curve is negative. While removing the
effects of HIV/AIDS improves overall household welfare,
it is detrimental for lower income household poverty in
KZN, where unemployment is especially severe.
A third reason for the increase in inequality is shown by
measuring the contribution of the five impact channels to
overall changes in GDP growth rates and poverty rates
under the "No AIDS" scenario (see Table 7). The decom-
position was conducted by only imposing single impact
channels on the DCGE model. This is a reasonable
approximation of each channels' contribution, although
it may exclude interactions between channels when they
are jointly imposed. The table shows that the effect of
HIV/AIDS on labour supply and TFP dominates growth
outcomes (i.e., 85% of the increase in the GDP growth
rate). The finding that TFP losses from HIV/AIDS cause
Journal of the International AIDS Society 2009, 12:18 />Page 11 of 13
(page number not for citation purposes)
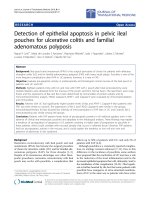
Channels' impact on final year poverty rate, 2025Figure 1
Channels' impact on final year poverty rate, 2025. Source: Provincial DCGE model results. Note: Outcomes are cumu-
lative (for example, labour productivity includes the outcomes from labour supply). Horizontal bars show upper and lower
bounds after assuming a 20% confidence interval around the additional growth rate resulting from each impact channel.
KwaZulu-Natal (KZN)
Other South Africa (Other SA)
23.0
21
.0
19.46
20.0
0
20.00
19.0
16
.6
4
17.0
16.95
15.0
13
.0
12.5
2
11.68
11.0
9.0
Final year povert y headcount rate (%)
Labou
r
Labour prod. TFP Health Population Withou
t
Wi
th AIDS
supply spe
ndi
ng growth AIDS
12.0
10.50
10
.0
9.19
9.51
9.51
9.32
8.0
6.73
6.0
6.36
4.0
2.0
0.0
Final year povert y headcount rate (%)
Labou
r
Labour prod. TFP Health Population Withou
t
Wi
th AIDS
supply spe
ndi
ng growth AIDS
Regional growth incidence curves, 2002-2025Figure 2
Regional growth incidence curves, 2002-2025. Source: Provincial DCGE model results.
KZN
Other SA
Annual per capita expenditure growth (%)
Popul
ation ranked by per capita expenditure in 2002
High
Low
1.6
1.4
1.2
1.0
0.8
0.6
0.4
0.2
0.0
-0.2
-0.4
Journal of the International AIDS Society 2009, 12:18 />Page 12 of 13
(page number not for citation purposes)
almost a one percent drop in economic growth is consist-
ent with the findings of other studies [19-21].
We have already discussed how increases in labour supply
cause declines in lower skilled workers' wages, thus reduc-
ing the income gains from reduced mortality in the "No
AIDS" scenario. Moreover, increased labour productivity
and reduced health spending have only small effects on
economic growth. Thus, the direct channels linking HIV/
AIDS to poorer households are less important than the
indirect TFP effects.
The dominance of indirect impact channels is also evident
in the poverty decomposition, which shows how the
direct channels' contributions to poverty reduction are
smaller than that of TFP growth. They are also far smaller
than the downward pressure placed on per capita incomes
by higher population growth. Thus it is TFP that drives the
overall increase in growth and reduction in poverty in the
rest of South Africa under the "No AIDS" scenario. How-
ever, TFP growth does not just benefit households with
HIV-infected working adults. Rather, faster economic
growth driven by TFP improvements drives up demand
for all workers, including those whose HIV prevalence is
initially low.
Thus, the third reason why removing HIV/AIDS causes
inequality to rise is that TFP benefits all households and
workers regardless of whether they are infected by HIV.
Higher income households therefore benefit from faster
economic growth despite low infection rates. This finding
highlights the importance of taking macroeconomic spill-
overs into account when assessing the overall impact of
HIV/AIDS on growth and poverty.
Conclusion
KwaZulu-Natal, together with the rest of South Africa, suf-
fers from severe unemployment and poverty. Moreover,
the province has one of the highest HIV prevalence rates
in the world. This paper has estimated the impact of HIV/
AIDS on economic growth and income poverty in KZN
and the rest of South Africa. Drawing on the findings from
a firm-level survey in four of KZN's major economic sec-
tors, we integrated the projections from a demographic
model within a regionalized DCGE model. This in turn
was linked to a survey-based micro-simulation module in
order to estimate poverty and distributional outcomes.
This approach extends previous studies by: focusing on
South Africa's most afflicted region; basing its projections
on more reliable estimates of HIV prevalence for workers
across occupational groups; and explicitly integrating
demographic, economy-wide and survey-based models.
The results indicate that HIV/AIDS undermines economic
growth in South Africa. It lowers the GDP growth rate by
1.60% and 1.42% per year in KZN and the rest of South
Africa, respectively. Cumulating these losses means that
the KZN economy would be 43% smaller in 2025 than it
would be in the absence of HIV/AIDS. The rest of the
country's economy is similarly 37% smaller. While the
detrimental growth effect is large, the impact of HIV/AIDS
on the regional poverty headcounts is relatively small, and
that inequality would be higher in the absence of HIV/
AIDS.
The small change in per capita incomes among the poor
population should be interpreted alongside the 11.8 mil-
lion who are projected to die as a result of HIV/AIDS
between 2002 and 2025. Thus, the gains in economic
growth in the absence of HIV/AIDS are sufficient to offset
the pressure placed on poverty by a substantially larger
population. Moreover, the incentive to mitigate the effects
of HIV/AIDS lies not only with poorer households and
those with infected members, but also with the uninfected
and higher income households, who stand to benefit
from faster economic growth and rising incomes. These
findings reveal the significant burden that HIV/AIDS
places on future economic development in KwaZulu-
Natal and the rest of the South Africa, and underlines the
need for policies and investments to curb the pandemic.
Table 7: Contributions of impact channels, 2002-2025
Growth rate (%) Poverty rate (%-point)
KZN Other SA KZN Other SA
Total change 1.60 1.42 0.54 -0.99
Labour supply 0.63 0.50 -2.51 -1.36
Labour productivity 0.11 0.08 -0.31 -0.32
Total factor productivity 0.73 0.73 -4.13 -2.64
Private savings/investment 0.13 0.11 -0.84 -0.56
Population growth 0.00 0.00 8.33 3.88
Source: Provincial DCGE model results.
Publish with BioMed Central and every
scientist can read your work free of charge
"BioMed Central will be the most significant development for
disseminating the results of biomedical research in our lifetime."
Sir Paul Nurse, Cancer Research UK
Your research papers will be:
available free of charge to the entire biomedical community
peer reviewed and published immediately upon acceptance
cited in PubMed and archived on PubMed Central
yours — you keep the copyright
Submit your manuscript here:
/>BioMedcentral
Journal of the International AIDS Society 2009, 12:18 />Page 13 of 13
(page number not for citation purposes)
Competing interests
The authors declare that they have no competing interests.
Authors' contributions
JT developed the macroeconomic model, collected data,
ran the simulations, produced the output tables and fig-
ures, and drafted the manuscript, JG conceived of the
study and participated in its design and coordination and
edited the manuscript, and GG participated in the study
design and coordination. All authors have read and
approved the final version of the manuscript.
Additional material
Acknowledgements
Many people and organisations assisted in the production of this paper.
Company representatives, representatives of chambers of commerce and
industry, municipal and provincial government representatives and inde-
pendent economic analysts, both business and academic, contributed either
information reference material or data. To all of those people listed below,
we thank you for your efforts.
We would like to acknowledge the assistance of the following people in the
production of this paper: Nisaar Mohammed, Ranaveer Persad, Gareth
Coleman, Kambale Kavese, Jabulile Madondo, Seelan Naicker, Yasmin
Khan, Shunnon Tulsiram, Russell Curtis, Nicholas Mncube, Mabuyi Mnguni,
Hennie Smit, Helen Ludwig, Garth Macartney, Andrew Layman, Phili
Mkhize, Penny Milner-Smyth, Lindani Dhlomo, Claude Moodley, Paul
Crowther, James Seymour, Lisa Brink, Gerrard Patzer, Justin Barnes, Rob
Stewart, Clive Coetzee, Eugene de Beer, Graham Muller, Claude van der
Merwe, Mark Colvin, Alan Matthews, Nicoli Nattrass, Kwame Owusu-
Ampomah, Markus Haacker, Jocelyn Vass, Miriam Altman, John Stover and
Steven Forsythe.
Funding for the study from which this paper arises was provided by the Glo-
bal Fund for HIV/AIDS, Tuberculosis and Malaria.
References
1. Actuarial Society of South Africa: ASSA 2003. AIDS and Demographic
Model 2005 [
]. Actuarial Society of
South Africa
2. Hoogeveen J, Özler B: Poverty and Inequality in Post-Apart-
heid South Africa: 1995-2000. In Poverty and Policy in Post-Apart-
heid South Africa Edited by: Bhorat H, Kanbur R. Pretoria: HSRC Press;
2006.
3. Bhorat H, Oosthuizen M: Evolution of the Labour Market: 1995-
2000. In Poverty and Policy in Post-Apartheid South Africa Edited by: Bho-
rat H, Kanbur R. Pretoria: HSRC Press; 2006.
4. Casale M, Whiteside A: The Impact of HIV/AIDS on Poverty,
Inequality and Economic Growth. Unpublished Mimeo. Health
Economics and HIV/AIDS Research Division, University of KwaZulu-
Natal, South Africa; 2006.
5. Arndt C, Lewis J: The HIV/AIDS Pandemic in South Africa:
Sectoral Impacts and Unemployment. Journal of International
Development 2001, 13:427-449.
6. Matthews A, Gow J, George G: The Demographic Impact of
Employment on HIV-AIDS Prevalence and Incidence: Evi-
dence from KwaZulu-Natal, South Africa. Unpublished Mimeo.
Health Economics and HIV/AIDS Research Division, University of
KwaZulu-Natal, South Africa; 2008.
7. Nell K: Long-Run Exogeneity between Saving and Invest-
ment: Evidence from South Africa. In Working Paper 2-2003
Trade and Industrial Policy Strategies, Johannesburg, South Africa;
2003.
8. Quantec: Republic of South Africa Regional Indicators. Pre-
toria, South Africa; 2007.
9. Robinson S, Catteneo A, El-Said M: Updating and Estimating a
Social Accouting Matrix Using Cross Entropy Methods. Eco-
nomic Systems Research 2001, 13:47-64.
10. Thurlow J: A Dynamic Computable General Equilibrium
(CGE) Model for South Africa: Extending the Static IFPRI
Model. In Working Paper Trade and Industrial Policy Strategies, Pre-
toria, South Africa; 2005.
11. Statistics South Africa: 2000 Income and Expenditure Survey.
Statistics South Africa, Pretoria; 2001.
12. Fox M, Rosen S, MacLeod W, Wasunna M, Bii M, Foglia G, Simon J:
The Impact of HIV/AIDS on Labour Productivity in Kenya.
Tropical Medicine and International Health 2004, 9:318-324.
13. Thurlow J: Is HIV/AIDS Undermining Botswana's "Success
Story"? In Discussion Paper 697 International Food Policy Research
Institute, Washington DC; 2006.
14. Freire S: Impact of HIV/AIDS on Saving Behaviour in South
Africa. In Unpublished Mimeo TEAM, Sorbonne University, Paris;
2002.
15. Dervis K, de Melo J, Robinson S: General Equilibrium Models for Devel-
opment Policy Cambridge University Press, New York, USA; 1982.
16. Case A: Income Distribution and Expenditure Patterns in
South Africa. In Unpublished Mimeo Princeton University, USA;
2000.
17. Statistics South Africa: Labour Force Survey (September 2004) Statistics
South Africa, Pretoria; 2005.
18. Statistics South Africa: Final Supply-Use Tables for South Africa, 2002
Statistics South Africa, Pretoria; 2004.
19. Couderc N, Ventelou B: AIDS, Economic Growth and Epidemic
Trap in Africa. Oxford Development Studies 2005, 33:417-426.
20. McDonald S, Roberts J: AIDS and Economic Growth: A Human
Capital Approach. Journal of Development Economics 2006,
80:228-250.
21. Ventelou B, Moatti J, Videau Y, Kazatchkine M: Time is Costly:
Modelling the Macro-Economic Impact of Scaling Up Access
to Antiretroviral Treatment for HIV/AIDS in Sub-Saharan
Africa. AIDS 2008, 22:107-113.
Additional file 1
Simplified CGE model variables, parameters and equations. The infor-
mation provided outlines the structure of the CGE model, its variables,
parameters and equations
Click here for file
[ />2652-12-18-S1.DOC]