báo cáo hóa học:" Targeting the hotspots: investigating spatial and demographic variations in HIV infection in small communities in South Africa" pot
Bạn đang xem bản rút gọn của tài liệu. Xem và tải ngay bản đầy đủ của tài liệu tại đây (687.85 KB, 9 trang )
RESEARC H Open Access
Targeting the hotspots: investigating spatial and
demographic variations in HIV infection in small
communities in South Africa
Handan Wand
1*†
, Gita Ramjee
2†
Abstract
Background: In South Africa, the severity of the HIV/AIDS epidemic varies according to geographical location;
hence, localized monitoring of the epidemic would enable more effective preven tion strategies. Our objectives
were to assess the core areas of HIV infection in KwaZulu-Natal, South Africa, using epidemiological data among
sexually active women from localized communities.
Methods: A total of 5753 women from urban, peri-rural and rural communities in KwaZulu-Natal were screened
from 2002 to 2005. Each participant was geocoded using a global information system, based on residence at time
of screening. The Spatial Scan Statistics programme was used to identify areas with disproportionate excesses in
HIV prevalence and incidence.
Results: This study identified three hotspots with excessively high HIV prevalence rates of 56%, 51% and 39%.
A total of 458 sexually active women (19% of all cases) were included in these hotspots, and had been exclusively
recruited by the Botha’s Hill (west of Durban) and Umkomaas (south of Durban) clinic sites. Most of these women
were Christian and Zulu-speaking. They were also less likely to be married than women out side these areas (12%
vs. 16%, p = 0.001) and more likely to have sex more than three times a week (27% vs. 20%, p < 0.001) and to
have had more than three sexual partners (55% vs. 45%, p < 0.001). Diagnosis of genital herpes simplex virus type
2 was also more common in the hotspots. This study also identified areas of high HIV incidence, which were
broadly consistent with those with high prevalence rates.
Conclusions: Geographic excesses of HIV infections at rates among the highest in the world were detected in
certain rural communities of Durban, South Africa. The results reinforce the inference that risk of HIV infection is
associated with definable geographical areas. Localized monitoring of the epidemic is therefore essential for more
effective prevention strategies - and particularly urgent in a region such as KwaZulu-Natal, where the epidemic is
particularly rampant.
Background
It is estimated that more than 60% of the world’sHIV-
infected population lives in sub-Saharan Africa, and
South Africa is currently experiencing the heaviest HIV/
AIDS load in the world [1]. In South Africa’sprovince
of KwaZulu-Natal, the epidemic is at the most advanced
stage, with HIV prevalence among mothers attending
antenatal clinics estimated to be 39% [2]. Reasons as to
whytheHIVepidemicisrampantinthisregionare
likely to be multi-factorial and complicated. Socio-
economic conditions and specific factors, such as pat-
terns of sexual networking, levels of condom use and
sexually transmitted infections, are known to be impor-
tant determinants of spread of HIV infection [2,3].
Use of curren t HIV preventi on methods, such as con-
dom s, mon ogamy and a bstinence, is not always realistic
in practice for many reasons. The need for improved
preventative technologies against HIV infection remains
urgent. Researchers are trying to d evelop an effective
microbicide that could be used by women to help pre-
vent HIV transmission. However, clinical trials of the
* Correspondence:
† Contributed equally
1
National Centre in HIV Epidemiology and Clinical Research, Sydney, Australia
Full list of author information is available at the end of the article
Wand and Ramjee Journal of the International AIDS Society 2010, 13:41
/>© 2010 Wand and Ramjee; licensee BioMed Central Ltd. This is an Open Access article distributed under the term s of the Creative
Commons Attribution License ( which permits unrestricted us e, distribution, and
reproductio n in any medium, provi ded the original work is prope rly cited.
efficacy of microbicides have so far proved disappointing
[4-7].
As the e pidemic continues its devastating impact in
this region, geostatistical approaches have received
increasing attention as a way of determining possible
“hotspots” of HIV infection and prioritizing areas for
intervention [8,9]. If found to exist and to have signifi-
cantly excessive rates of HIV, such hotspots could be
considered as surrogates for unobserved or unknown
risk factors.
However, investigating the spatial structure of the HIV
epidemic can be challenging. Sparsely populated, large
geographical areas can mask geographical heterogeneity
and may potentially cause misinterpretation of true
underlying geographical patterns [10].
The HIV Prevention Research Unit of the Medical
Research Council in Durban, KwaZulu-Natal, has been
involved in many international research programmes and
clinical trials in HIV prevention, playing an important
role in the fight against HIV (G Ramjee, personal com-
munication). The role of this unit includes teaching thou-
sands of women about caring for themselves, including
using condoms, and encouraging them to test for HIV, as
well as helping those already infected.
In this study, we investigated the geographical cluster-
ing of HIV infection using data from six geographical
strata; these came from two of the unit’s site-prepared-
ness studies and one HIV prevention phase III clinical
trial of vaginal diaphragms. The cohorts of women were
drawn from rural, semi-rural and urban communities in
KwaZulu-Natal.
The geographical data (latitude and longitude)
obtained using the geographic information system
(GIS) a nd global positioning system (GPS) technologies
were fed into a statistical programme [10] to character-
ize spatial clusters of HIV infections without previous
knowledge of eit her the number or location of the clus-
ters [11]. A “cluster” or “hotspot” is detected within a
defined geographical location during a specific time-
frame when the location has a disproportionate excess
of HIV infections when compared with neighbouring
areas under study.
We hypothesized that geographical clusters of HIV
infection would represent location-specific networks, and
could be used as the basis to link socio-demographic data
to show that these clusters represent relatively homoge-
nous groups of women, thus allowing a large sexual net-
work to be divided into smaller sub-commu nities. We
also addressed the question of whether or not other
demographic or sexual behavioural data could further
differentiate the geographically distinct clusters in this
region. Such data could provide valuable insight into the
spread of HIV infection.
Methods
Study areas and geographical data
We combined data from 5753 sexually act ive women
who consented to screening for thr ee studies fro m six
clinics and 158 census locations included in this study.
The studies were as follows: the Methods for Improving
Reproductive Health in Africa (MIRA) trial of the dia-
phragm for HIV prevention, September 2002 to Septem-
ber 2005 (rural Umkomaas, 44 km south of Durban, and
Botha’s Hill, 31 km west of Durban) [12]; th e Microbi-
cides Development Programme (MDP) Feasibility Study
in Preparation for Phase III Microbicide Trials, August
2002 to September 2004 (semi-rural Tongaat, 31 km
north of Durban, and Verulam, 22 km north of Durban)
[13]; and the HIV Prevention Trials Network (HPTN
055) Site-preparedness Study for Future Implementation
of PhaseII/IIb/III clinical trials, May 2003 to January
2005 (rural district of Hlabisa and urban Durban) [14].
Details of participants’ placesofresidencewerecol-
lected on a locator information form at screening, and
residential areas were captured onto a spreadsheet. Field
staff visited each participant’s place of residence; once
an appropriate satellite fix was acquired, the coordinates
were recorded on a hand-held GPS device, and a back-
up hard copy of the data was also created.
Participants’ confidentiality was ensured by using iden-
tifying numbers linked to the GPS coordinate reading,
instead of names and addresses. At the end of each
working day, field staff captured the coordinates digitally
on a spreadsheet. These data were forwarded to the GIS
lab and geogra phical coordinates for each of 158 census
locations were used a s a proxy for the location of parti-
cipants in the study.
For the MIRA and HPTN 055 trials, HIV diagnostic
testing was achieved using two rapid tests on whole
blood sourc ed from either finger-prick or venepuncture
(Determine HIV-1/2, Abbot Laboratories, Tokyo, Japan
and Oraquick, Orasure Technologies, Bethlehem, PA,
USA). During the MDP feasibility study, the Abbot IMX
ELISA test (Abbot Diagnostic s, Africa Division), in com-
bination with the Vironostika HIV1/2 ELISA for positive
and equivocal results, was used on whole blood source d
from venepuncture. Only women who had a test result
and geographical data were included in the study.
The main eligibility criteria were consistent across the
trials and included: being sexually active; being HIV
negative at screening at inclusion; willingness to provide
written consent and follow study procedure; not being
pregnant and with intention to maintain this status; and
residing in and around the study area for a minimum of
one year. At all visits, all participants received counsel-
ling on risk reduction and as many male condoms as
desired. Counsellors emphasized that condoms are the
Wand and Ramjee Journal of the International AIDS Society 2010, 13:41
/>Page 2 of 9
only known method to prevent HIV and sexually trans-
mitted infections ( STIs), and that condoms should be
used for every act of sex.
Women who were identified as HIV positive at
screening were referred to local health care facilities for
care and support. Women who seroconverted during
the trial remained in the study and were provided with
ongoing counselling and referred to local health care
facilities for further care at the end of the study. The
protocol and informed consent forms were approved by
the respective ethics committees at each site.
Spatial scan methodology
The geographical data obtained from GIS/GPS techni-
ques were used to determine the potential areas with an
excess of HIV infection by using the Spatial Scan Statis-
tics (SaTScan) programme developed by Kulldorf [15].
This has become the most widely used test for cluster-
ing in recent years, both because of its efficacy in
detecting single “hotspots”, as well as availability of the
free software package [16] for implementing the test.
The basic idea is to allow circular windows of various
sizes to range across the study region; at each location,
the rate of disease inside the window is compared with
that outside of it.
A Poisson-based model was chosen, where the num-
ber of HIV counts in an area is Poisson distributed
according to a known underlying population at risk.
Under the Poisson assumption, the likelihood function
for a specific window is proportional to:
c
Ec
Cc
CEc
I
Cc
[] []
⎛
⎝
⎜
⎞
⎠
⎟
−
−
⎛
⎝
⎜
⎞
⎠
⎟
−
where C is the total number of cases, c is the observed
number of cases within the window , and E[c] is the cov-
ariate adjusted expected number of cases within the
window under the null hypothesis. Since the analysis is
conditioned on the total number of cases observed, C- E
[c] is the expected number of cases outside the window.
I is an indicator function. When SaTScan is set to scan
only for clusters with high r ates, I is equal to 1 when
the window has more cases than expected under the
null-hypothesis, and 0 otherwise.
For a given zone (circular window), the methodology
calculates the probability of a data point being a c ase
inside or outside the circle under consideration. For
each circle, a likelihood ratio is computed for the alter-
native hypothesis that there is an increased risk of dis-
easeinsidethecircle,againstthenullhypothesisthat
the risk inside the circle is the same a s that outside. In
this context, a cluster or hotspot is said to be detected
within a defined geographical area during a specific
timeframe if the area has a disproportionate excess of
HIV cases when compared with neighbouring areas
under study.
By meeting the statistical assumptions of a set of sta-
tistical models, an unusual rise or reduction in cases in
a specific spatial area can be characterized by statistical
significance. The sets of potential clusters are then rank-
ordered according to the magnitude of t heir likelihood
ratio test statistics.
Once the null hypothesis is rejected and clusters are
formed, this means that the number of HIV infections
detected in this region is significantly different from
those in other study areas. Socio-demographic and beha-
vioural characteristics of the women within these hot-
spots were c ompared with those of women outside of
them. Cluster detection analysis was restricted to the
“spatial option” only because the temporal variation in
this study was not large enough to detect any temporal
clusters.
The user-defined maximum radius used by SaTScan
was set to its default value of 50%, as recommended by
Kulldorf [17] as optimal. In order to investigate the sen-
sitivity of SaTScan results to the default setting, we ran
the SaTScan spatial scan statistics 10 times, starting
with a maximum size of 5% and increasing the para-
meter by an inter val of 5% with each run until reaching
the default maximum size value of 50%. Results were
not affected by the choice o f radius selected; we there-
fore used the default value of 50% in our analysis.
The Chi-square test was used to compare differences
in proportions, and Student’ s t test (a nonparametric
test) to compare differences in continuous variables.
Calculations were carried out using SaTScan version
8.0 , and results were imported
into the Stata (Version 10.0, CS, TX) software environ-
ment to compare the characteristics of cluster (hotspots)
and non-cluster areas.
Results
As described earlier, o ur study included women who
consented to participate in one of three studies from six
clinic sites and 158 census locations, from among a total
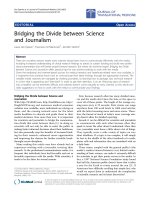
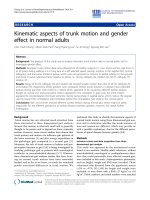
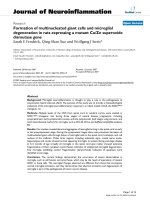
black female population of ~2,400,000. Figure 1 presents
the location of the study areas. The geographical data of
a total of 2369 women who tested positive for H IV
infection at a follow-up screening were used to deter-
mine high HIV prevalence areas. Added to this were
211 women who were HIV negative at screening but
who seroconverted during follow up.
Hotspots of increased HIV prevalence
Table1showstheresultsfromtheSaTScantestsfor
significant spatial clustering in terms of HIV prevalence,
after adjusting for size of the underlying population at
risk and for age.
Wand and Ramjee Journal of the International AIDS Society 2010, 13:41
/>Page 3 of 9
Analysis identified three hotspots or cluste rs of preva-
lence, a nd these included 458 cases (19% of all)
recruited at two study sites: a less urbanized clinic in
Botha’ s Hill and a peri-urban clinic in Umkomaas.
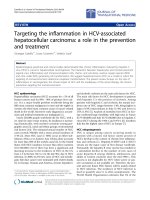
These three hotspots were determined to be areas of
particularly high prevalence when compared with other
study sites (Verulam, Tongaat, Hlabisa and Durban)
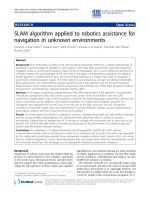
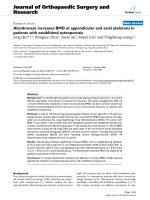
(Figure 2).
In one cluster, 144 (31%) HIV cases were determined
tobecentredwithina4.5kmradiusinInchangaand
Hammersdale (relative risk [RR] = 34.70, p = 0.001), wes t
of Durban. The second cluster included 168 (37%) HIV
cases within a 32 km radius in the south of Durban, from
the three residential areas of Umzinto, Molweni and
Mtwalume (RR = 2.4, p = 0.001). Like the first, the third
cluster was again located west of Durba n, with 146 (32%)
HIV cases (RR = 10.1, p = 0.001) in residential areas
encompassing Hillcrest and Botha ’s Hill.
Distribution of the demographic characteristics and
reported sexual behaviour of women who fell within the
cluster areas or hotspots were compared with those who
did not (Table 2).
Women who fell within one of the three hotspots
were similar in terms of age (p = 0.548) and education
level(p=0.481)tothosewho did not. Proportions of
women were similar bet ween those in the ho tspots and
those who were not in terms of those living with a regu-
lar sex partner (p = 0.301], age at first sex < 17 years
Table 1 SaTScan test results for significant spatial clustering in terms of HIV prevalence among sexually active women
after adjusting for size of the underlying population at risk and for age
Potential clusters* Radius (km) Prevalence of HIV (%) Total women tested Relative risk of excess HIV cases p-values
Cluster No. 1 4.5 56.0 315 34.6 0.001
Cluster No. 2 32.0 51.0 569 2.4 0.001
Cluster No. 3 3.7 39.0 59 10.1 0.001
*1 - Inchanga, Hammersdale (west of Durban); 2 - Mthwalume, Umzinto, Molweni (south of Durban); 3 - Hillcrest, Botha’s Hill (west of Durban).
Figure 1 Study locations.
Wand and Ramjee Journal of the International AIDS Society 2010, 13:41
/>Page 4 of 9
(p = 0.270), being diagnosed with an STI (chlamydia,
gonorrhoea, syphilis or Trichomonas vaginalis)(p=
0.987) and current contraceptive use (p = 0.835).
The proportio n of w omen who reported being legally
married was significantly higher among those outside
the hotspots than within them (16% vs. 12%, p = 0.001).
Significantly more women in the geographical hotspots
reported being Christian (94% vs. 90%, p < 0.001) and
speaking Zulu at home (91% vs. 86%, p < 0.001) com-
pared with those in non-cluster areas.
More women within the hotspots reported having sex
an average of three or more times per week (27% vs.
20%, p < 0.001) and to having three or more sexual
partners in their lifetime (55% vs. 45%, p < 0.001) com-
pared with those outside the hotspots. Also, significantly
more women within the hotspots were diagnosed with
genital herpes simplex virus type 2 (HSV-2) than those
not in these areas (77% vs. 71%, p < 0.001).
Hotspots of HIV incidence
A total of 2523 HIV-positive women enrolled in the
three studies were eligible, with a median duration of
follow up of 12 months. Of these, 211 had serocon-
verted during the follow-up period (incidence rate
Figure 2 Geographical locations of clusters (high prevalence and high incidence of HIV). Inchanga and Hammersdale: High prevalen ce
and high incidence (Durban West). Hillcrest and Botha’s Hill: High prevalence and high incidence (Durban West). Camperdown and Cato-Ridge:
High incidence (Durban West). Umkomaas and Mkomanzi: high incidence (Durban South).
Wand and Ramjee Journal of the International AIDS Society 2010, 13:41
/>Page 5 of 9
6.6/100 women-years). Using the SaTScan pr ogramme,
and adjusting for the underlying population at risk and
age, a total of 48 of the women who seroconverted (22%
of all HIV seroconversions) were geographically clus-
tered into four hotspots (Table 3). Two of these clusters
overlapped with the high HIV prevalence hotspots
located west of Durban.
The highest incidence of HIV infection was observed
in a hotspot that comprised two census areas west of
Durban, namely Inchanga and Hammersdale, encom-
passing a radius of 4.5 km (RR = 22.1, p < 0.001). The
second hotspot included Camperdown and Cato Ridge
(RR = 19.4, p < 0.001) and another included Hillcrest
and Botha’s Hill (RR = 9.2, p < 0.001), both located west
of Durban, within 4.3 km and 3.73 km radii, respec-
tively. The fourth hotspot included Umkomaas and
Mkomanzi (RR = 11.8, p < 0.001) south of Durban.
Discussion
Our study identified three localized hotspots of high
HIV prevalence; two of these were exclusively located
west of Durban and included women from two of the
clinical sites. In addition, four hotspots of high HIV
incidence were found, two of which overlapped with
high HIV prevalence areas and also comprised census
areas west of Durban.
Table 2 Characteristics of sexually active women who fell within the hotspots compared with those who did not
Screening characteristics Inside the clusters Outside the clusters P value
HIV positive 49% 39% < 0.001
Age (yrs) 0.548
≤ 24 40% 42%
25-34 38% 36%
35+ 22% 22%
Less than high school education 27% 26% 0.481
Married 12% 16% 0.001
Living with a regular partner 29% 31% 0.301
Language of screening form
English 8% 13% < 0.001
Zulu 91% 86%
Other 1% 1%
Religion (Christian) 94% 90% < 0.001
Lifetime number of sexual partners < 0.001
1 20% 26%
2 25% 29%
3+ 55% 45%
Age at first sex < 17 yrs 87% 86% 0.270
Coital frequency (≥ 3 times/week) 27% 20% < 0.001
Tested positive for STIs 16% 16% 0.987
Chlamydia 9% 9% 0.600
Gonorrhea 3% 3% 0.853
Trichomonas vaginalis 6% 6% 0.864
Tested positive for HSV2 at screening 77% 71% < 0.001
Current contraceptive use at screening
1
78% 78% 0.835
Information on condom use was not available at the screening.
1
Any of the following: long term (vasectomy, tubal ligation, “Jadel”, “Norplant”, “Noplant”, “removed uterus”), injectable hormones, the pill, barrier (male/female
condoms) and other/none.
Table 3 Distribution of cases of HIV seroconversion during follow up that fell into four clusters (n = 48)
Potential clusters* Radius (km) Total women tested Relative risk of excess HIV cases p-values Total locations
Cluster No. 1 4.5 137 22.1 0.001 2
Cluster No. 2 4.3 31 19.4 0.001 2
Cluster No. 3 2.6 260 11.8 0.001 2
Cluster No. 4 3.7 26 9.2 0.001 2
1 - Inchanga, Hammersdale (west of Durban); 2 - Camperdown, Cato Ridge (west of Durban); 3 - Umkomaas, Mkomanzi (south of Durban);
4 - Hillcrest, Botha’s Hill (west of Durban).
Wand and Ramjee Journal of the International AIDS Society 2010, 13:41
/>Page 6 of 9
The Spatial Scan Statistics programme was used to
investigate geographical patterns and variatio ns in HIV
prevalence within the relatively homogeneous popula-
tion. Strong statistical evidence of clustering of HIV
infections in communities of Durban was found. This
supports the notion that risk factors for HIV might be
associated with certain specific socio-e conomic charac-
teristics, which could be targeted to improve existing
public health prevention measures aimed at the general
population.
Prevalence of HIV infection in South Africa has always
been reported either on a national basis or as a provincial
average [2]. While it is necessary and important to report
these figures at national level, such aggregate estimates
may mask the spatial hete rogen eity of the HIV epidemic.
Hence, national level prevalence rates may not reveal the
full impact of the epidem ic on different geographical
regions. It is evident, as this study indicates, that the epi-
demic should be monitored in a localized way so that
more effective prevention strategies may be utilized. This
is particularly urgent and necessary in a region such as
KwaZulu-Natal, where the epidemic continues its ram-
pant pace with devastating impact.
The results from this study support the conclusion that
risks for HIV infection are associated with definable
socio-demographic factors, which may be fundamental
ecological units of HIV transmission [10]. A multitude of
other factors may have an impact in these mostly rural or
peri-rural settings, creating a context in which the impact
of geographical factors and sexual behaviours on HIV
prevalence and incidence may be particularly relevant.
The spatial clustering of HIV cases was found to be
related to certain demographic and risk behaviours.
Number of male sexual partners was not collected in
this study; how ever, being s ingle, combined with high
frequency of sexual acts, gives strong evidenc e for those
women having multiple partners, as well as possibly
engaging in transactional sex.
These results may be due to fundamental differences
between the communities with regard to health care
centres, population density and other socio-economic
factors. These data provide new evidence to support the
need to investigate potenti al sources of infection and to
study transmission patterns in the community in order
to apply relevant interventions for prevention of this
devastating disease.
Our data suggest strategies for targeted control and
for prioritization of scarce resources. A community-
based prevention programme could be formulated to
educate residents in these endemic areas about the risks
associated with HIV and other high-risk sexual
behaviours.
Information on the spatial distribution of populations
and services is essential to understand access to health
services. There should be specially focused strategies to
optimize health care for people living in the high-risk
areas. Spatial analysis is an important tool for monitoring
the HIV ep idem ic, predicting futu re treatment demands,
and targeting areas for public health interventions. The
mapping of areas of high HIV prevalence will aid commu-
nity interventions, such as education, prevention, treat-
ment and care, and optimum location of referral health
centres.
Thestrengthofourstudyisthatwewereabletouse
data from a region that is at the epicentre of the HIV
epidemic in South Africa, if not the world, to determine
core areas of the epidemic.
Our study has some limitations that need to be con-
sidered in the interpretation of the results. First, because
of the nature of the research conducted in these trials,
populations selected were known to be moderate-to-
highriskofHIVinfection.Althoughwewereableto
target women from different communities in different
settings (rural, semi-rural and urban), the women in this
study may not necessarily be representative of women in
the KwaZulu-Natal province. Second, this analysis is
that sexual networks may be subject to temporal trends,
which we were not able to determine. Third, we were
unable to co llect any sexual behaviour data from male
partners of the women, which can have a substantial
impact on the results. T herefore, additional research is
required to fully understand the reasons for these spatial
variations in HIV infections in this region, and impor-
tant insights will be gained by further in-depth study of
the communities identified in this study.
Another limitation of the approa ch used in the present
study is the circular nature of the SaTScan window;
SaTScan identifies clusters by imposing circular windows
on maps and allowing the size of these to vary between
zero and a preset upper limit. Although this may work
well on maps that show relatively large geographical
units (such as those used in the present study), it may
not work as well on a smaller scale, where neighbour-
hood-level geographical barriers, such as rivers or train
tracks, could create non-circular interaction patterns.
However, the Spatial Scan Statistics employed in the pre-
sent study has higher statistical power than other geosta-
tistical methods and has been widely applied to the
detection of clustering of diseases [18-21].
Conclusions
We investigated spatial and demographic variations in
HIV infection in small communities in KwaZulu-Natal,
South Africa, making use of a cohort of women
recruited for various trials through population-based
clinics. HIV prevalence rates have always been higher in
KwaZulu-Natal than in any other province in South
Africa, and this trend has been sustained since the early
Wand and Ramjee Journal of the International AIDS Society 2010, 13:41
/>Page 7 of 9
1990s. Our findings are consistent with previous work in
this population [2,3,9]. However, our results also showed
considerable variation within the province of KwaZulu-
Natal, which cannot be detected in an aggregated data.
An understanding of geographical variation and deter-
mination of the core areas of the disease may provide
an explanation regarding possible proximal and distal
contributors to the HIV/AIDS epidemic. It is more
urgent than ever to determine and target the specific
communities that are most in need of education, pre-
vention and treatment activities.
This study provides a first attempt to visually and
quantitatively describe the geographical characteristics
of HIV infections in a region where the disease is
known to be ramp ant. The results may inform develop-
ment of prevention programmes to address the HIV epi-
demic while considering those groups most affected
differentially by geographical area.
Investigating the geographical structure of the HIV
epidemic in sparsely populated, large geographical areas
is challenging, if not impossible. There needs to be
urgent public demand for monitoring at l ocalized level,
designating the resources carefully to those places where
the infection is clustered. We provide evidence of clus-
ters of particularly vulnerable women through research
ontheprevalenceandincidenceofHIVinoursetting,
and would urge the authorities to provide a rapid
response by scaling up HIV prevention, treatme nt and
care efforts in all these communities.
Acknowledgements
Dr Wand was funded by Australian Research Council (DP1093026). The
National Centre in HIV Epidemiology and Clinical Research is funded by the
Australian Government, Department of Health and Ageing. The views
expressed in this publication do not necessarily represent the position of the
Australian Government. NCHECR is affiliated with the Faculty of Medicine.
We gratefully acknowledge the women who participated in the studies and
Ms Leverne Gething and Dr Claire Whitaker for assistance in the preparation
of the final manuscript. We acknowledge funding and support for the
various studies from the UK Department for International Development and
the Medical Research Council (MDP Feasibility Study: Grant number
G0100137); the Bill & Melinda Gates Foundation (MIRA: Grant number
21082); and the Division of AIDS, NIH (HPTN 055: Grant U01 AI048008). We
would also like to thank the principal investigators/protocol chairs of the
studies: Dr Sheena McCormack, Dr Nancy Padian, Prof Saidi Kapiga and Prof
Stephen Weiss.
Author details
1
National Centre in HIV Epidemiology and Clinical Research, Sydney,
Australia.
2
HIV Prevention Research Unit, Medical Research Council, Durban,
South Africa.
Authors’ contributions
Both authors contributed to the manuscript, and saw and approved the final
version. HW carried out the analyses and drafted the manuscript. GT
participated in the design of the study and drafted the manuscript. Both
authors read and approved the final manuscript.
Competing interests
The authors declare that they have no competing interests.
Received: 18 May 2010 Accepted: 27 October 2010
Published: 27 October 2010
References
1. UNAIDS: 2008 Report on the global AIDS epidemic 2008 [ids.
org/en/KnowledgeCentre/HIVData/GlobalReport/2008], Accessed 18
November 2008.
2. Shisana O, Rehle T, Simbayi LC, Zuma K, Jooste S, Pillay-Van-Wyk V,
Mbelle N, Van Zyl J, Parker W, Zungu NP, Pezi S, the SABSSM III
Implementation Team: South African national HIV prevalence, incidence,
behaviour and communication survey 2008: A turning tide among teenagers?
Pretoria: HSRC Press 2009.
3. Kleinschmidt I, Pettifor A, Morris N, MacPhail C, Rees H: Geographic
Distribution of Human Immunodeficiency Virus in South Africa. American
Journal of Tropical Medicine Hygiene 2007, 77(6):1163.
4. Lederman MM, Offord RE, Hartley O: Microbicides and other tropical
strategies to prevent vaginal transmission oh HIV. Nature Reviews
Immunology 2006, 6:371-382.
5. Nunn A, McCormack S, Crook A, Pool R, Rutterford C, Hayes R: Microbicides
Development Programme: Design of a phase III trial to measure the
efficacy of the vaginal microbicide PRO 2000/5 for HIV prevention. Trials
2009, 10:99.
6. Abdool Karim S, Coletti A, Richardson B, Ramjee G, Hoffman I, Chirenje M,
Taha T, Kapina M, Maslankowski L, Soto-Torres L: Safety and effectiveness
of vaginal microbicides BufferGel and 0.5% PRO 2000 gel for the
prevention of HIV infection in Women: Results of the HPTN 035 trial
(Abstract). 16th Conference on Retroviruses and Opportunistic Infections
Montreal, Canada 2009.
7. Alcorn K: Disappointment as microbicide fails to protect against HIV 2009
[ />31388001230F.asp], NAM, AIDS map.
8. Amar-Roze JM: Geographic inequalities in HIV infection and AIDS in sub-
Saharan Africa. Soc Sci Med 1999, 36(10):1247-1256.
9. Remy G: Epidemiologic distribution of HIV-2 human immunodeficiency
virus infection in sub-Saharan Africa. Med Trop (Mars.) 1993, 53:511-516.
10. Tanser F, Barnighausen T, Cooke GS, Newell M-L: Localized spatial
clustering of HIV infections in a widely disseminated rural South African
epidemic. International Journal of Epidemiology 2009, 38(4):1008-1016.
11. Aamodt G, Samuelsen SO, Skrondal A: A simulation study of three
methods for detecting disease clusters. International Journal of Health
Geographics 2006, 5:15.
12. Padian NS, van der Straten A, Ramjee G, Chipato T, de Bruyn G,
Blanchard K, Shiboski S, Montgomery ET, Fancher H, Cheng H,
Rosenblum M, van der Laan M, Jewell N, McIntyre J, MIRA Team:
Diaphragm and lubricant gel for prevention of HIV acquisition in
southern African women: a randomised controlled trial. Lancet 2007,
370:251-261.
13. Gappoo S, Naidoo S, Ramjee G, Guddera V, Raju E: HSV2 Prevalence
Amongst Women Participating in HIV Prevention Studies in rural
communities in Durban, South Africa - Urgent need for Microbicide
Product to be Active Against HSV2 [Abstract AB14]. Microbicides 2006
Conference Durban, South Africa.
14. Ramjee G, Kapiga S, Weiss S, Peterson L, Leburg C, Kelly C, Masse B, HPTN
055 Study Team: The value of site preparedness studies for future
implementation of phase 2/IIb/III HIV prevention trials: experience from
the HPTN 055 study. J Acquir Immune Defic Syndr 2008, 47:93-100.
15. Kulldorf M, Song C, Gregoria D, Samociuk H, DeChello L: Cancer map
patterns: are they random or not? Am J Prev Med
2006, 30:s37-s49.
16. Kulldorf M: SaTScan 7.0: Software for the spatial and space-time scan
statistics: Information Management Services Inc 2006.
17. Kulldorf M: Geographical distribution of sporatic Creutzfeldt-Jacob
Disease in France. International Journal of Epidemiology 2002, 31:495-496.
18. Kulldorf M, Zhang Z, Hartman J, Heffernan R, Huang L, Mostashari F:
Benchmark Data and Power Calculations for Evaluating Disease
Outbreak Detection Methods. MMWR 2004, 53:144-151.
19. Song C, Kulldorf M: Power evaluation of disease clustering tests.
International Journal of Health Geographics 2003, 2:9.
20. Nunes C: Tuberculosis incidence in Portugal: spatiotemporal clustering.
International Journal of Health Geographics 2007, 6:30.
Wand and Ramjee Journal of the International AIDS Society 2010, 13:41
/>Page 8 of 9
21. Ryan JR, Mbui J, Rashid JR, Wasunna MK, Kirigi G, Magiri C, Kinoti D,
Ngumbi PM, Martin SK, Odera SO, Hochberg LP, Bautista CT, Chan AS:
Spatial clustering and epidemiological aspects of visceral Leishmaniasis
in two endemic villages, Baringo District, Kenya. American Journal of
Tropical Medicine and Hygiene 2006, 74(2):308-317.
doi:10.1186/1758-2652-13-41
Cite this article as: Wand and Ramjee: Targeting the hotspots:
investigating spatial and demographic variations in HIV infection in
small communities in South Africa. Journal of the International AIDS
Society 2010 13:41.
Submit your next manuscript to BioMed Central
and take full advantage of:
• Convenient online submission
• Thorough peer review
• No space constraints or color figure charges
• Immediate publication on acceptance
• Inclusion in PubMed, CAS, Scopus and Google Scholar
• Research which is freely available for redistribution
Submit your manuscript at
www.biomedcentral.com/submit
Wand and Ramjee Journal of the International AIDS Society 2010, 13:41
/>Page 9 of 9