báo cáo hóa học:" Alternative antiretroviral monitoring strategies for HIV-infected patients in east Africa: opportunities to save more lives?" potx
Bạn đang xem bản rút gọn của tài liệu. Xem và tải ngay bản đầy đủ của tài liệu tại đây (611.3 KB, 13 trang )
RESEARCH Open Access
Alternative antiretroviral monitoring strategies for
HIV-infected patients in east Africa: opportunities
to save more lives?
R Scott Braithwaite
1*
, Kimberly A Nucifora
1
, Constantin T Yiannoutsos
2
, Beverly Musick
2
, Sylvester Kimaiyo
3
,
Lameck Diero
3
, Melanie C Bacon
4
and Kara Wools-Kaloustian
5
Abstract
Background: Updated World Health Organization guidelines have amplified debate about how resource
constraints should impact monitoring strategies for HIV-infected persons on combination antiretroviral therapy
(cART). We estimated the incremental benefit and cost effectiveness of alternative monitoring strategies for east
Africans with known HIV infection.
Methods: Using a validated HIV computer simulation based on resource-limited data (USAID and AMPATH) and
circumstances (east Africa), we compared alternative monitoring strategies for HIV-infected persons newly started
on cART. We evaluated clinical, immunologic and virologic monitoring strategies, including combinations and
conditional logic (e.g., only perform virologic testing if immunologic testing is positive). We calculated incremental
cost-effectiveness ratios (ICER) in units of cost per quality-adjusted life year (QALY), using a societal perspective and
a lifetime horizon. Costs were measured in 2008 US dollars, and costs and benefits were discounted at 3%. We
compared the ICER of monitoring strategies with those of other resource-constrained decisions, in particular earlier
cART initiation (at CD4 counts of 350 cells/mm
3
rather than 200 cells/mm
3
).
Results: Monitoring strategies employing routine CD4 testing without virologic testing never maximized health
benefits, regardless of budget or societal willingness to pay for additional health benefits. Monitoring strategies
employing virologic testing conditional upon particular CD4 results delivered the most benefit at willingness-to-pay
levels similar to the cost of earlier cART initiation (approximately $2600/QALY). Monitoring strategies employing
routine virologic testin g alone only maximized health benefits at willingness-to-pay levels (> $4400/QALY) that
greatly exceeded the ICER of earlier cART initiation.
Conclusions: CD4 testing alone never maximized health ben efits regardless of resource limitations. Programmes
routinely performing virologic testing but deferring cART initiation may increase health ben efits by reallocating
monitoring resources towards earlier cART initiation.
Background
Considerable debate exists about how resource constraints
should impact laboratory monitoring for HIV-infected
patients on combination antiretroviral therapy (cART)
[1-6]. This lack of consensus is re flected in the equivocal
language about laboratory monitoring in 2010 recommen-
dations by the World Health Organizatio n (WHO) [7].
WHO recommends using viral load testing every six
months to detect viral replication, but only “conditionally”
and “where routinely available” .WhileWHO“strongly”
recommends use of viral load “to confirm treatment fail-
ure”, this rec ommendation is also fol lowed by the condi-
tional statement, “where routinely available” [7]. While
this equivocal language of these recommendations may be
interpreted as a pragmatic concession to resource con-
straints, it is important to note that no equivalent language
was used in WHO recommendations for earlier cART
initiation, even though this guideline is e qually, if not
* Correspondence:
1
Section on Value and Comparative Effectiveness, Department of Medicine,
New York University School of Medicine, New York, NY, USA
Full list of author information is availabl e at the end of the article
Braithwaite et al. Journal of the International AIDS Society 2011, 14:38
/>© 201 1 Braithwaite et al; licensee BioMed Central Ltd. This is an Open Acces s article distributed under the terms of the Creative
Commons Attribution License (http ://creativecommons.org/licenses/by/2.0), which permits unrestricted use, distribution, and
reproduction in any medium, provide d the original work is properly cited.
more, impacted by resource constraints. For these reasons,
the 2010 WHO recommendations are likely to amplify
debate on the importance of routine viral load testing
compared with other resource-constrained decisions. Pub-
lished data are insufficient to guide this decision [1-6,8,9].
Published decision models have broadly suggested that
laboratory monitoring delivers less favourable value than
alternative resource allocations [5,10,11]. However, these
models have important limitations of their own: (1) fail-
ure to consider a wide range of monitoring strategies,
such as conditionally dependent strategies (e.g., only
check a viral load if CD4 result meets predefined cri-
teria); (2) failure to consider widely varying scenarios
regarding number o f cART regimens and their sequen-
cing (e.g., monitoring would be expected to confer
greater benefit when more regimens are available,
because the information is more useful); (3) failure to
compare results with other resource-constrained deci-
sions (e.g., earlier cART initiation), asking if more lives
could be saved by alternative resource expenditures; and
(4) failure to use data from resource-limited settings,
thus limiting their generalizability.
We have previously developed and validated a computer
simulation model of HIV progression in resource-rich set-
tings [12-15]. Our model explicitly represents the two
main reasons for cART failure, genotypic resistance accu-
mulation and non-adherence, and therefore is equipped to
explore important tradeoffs involved in more versus less
aggressive monitoring strategies. For example, a more
aggressive monitoring str ategy may result in treatment
changes that suppo rt greater virologic suppression in the
short term, but may exhaust available regimens in the long
term . For the current report, we have redesigned and re-
calibrated this model for resource-limited settings. Its
design now permits consideration of widely varying moni-
toring strategies, including conditional strategies, under
different scenarios regarding numbers and sequences of
cART regimens.
Methods
We used a computer model to simulate alternative
laboratory monitoring strategies for HIV-infected
patients on cART in east Africa, and to compare the
value of th ese strategies with alternative resourc e alloca-
tion options, such as earlier cART i nitiation. This model
has been previously validated by demonstrating its ability
to predict clinical data describing survival, time until
cART failure, and accumulation of resistance mutations
in distinct observational cohorts [12-15].
This simulation has been revised: (1) to allow specifica-
tion of a wide variety of possible monitoring strategies;
(2) to allow calibration using data from resource-limited
settings; and (3) to consider a specifiable number of
cART regimens or a specifiable number of drugs within
each cART category (and can “ run out” of regimens
when intolerance and/or resistance has devel oped to all).
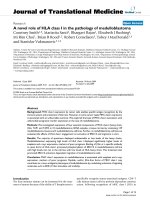
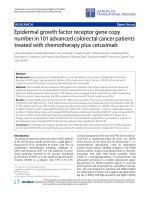
The simulation is a stochastic, second-order Monte Carlo
progression model that explicitly represents the two main
determinates of treatment failure: accumulation of geno-
typic resistance and cART non-adherence and/or intoler-
ance (Figure 1). A key advantage of this design is that it
can compare tradeoffs in aggressiveness of treatment ver-
sus intensiveness of monitoring. The methods underlying
the revision of this simulation and its calibration are
described in more detail in the Appendix (Additional
file 1), and the results of the calibration are described in
Additional file 1, Figure S1.
Analytic approach: comparison with simultaneous
resource-constrained decisions
We sought to identify “efficient frontiers”, defined as
those strategies delivering the greatest health benefit
given a plausible budget scenario [16,17]. Strategies
within an efficient frontier confer the greatest b enefit
for a specified budget. Strategies outside this frontier are
unable to deliver the greatest benefit regardless of bud-
get, and therefore are not preferred choices regardless of
available resources.
We identified efficient frontiers by calculating the
incremental cost-effectiveness ratio (ICER) of each moni-
toring strategy. ICERs measure the additive benefit of
each strategy compared with its next best alternative, and
interpret this benefit together with its a dditive cost. The
ICER compares different choices in a syst ematic, quanti-
tative manner, placing them “on a level playing field” ,
and providing a widely used quantitative measure of
value. Higher ICERs (meaning a greater cost p er addi-
tional benefit) are less favourable, corresponding to lower
value. Lower ICERs (meaning a lower cost per addit ional
benefit) are more favourable, corresponding to higher
value. ICERs are useful for informing resource allocation
decisions because reallocating resources from a numeri-
cally higher (less favourable) ICER towards a numerically
lower (more favourable) ICER can increase health bene-
fits without requiring additional resources. We per-
formed all analyses from a societal perspective using a
lifetime time horizon. All costs and benefits were mea-
sured in US dollar (USD) values for 2008 and were dis-
counted at an annual rate of 3%. In all cases, we followed
recommendations of the US Panel on Cost-Effectiveness
in Health [18]. We simulated cohorts of 1,000,000, with a
one-day cycle time (the minimum time interval over
which patient characteristics could change).
Considerable debate exists over acceptable value
“thresholds” and their appropriate variation with resource
constraints [19]. To aid interpretation of our ICER results
for different monitoring strategies, we used our simula-
tion to estimate ICER results for other common,
Braithwaite et al. Journal of the International AIDS Society 2011, 14:38
/>Page 2 of 13
resource-constrained decisions (e.g., initiation of cART at
CD4countsof350cells/mm
3
ver sus 200 cells/mm
3
,and
whether to make second- and third-line cART regimen s
routinely available).
Base case analyses
We compared the downstream effects of alternative
monitoring strategies on HIV-positive patients newly
started on cART. In accord with the USAID-AMPATH
experience, we assumed that the first cART regimen
was nevirapine in combination with two nucleoside
reverse transcriptase inhibi tors. Distributions of age, sex
and CD4 count at cART initiation were based on char-
acteristics of patients enrolled in USAID-AMPATH
(Table 1). We did not p erform distinct analyses for
women who were exposed to single-agent prophylaxis
for mother to child transmission; however, the impact
of nevirapine resistance was explored in a sensitivity
analysis.
We evaluated a matrix of different monitoring strate-
gies: type of monitoring (clinical versus CD4 versus viro-
logic versus combinations and conditional strategies);
viral load threshold for switching (500, 1000, 5000, and
10,000 copies/ml); and frequency of monitoring (three,
six and 12 months). Clinical monitoring was defined as
evaluation by a health professional for signs and symp-
toms of AIDS [20]. We deliberately constructed a broad
matrix of options that included some strategies that are
not guideline recommended at the current time, but
which might seem like plausible alternatives (for exam-
ple, obtaining routine viral load without routine CD4
counts).
Because space limitations preclude the presentation of
the numerous strategies that we evaluated, we focus on
results from the subse t of strategies on the efficient fron-
tier. We first identified efficient frontiers for scenarios
with two and three available cART regimens. W e then
identified the efficient frontier f or a scenario that does
not specify a fixed number of cART regimens, but rather
allows the number of available cART regimens to vary.
We estimated outcomes of life years, quality-adjusted
life years (QALY), and costs (USD). QALYs are a prefer-
ence-weighted metric that incorporate both quantity and
quality of life, and reflect the idea that a year of poor-
quality life is valued less than a year of high-quality life
[18].
Viral
replication
HIV mutations
cART
resistance
cART
non-adherence
cART
effectiveness
Viral load CD4 count
DEATH FROM HIV/AIDS
DEATH FROM
OTHER CAUSES
Patient
characteristics
NON-ADHERENCE
INTERVENTIONS
Non-adherence
risk factors
Figure 1 Schematic of constructs in computer simulation.
Braithwaite et al. Journal of the International AIDS Society 2011, 14:38
/>Page 3 of 13
Table 1 Inputs in computer simulation
Variable Base case Plausible range in
sensitivity analysis
Source
Characteristics of simulated cohort
Age 39 (SD 9) NA AMPATH
CD4 count (cells/mm
3
) 126 (SD 127) NA AMPATH
Viral load (Log 10 units) 4.5 (SD 1) NA AMPATH
% Male 38% NA AMPATH
Initial cART regimen Nevirapine + either ziduvidine or
stavudine + other NRTI
NA AMPATH
Second cART regimen Boosted PI + two other NRTIs other
than those in initial regimen
NA AMPATH
Probabilities and rates
Compliance with cART (proportion of doses taken as directed) 0.85 0.75-0.95 Imputed from
calibration
Probability that mutation potentially causing resistance, results
in resistance, NRTI or PI
0.50 Varied jointly from 0.5X to
1.5X, bounded by 0 and 1
Johnson et al
[21]
Probability mutation potentially causing resistance, results in
resistance, NNRTI
0.90 Varied jointly from 0.5X to
1.5X, bounded by 0 and 1
Johnson et al
[21]
Probability of cross-resistance to other NRTI, given NRTI
mutation conferring resistance (ziduvidine or stavudine)
1.0 Varied jointly from 0.5X to
1.5X, bounded by 0 and 1
Johnson et al
[21]
Probability of cross-resistance to other NRTI, given NRTI
mutation conferring resistance (other)
0.48 Varied jointly from 0.5X to
1.5X, bounded by 0 and 1
Johnson et al
[21]
Probability of cross resistance to other PI, given PI mutation
causing resistance
0.24 Varied jointly from 0.5X to
1.5X, bounded by 0 and 1
Johnson et al
[21]
Probability of cross resistance to other NNRTI, given NNRTI
mutation causing resistance
0.88 Varied jointly from 0.5X to
1.5X, bounded by 0 and 1
Johnson et al
[21]
Rate of accumulating resistance mutations, per year 0.18 0.014-0.018 Braithwaite et
al [14]
Viral load decrement with cART consisting of 2 NRTIs +
efavirenz (100% adherence)
3.09 Varied jointly from -1 to +1 Braithwaite et
al [22]
Viral load decrement with cART consisting of 2 NRTIs +
nevirapine (100% adherence)
2.22 Varied jointly from -1 to +1 Braithwaite et
al [22]
Viral load decrement with cART consisting of boosted PI (100%
adherence)
2.68 Varied jointly from -1 to +1 Braithwaite et
al [22]
Augmentation in HIV-related mortality, multiplicative 1 Varied from 0.5X to 1.5X Assumption
Augmentation in non-HIV-related mortality, multiplicative 1 Varied from 0.5X to 1.5X Assumption
Utilities
Decrease in utility with cART 0.053 Varied jointly from -0.05 to
+0.05
Braithwaite et
al 2007 [23]
Utility with CD4 < 100 cells/mm
3
0.81 Varied jointly from -0.05 to
+0.05
Freedberg et
al 1998 [24]
Utility with CD4 between 100 cells/mm
3
and 199 cells/mm
3
0.87 Varied jointly from -0.05 to
+0.05
Freedberg et
al 1998 [24]
Utility with CD4 200 cells/mm
3
and above 0.94 Varied jointly from -0.05 to
+0.05
Freedberg et
al 1998 [24]
Costs (2008 US$)
Cost of outpatient care, annually, without cART ($/month) $288 Varied from 0.5X to 1.5X AMPATH
Cost of care per hospitalization $390 Varied from 0.5X to 1.5X AMPATH
Cost of cART, annually, first regimen $189 Varied from 0.5X to 1.5X AMPATH
Cost of cART annually, second regimen $1361 Varied from 0.5X to 1.5X AMPATH
Cost of cART annually, third regimen $3067 $1361 - $12,269 AMPATH, Red
Book [25]
Cost of viral load test $70.00 Varied from 0.5X to 1.5X AMPATH
Cost of CD4 test $11.20 Varied from 0.5X to 1.5X AMPATH
NA: not applicable; cART: combination antiretroviral therapy; NRTI: nucleoside reverse transcriptase inhibitor; PI: protease inhibitor; NNRTI: non-nucleoside reverse
transcriptase inhibitor.
Braithwaite et al. Journal of the International AIDS Society 2011, 14:38
/>Page 4 of 13
Sensitivity analyses
Because some strategies may be sufficiently close to an
efficient frontier that their exclusion is solely due to sta-
tistical uncertainty (from random variation in the
model), we performed sensitivity analyses in which the
cost and effectiveness estimates for each strategy were
varied over their 95% interpercentile range. In separate
sensitivity analyses, to assess the impact of biased inputs,
we varied all inputs to the model a cross their plausible
ranges, seeking to identify whether changes in model
input assumptions would lead to different strategies on
the efficient frontier.
Results
We evaluated alternative monitoring strategies: first for a
treatment scenario with two available cART regimens,
and then a treatm ent scenario with three available cART
regimens. In addition, we considered a scenario that does
not specify a fixed number of cART regimens, but rather
allows their number to vary. For all scenarios, we
assumed that cART would be started at a CD4 count of
200 cells/mm
3
, and we sought to identify strategies on
the “efficient frontier” (e.g., those that could deliver the
greatest health benefit given some budget or resource
constraint). Monitoring strategies lying outside this “effi-
cient front ier” cannot deliver the greatest benefit regard-
less of willingness to pay, and therefore should not be
preferred choices.
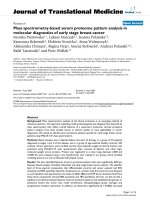
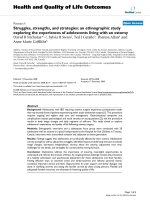
Scenario with two available cART regimens
When we explored a scenario in which two cART regi-
mens were available (Table 2, Figure 2), no laboratory
monitoring strategies employing routine CD4 monitor-
ing alone (e.g., CD4 count every six months) were on
the efficient frontier. Overall, these strategies did not
offer a good use of healthcare resources, because greater
benefit would be conferred by alternative strategies,
regardless of a programme’s budget or willingness to
pay for health benefits.
When willingness to pay remained limited to initiating
cART at a CD4 count of 200 cells/mm
3
rather than 350
cells/mm
3
, the efficient frontier was mostly comprised
Table 2 Value of alternative laboratory monitoring strategies compared with earlier treatment initiation, assuming two
antiretroviral regimens are available
Monitoring
strategy
Freq-
uency
(mo.)
Viral load
threshold for
switching ARV
(copies/
ml)
5-year outcomes Cost
($2008)
QALY ICER
($/QALY)
Value com-pared
with earlier
treatment
initiation*
Mean #
ARV
rounds
used
Mean
new
mut-
ations
Median
CD4
(cells/
mm
3
)
Median
HIV (log
units)
Clinical 3 N/A 1.26 1.02 270 2.66 11,490 10.681 N/A N/A
Viral load only if
CD4 meets WHO
criteria†
12 10,000 1.23 1.09 270 2.70 11,691 10.890 1,000 Same or better
Viral load only if
CD4 meets WHO
criteria†‡
12 500 1.27 1.06 270 2.66 12,060 10.948 6,400 Worse
Viral load¶ 12 10,000 1.33 1.02 277 2.69 13,308 11.125 7,100 Worse
Viral load 12 500 1.67 0.82 285 2.42 16,035 11.412 9,500 Worse
Viral load 6 500 1.69 0.81 286 2.40 17,087 11.446 30,900 Worse
Viral load 3 500 1.70 0.79 286 2.39 18,901 11.461 121,000 Worse
Mo.: months; QALY: quality-adjusted life year; ICER: incremental cost-effectiveness ratio.
* Earlier treatment initiation at CD4 of 350 cells/mm
3
compared with CD4 of 200 cells/mm
3
. “Better” value is indicated by a numerically lower ICER, and suggests
that health benefits would be increased if resources were allocated away from earlier treatment initiation towards this monitoring strategy. “Worse” value is
indicated by a numerically higher ICER, and suggests that health benefits would be increased if resources were allocated towards earlier ARV initiation away from
this monitoring strategy.
† WHO (World Health Organization) criteria for changing ARV regimen based on CD4 count
‡ Four strategies had ICERs that were not on the frontier but were sufficiently close to the frontier so that they were difficult to distinguish statistically. Three
employed the conditional strategy “viral load only if CD4 meets WHO criteria ” for: (1) frequency of 6 months and ARV switching threshold of 10,000 copies/mL
[ICER > = $2200/QALY]; (2) frequency of 6 months and ARV switching threshold of 500 copies/mL [ICER > = $4900/QALY]; and (3) frequenc y of 3 months and
ARV switching threshold of 10,000 copies/mL [ICER > = $6100/QALY. The fourth strategy was a CD4 alone strategy at a frequency of 12 months [ICER > = $5200/
QALY).
¶ One strategy had an ICER that was not on the frontier but was sufficiently close to the frontier so that it was difficult to distinguish statistically: a CD4 alone
strategy with a frequency of 6 months [ICER > = $6,500/QALY].
Results are only shown for strategies that maximized health benefits for some budget scenarios or willingness to pay for health benefits.
Braithwaite et al. Journal of the International AIDS Society 2011, 14:38
/>Page 5 of 13
of monitoring strategies that were structured condition-
ally, in which CD4 was obtained routinely and a fol low-
up viral load was only obtained if the CD4 count met
WHO criteria for immunologic failure. Conservative
monitoring frequencies (12 or six months rather than
three months) and switching thresholds (10,000 copies/
mL rather than 500 c opies/mL) were preferred. In
sensitivity analyses, only one strategy employing routine
CD4 monitoring alone (every 12 months) was close to
the efficient frontier.
As willingness to pay ros e beyond initiating cART at a
CD4 count of 350 cells/mm
3
rather than 200 cells/m m
3
,
the efficient frontier continued to be mostly comprised
of monitoring strategies that were structured
10.6
10.7
10.8
10.9
11.0
11.1
11.2
11.3
11.4
11.5
11.6
$11 $12 $13 $14 $15 $16 $17 $18 $19 $20
Quality adjusted life years
Total lifetime cost
(2008 USD)
Thousand dollars
Triggers
CD4
Viral load
Viral load only if CD4 meets WHO criteria (Nested)
Clinical
Smaller shapes designate strategies statistically indistinguishable from frontier
Hollow s
y
mbol shapes represent viral load switchin
g
thresholds of 500 rather than 10,000
12
NA
Frequency (months)
3
6
10.6
10.7
10.8
10.9
11.0
11.1
11.2
11.3
11.4
11.5
11.6
$11 $12 $13 $14 $15 $16 $17 $18 $19 $20
Quality adjusted life years
Total lifetime cost
(2008 USD)
Thousand dollars
Figure 2 Efficient frontier of HIV monitoring strategies assuming two cART regimens are available.
Braithwaite et al. Journal of the International AIDS Society 2011, 14:38
/>Page 6 of 13
conditionally; however, these strategies now employed
less conservative monitoring frequencies and switching
thresholds. Only one strategy employing routine CD4
monitoring alone (every six months) w as close to the
efficient frontier.
As willingness to pay greatly exceeded the value of
earlier cART initiation, the efficient frontier became
comprised of monitoring strategies that used routine
viral load monitoring, with progressively greater fre-
quencies and less conservative switching thresholds.
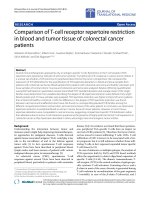
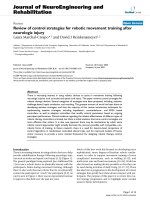
Scenario with three available cART regimens
When we explored a scenario in which three cART
regimens were available (Table 3, Figure 3), strategies
with routine CD4 monitor ing alone continued t o be
excluded from the efficient frontier, and therefore
never offered a good use of healthcare resources. As
willingness to pay approached the value of cART
initiation at a CD4 count of 350 cells/mm
3
rather than
200 cells/mm
3
(ICER $2600/QALY), the efficient fron-
tier was comprised of monitoring strategies that were
structured conditionally, where CD4 was obtained rou-
tinely and a follow-up viral load was only obtained if
the CD4 count met WHO immunologic criteria. As
willingness to pay greatly exceeded the value of earlier
cART initiation, the efficient frontier was comprised of
monitoring strategies that used routine viral load mon-
itoring. In sensitivity analyses, no strategy employing
routine CD4 monitoring alone was close to the effi-
cient frontier.
Scenario with variable number of cART regimens
When we considered a scenario that does not specify a
fixed number of cART regimens, but rather allows the
number of available cART regimens to vary (Table 4,
Figure 4), strategies for routine CD4 monitoring alone
continuedtobeexcludedfromtheefficientfrontier.At
willingness-to-pay levels belo w that of earlier cART
initiation, the efficient frontier was limited to a sole
strategy (one cART regimen and using clinical rather
than laboratory monitoring). As willingness-to-pay levels
rose above that of early cART initiation, the greatest
Table 3 Value of alternative laboratory monitoring strategies compared to earlier treatment initiation, assuming three
antiretroviral (ARV) regimens are available
Monitoring
strategy
Freq-
uency
(mo.)
Viral load threshold
for switching ARV
(copies/ml)
5-year outcomes Cost
($2008)
QALY ICER
($/QALY)
Value compared
with earlier
treatment
initiation*
Mean #
ARV
rounds
used
Mean
new
mut-
ations
Median
CD4
(cells/
mm
3
)
Median
HIV (log
units)
Clinical 3 N/A 1.32 1.02 271 2.65 16,017 10.814 N/A N/A
Viral load only if
CD4 meets WHO
criteria†
12 10,000 1.3 1.1 270 2.70 17,050 11.281 2200 Similar
Viral load only if
CD4 meets WHO
criteria†‡
6 10,000 1.32 1.12 270 2.70 17,571 11.361 6500 Worse
Viral load 12 10,000 1.45 1.03 280 2.68 19,900 11.652 8000 Worse
Viral load¶ 12 500 2.06 0.81 290 2.38 25,527 11.941 19,500 Worse
Viral load 6 500 2.12 0.77 290 2.36 26,927 11.988 29,800 Worse
Viral load 3 500 2.16 0.76 290 2.34 29,063 12.018 71,200 Worse
Mo.: months; QALY: quality-adjusted life year; ICER: incremental cost-effectiveness ratio.
* Earlier treatment initiation at CD4 of 350 cells/mm
3
compared with CD4 of 200 cells/mm
3
. “Better” value is indicated by a numerically lower ICER, and suggests
that health benefits would be increased if resources were allocated away from earlier treatment initiation towards this monitoring strategy. “Worse” value is
indicated by a numerically higher ICER, and suggests that health benefits would be increased if resources were allocated towards earlier ARV initiation away from
this monitoring strategy.
† WHO (World Health Organization) criteria for changing ARV regimen based on CD4 count
‡ Four strategies had ICERs that were not on the frontier but were sufficiently close to the frontier so that they were difficult to distinguish statistically, all
employing the conditional strategy, “viral load only if CD4 meets WHO criteria”, for: (1) frequency of 12 months and ARV switching threshold of 500 copies/mL
[ICER > = $3600/QALY]; (2) frequency of 6 months and ARV switching threshold of 500 copies/mL [ICER > = $5600/QALY]; (3) frequency of 3 months and ARV
switching threshold of 10,000 copies/mL [ICER > = $5100/QALY; (4) frequency of 3 months and ARV switching threshold of 500 copies/mL [ICER > = $5100/
QALY].
¶ One strategy had an ICER that was not on the frontier but was sufficiently close to the frontier so that it was difficult to distinguish statistically: viral load alone
with a frequency of 6 months and switching threshold of 10,000 copies/mL [ICER > = $11,200/QALY].
Results are only shown for strategies that maximized health benefits for some budget scenarios or willingness to pay for health benefits.
Braithwaite et al. Journal of the International AIDS Society 2011, 14:38
/>Page 7 of 13
benefit was delivered by incorporating multiple regimens
with routine viral load monitoring. In sensitivity ana-
lyses, only two strategies employing routine CD4 moni-
toring alone were close to the efficient frontier.
Conditional strategies were no longer on the efficient
frontier because the ICER of routinely offering multiple
cART regimens (compared with providing one cART
regimen only) was fairly high (ICER > $5000/QALY), and
because the ICER of any laboratory testing strategy would
only be favourable if multiple cART regimens were routi-
nely offered. As willingness to pay exceeded the ICER of
offering multiple cART regimens, they were also high
enough to support the ICER of routine use of viral load
testing.
Figure 3 Efficient frontier of HIV monitoring strategies assuming three cART regimens are available.
Braithwaite et al. Journal of the International AIDS Society 2011, 14:38
/>Page 8 of 13
Sensitivity analyses
Sensitivity analyses suggested that efficient frontiers were
robust to alternative assumptions (Additional file 1,
Figure S2), with monitoring strategies based on CD4
counts alone almost never falling on the efficient frontier.
A notable exception to this stability occurred when
assumptions were varied regarding the pricing of second-
and third-line cART regime ns rel ative to first-line cART.
When later cART regimens were assumed to be no more
expensive than first-line cART regimens, the value of
monitoring strategies that involved routine viral load
testing became more favourable.
Discussion
Our results have several implications for monitoring of
HIV-infected patients in resource-limited settings. First,
routine CD4 monitoring alone is unlikely to be a
preferred strategy, regardless of available resources, will-
ingness to pay or availability of treatment options. This
is likely attributable to the poor sensitivity and specifi-
city of CD4 testing for detecting treatment failure and
viral rebound [19]. Because routine CD4 monitoring
alone (e.g., without viral load t o confirm treatment fail-
ure) is neve r preferred, our results suggest tha t the
WHO recommendation to use viral load to confirm
treatment failure should not be diluted with the phrase,
“ where resources are available ”, and instead should
employ the same strength of language that it applies to
earlier cART initiation. Indeed, employing CD4 counts
together with conditional viral load testing is a preferred
strategy under a wide range of willingness-to-pay and
treatment availability scenarios.
Second, routine viral load testing alone is only a pre-
ferred strategy at levels of willingness to pay that far
Table 4 Value of alternative laboratory monitoring strategies compared with earlier treatment initiation without any
fixed assumption about numbers of available antiretroviral (ARV) regimens
# ARV
regimens
Monitoring
strategy
Freq-
uency
(mo.)
Viral
load
thres-
hold
5-year outcomes Cost,
$2008
QALY ICER,
$/QALY
Value com-pared
with earlier
treatment initiation*
Mean #
ARV
rounds
used
Mean
new
mut-
ations
Median
CD4
(cells/
mm
3
)
Median
HIV (log
units)
0 Nothing NA NA 0 0 0 0 807 1.966 NA NA
1 Clinical 3 NA 1 1.05 265 2.79 5713 9.901 600 Better
2 Viral load only if
CD4 meets WHO
criteria†‡
12 10,000 1.23 1.09 270 2.7 11,691 10.890 6000 Worse
2 Viral load only if
CD4 meets WHO
criteria†¶
12 500 1.27 1.06 270 2.66 12,060 10.948 6400 Worse
2 Viral load 12 10,000 1.33 1.02 277 2.69 13,308 11.125 7100 Worse
2 Viral load§ 12 500 1.67 0.82 285 2.42 16,035 11.412 9500 Worse
3 Viral load 12 10,000 1.45 1.03 280 2.68 19,900 11.652 16,100 Worse
3 Viral load 12 500 2.06 0.81 290 2.38 25,527 11.941 19,500 Worse
3 Viral load 6 500 2.12 0.77 290 2.36 26,927 11.988 29,800 Worse
3 Viral load 3 500 2.16 0.76 290 2.34 29,063 12.018 71,200 Worse
Mo.: months; QALY: quality-adjusted life year; ICER: incremental cost-effectiveness ratio.
* Earlier treatment initiation at CD4 of 350 cells/mm
3
compared with CD4 of 200 cells/mm
3
. “Better” value is indicated by a numerically lower ICER, and suggests
that health benefits would be increased if resources were allocated away from earlier treatment initiation towards this monitoring strategy. “Worse” value is
indicated by a numerically higher ICER, and suggests that health benefits would be increased if resources were allocated towards earlier ARV initiation away from
this monitoring strategy.
† WHO (World Health Organization) criteria for changing ARV regimen based on CD4 count
‡ Three strategies had ICERs that were not on the frontier but were sufficiently close to the frontier so that they were difficult to distinguish statistically, all
allowing 2 ARV regimens. Two employed the conditional strategy, “viral load only if CD4 meets WHO criteria”, for: (1) frequency of 6 months and ARV switching
threshold of 10,000 copies/mL [ICER > = $2200/QALY]; (2) frequency of 6 months and ARV switching threshold of 500 cop ies/mL [ICER > = $4900/QALY]. The
third employed a CD4 alone strategy with a frequency of 12 months [ICER > = $5200/QALY].
¶ Two strategies had an ICER that was not on the frontier but was sufficiently close to the frontier so that it was difficult to distinguish statistically, both allowing
2 ARV regimens. One employed the strategy, “viral load only if CD4 meets WHO criteria”, with frequency of 3 months and ARV switching threshold of 10,000
copies/mL [ICER > = $6100/QALY] and the other was a CD4 alone strategy with a frequency of 6 months [ICER > = $6400/QALY],
§ Two strategies had an ICER that was not on the frontier but was sufficiently close to the frontier so that it was difficult to distinguish statistically, both
employing viral loads alone with 6 month frequency, the first using an ARV switching threshold of 500 copies/m L and allowing 2 ARV regimens [ICER > =
$13,900/QALY] and the second using an ARV switching threshold of 10,000 copies/mL and allowing 3 ARV regimens [ICER > = $14,900/QALY].
Results are only shown for strategies that maximized health benefits for some budget scenarios or willingness to pay for health benefits.
Braithwaite et al. Journal of the International AIDS Society 2011, 14:38
/>Page 9 of 13
exceed those of earlier cART initiation. In other words,
our results suggest that a programme routinely monitoring
viral loads, but starting cART at a CD4 of 200 cells/mm
3
rather than 350 cells/mm
3
,willsavemorehigh-quality
years of life if it reallocates som e laboratory expenditures
towards drugs allowing for earlier initiation of cART
(Figure 5). These results suggest that the WHO condi-
tional recommendation to use viral load testing every six
months to check for viral replication “ where routinely
available” should be interpreted, more concr etely, as
meanin g “in those settings where all patients are already
started on cART at a CD4 count of 350 cells/mm
3
(rather
than 200 cells/mm
3
)”.
Third, when monitoring includes viral load in resource-
limited settings, the switching threshold conferring the
greatest value is more likely to be 10,000 copies/mL than
lower thresholds, and r aises the question of whethe r the
recent change in threshold advocated by WHO (5000
copies/mL rather than 10,000 copies/mL) is a step in the
right direction, especially when the downstream cost
burdens o f switching first-line regimens to f ar more
expensive, second-line regimens might make it more
10.0
12.0
14.0
f
e years
4.0
6.0
8.0
10.0
12.0
14.0
Q
uality adjusted life years
0.0
2.0
4.0
6.0
8.0
10.0
12.0
14.0
$0 $5 $10 $15 $20 $25 $30 $35
Quality adjusted life years
Total lifetime cost
(2008 USD)
Thousand dollars
Triggers
CD4
Viral load
Viral load onl
y
if CD4 meets WHO criteria
(
Nested
)
0.0
2.0
4.0
6.0
8.0
10.0
12.0
14.0
$0 $5 $10 $15 $20 $25 $30 $35
Quality adjusted life years
Total lifetime cost
(2008 USD)
Thousand dollars
Viral load only if CD4 meets WHO criteria (Nested)
Clinical
12
Frequency (months)
3
6
0.0
2.0
4.0
6.0
8.0
10.0
12.0
14.0
$0 $5 $10 $15 $20 $25 $30 $35
Quality adjusted life years
Total lifetime cost
(2008 USD)
Thousand dollars
Smaller shapes designate strategies statistically indistinguishable from frontier
Hollow s
y
mbol shapes represent viral load switchin
g
thresholds of 500 rather than 10,000
NA
0.0
2.0
4.0
6.0
8.0
10.0
12.0
14.0
$0 $5 $10 $15 $20 $25 $30 $35
Quality adjusted life years
Total lifetime cost
(2008 USD)
Thousand dollars
Figure 4 Efficient frontier of HIV monitoring strategies assuming no fixed number of cART regimens available.
Braithwaite et al. Journal of the International AIDS Society 2011, 14:38
/>Page 10 of 13
difficult to simultaneously adhere to other costly changes
in its recommendations.
Fourth, if programmes are considering alternative
monitoring strategies at the same time that they are
weighing how many cART regimen options to offer, our
results suggest that they can save more high-quality
years of life b y routinely offering fewer regimens with
less intense monitoring strategies, and by reallocating
saved resources on earlier initiation of cART.
Fifth, the bulk of expenditures from routine viral load
testingdidnotarisefromthecostoftheviralloadtest
itself, but rather originated from the downstream costs
of more frequent switches to expensive second- and
third-line regimens. When later cART regimens were
assumed to be no more expensive than first-line cART
regimens, monitoring strategies that involved routine
viral load testing became more favourable. These results
suggest that even if viral load tests become cheaper,
they may not offer favourable value if there is no change
in the relative pricing of different regimens. In contrast,
if later cART regimens become less expensive relative to
first-line regimens, viral load tests may offer favourable
value even if the tests themselves remain expensive.
Our estimates for the ICER of cART ($600/QALY)
were very similar to o ther published analyses ($590 per
life year, Goldie; $628/QALY, Bishai) [10,11]. Like other
analyses, the incremental c ost effectiveness of routine
CD4 testing was unfavourable compared with some
alternative resource uses [5]. Our estimates for the ICER
of viral load testing are difficult to compare with other
published analyses because we considered conditional
strategies, in which viral load is not ordered routinely.
Still, our results are concordant with other analyses sug-
gesting that lives would be saved by allocating resources
away from routine viral load testing and towards other
resource-constrained care strategies (e.g., earlier initia-
tion of cART) [5].
Our analyses have notable limitations. Our simul ation
is not a transmission model, and the refore does not
consider how more conservative monitoring strategies
might lead to: (1) delayed detection of antiretroviral
resistance and its spread; and (2) higher viral loads in
treated patients, which have been associated with
increased transmission rates. However, this considera-
tion is unlikely to alter inferences for decision making
because the increase in resistance accumulation is likely
to be modest (less than one resistance mutation over a
five-year period) (Tables 2, 3, 4).
Furthermore, allocating funds towards earlier treat-
ment initiation would have a far more profound effect
on viral load (and subsequently on HIV transmission
risk) because people who are treated earlier will have
low viral loads for a longer portion of the time they a re
infected. In addition, while the simulation is sufficiently
detailed to represent clinical differences among subtypes
of nucleoside reverse transcriptase inhibitors (e.g., indu-
cing non-thymidine-analogue mutations versus inducing
thymidine anologue mutations), it is not sufficiently
Lab Monitoring: Less More
Less More
c
ART Treatment: Earlier Later
E
a
rli
e
r L
ate
r
0
2
4
6
8
10
12
14
16
Lifetime Benefit (QALYS)
$0
$2,000
$4,000
$6,000
$8,000
$10,000
$12,000
$14,000
$16,000
Lifetime Cost (US
$
)
Other
Lab costs
Drug costs
$16,000
$14,000
$12,000
$10,000
$8000
$6000
$4000
$2000
$0
Figure 5 Comparison of alternative strategies for allocating expenditures for a hypothetical HIV patient in East Africa. This figure shows a
comparison of monitoring strategies for a patient newly diagnosed with HIV with a CD4 count of 350 cells/mm
3
. The right pair of bars shows a strategy
that relies on routine viral load monitoring, whereas the left set of bars shows a strategy that relies more on clinical monitoring, and reallocates the
money saved on less laboratory monitoring to fund earlier initiation of ARV. Even though both strategies incur the same lifetime expenditures, the
strategy that employs less laboratory monitoring to enable earlier ARV initiation increases life expectancy by 1.5 quality-adjusted life years.
Braithwaite et al. Journal of the International AIDS Society 2011, 14:38
/>Page 11 of 13
detailed to represent clinical differences among indivi-
dual drugs within each subtype (e.g., zidovudine versus
stavudine).
A distinctive strength of our work is that we evaluated
a broad matrix of monitoring options, including some
strategies that are not guideline recommended at the
current time, but which might seem like plausib le alter-
natives to some decision makers (for example, obtaining
routine viral load without routine CD4 counts). Indeed,
the ability to simultaneously evaluate a broad range of
monitoring options beyond those currently employed is
one of the key methodological strengths of using mathe-
matical modelling in general, and of the current report
in particular.
Conclusions
In conclusion, our computer simulation suggests that
shifting resources away from routine laboratory moni-
toring and toward earlier initiation of cART has the
potential to increase the number of lives saved with
HIV treatment in a resource-constrained environment.
Funding
This work is supported by National Institute of Allergy
and Infectious Disease Award UO1AI069911-01 (IeDEA
East Africa), US National Institutes of Health. MCB is
employed by the US NIH, which provided funding for
this study through a grant. The study sponsor had no
role in the study design, interpretation of data , the writ-
ing of the paper, or the decision to submit the paper for
publication.
Additional material
Additional file 1: Appendix. The Appendix describes in detail the
methods underlying the revision of the model and its calibration. The
Appendix figures show results of model calibration and results of
sensitivity analyses [26-29].
Acknowledgements
We would like to acknowledge Amy C Justice, MD, PhD, and Joyce CH
Chang, PhD, for data from the Veterans Aging Cohort Study. We would like
to acknowledge Sherry Mentor, MPH, and Lauren Uhler, BA, for assistance
with manuscript preparation.
Author details
1
Section on Value and Comparative Effectiveness, Department of Medicine,
New York University School of Medicine, New York, NY, USA.
2
Department of
Biostatistics, Indiana University School of Medicine, Indianapolis, IN, USA.
3
Department of Medicine, Moi University School of Medicine, Eldoret, Kenya.
4
Division of AIDS, NIAID, National Institutes of Health, Bethesda, MD, USA.
5
Department of Medicine, Indiana University School of Medicine,
Indianapolis, IN, USA.
Authors’ contributions
RSB designed the study concept. RSB and KN developed the model and KN
programmed the model. LD, CTY, BM, SK, MCB and KWK acquired and/or
interpreted the data. RSB analyzed results and wrote the manuscript. RSB,
CTY, LD, MCB and KWK revised the manuscript. All authors read and
approved the final manuscript.
Competing interests
The authors declare that they have no competing interests.
Received: 1 December 2010 Accepted: 30 July 2011
Published: 30 July 2011
References
1. Calmy A, Ford N, Hirschel B, Reynolds SJ, Lynen L, Goemaere E, Garcia de la
Vega F, Perrin L, Rodriguez W: HIV viral load monitoring in resource-
limited regions: optional or necessary? Clin Infect Dis 2007, 44:128-134.
2. Elliott JH, Lynen L, Calmy A, De Luca A, Shafer RW, Zolfo M, Clotet B,
Huffam S, Boucher CA, Cooper DA, Schapiro JM: Rational use of
antiretroviral therapy in low-income and middle-income countries:
optimizing regimen sequencing and switching. AIDS 2008, 22:2053-2067.
3. Fowler MG, Owor M: Monitoring HIV treatment in resource-limited
settings: reassuring news on the usefulness of CD4(+) cell counts. J Infect
Dis 2009, 199:1255-1257.
4. Johannessen A, Garrido C, Zahonero N, Sandvik L, Naman E, Kivuyo SL,
Kasubi MJ, Gundersen SG, Bruun JN, de Mendoza C: Dried blood spots
perform well in viral load monitoring of patients who receive
antiretroviral treatment in rural Tanzania. Clin Infect Dis 2009, 49:976-981.
5. Phillips AN, Pillay D, Miners AH, Bennett DE, Gilks CF, Lundgren JD:
Outcomes from monitoring of patients on antiretroviral therapy in
resource-limited settings with viral load, CD4 cell count, or clinical
observation alone: a computer simulation model. Lancet 2008,
371:1443-1451.
6. Schooley RT: Viral load testing in resource-limited settings. Clin Infect Dis
2007, 44:139-140.
7. WHO: Antiretroviral therapy for HIV infection in adults and adolescents:
Recommendations for a public health approach: 2010 revision. [http://
www.who.int/hiv/pub/arv/adult2010/en/index.html].
8. ART-LINC of IeDEA Study Group, Keiser O, Tweya H, Boulle A, Braitstein P,
Schecter M, Brinkhof MW, Dabis F, Tuboi S, Sprinz E, Pujades-Rodriguez M,
Calmy A, Kumarasamy N, Nash D, Jahn A, MacPhail P, Luthy R, Wood R,
Egger M: Switching to second-line antiretroviral therapy in resource-
limited settings: comparison of programmes with and without viral load
monitoring. AIDS 2009, 23:1867-1874.
9. DART Trial Team, Mugyenyi P, Walker AS, Hakim J, Munderi P, Gibb DM,
Kityo C, Reid A, Grosskurth H, Darbyshire JH, Ssali F, Bray D, Katabira E,
Babiker AG, Gilks CF, Grosskurth H, Munderi P, Kabuye G, Nsibambi D,
Kasirye R, Zalwango E, Nakazibwe M, Kikaire B, Nassuna G, Massa R, et al:
Routine versus clinically driven laboratory monitoring of HIV
antiretroviral therapy in Africa (DART): a randomised non-inferiority trial.
Lancet 2010, 375:123-131.
10. Goldie SJ, Yazdanpanah Y, Losina E, Weinstein MC, Anglaret X, Walensky RP,
Hsu HE, Kimmel A, Holmes C, Kaplan JE, Freedberg KA: Cost-effectiveness
of HIV treatment in resource-poor settings–the case of Cote d’Ivoire. N
Engl J Med 2006, 355:1141-1153.
11. Bishai D, Colchero A, Durack DT: The cost effectiveness of antiretroviral
treatment strategies in resource-limited settings. AIDS 2007, 21:1333-1340.
12. Braithwaite RS, Justice AC, Chang CC, Fusco JS, Raffanti SR, Wong JB,
Roberts MS: Estimating the proportion of patients infected with HIV who
will die of comorbid diseases. Am J Med 2005, 118:890-898.
13. Braithwaite RS, Roberts MS, Chang CC, Goetz MB, Gibert CL, Rodriguez-
Barradas MC, Shechter S, Schaefer A, Nucifora K, Koppenhaver R, Justice AC:
Influence of alternative thresholds for initiating HIV treatment on
quality-adjusted life expectancy: a decision model. Ann Intern Med 2008,
148
:178-185.
14.
Braithwaite
RS, Shechter S, Chang CC, Schaefer A, Roberts MS: Estimating
the rate of accumulating drug resistance mutations in the HIV genome.
Value Health 2007, 10:204-213.
15. Braithwaite RS, Shechter S, Roberts MS, Schaefer A, Bangsberg DR,
Harrigan PR, Justice AC: Explaining variability in the relationship between
antiretroviral adherence and HIV mutation accumulation. J Antimicrob
Chemother 2006, 58:1036-1043.
16. Geng EH, Bangsberg DR, Musinguzi N, Emenyonu N, Bwana MB,
Yiannoutsos CT, Glidden DV, Deeks SG, Martin JN: Understanding reasons
Braithwaite et al. Journal of the International AIDS Society 2011, 14:38
/>Page 12 of 13
for and outcomes of patients lost to follow-up in antiretroviral therapy
programs in Africa through a sampling-based approach. J Acquir Immune
Defic Syndr 2010, 53:405-411.
17. Markowitz H: Portfolio Selection. J Finance 1952, 53:405-411.
18. Gold MR, Seigel JE, Russell LB, Weinstein MC: Cost-Effectiveness in Health and
Medicine New York: Oxford University Press; 1996.
19. Mee P, Fielding KL, Charalambous S, Churchyard GJ, Grant AD: Evaluation
of the WHO criteria for antiretroviral treatment failure among adults in
South Africa. AIDS 2008, 22:1971-1977.
20. World Health Organization: WHO case definitions of HIV for surveillance
and revised clinical staging and immunologic classification of HIV-
related disease in adults and children. [ />guidelines/hivstaging/en/index.html].
21. Johnson VA, Brun-Vezinet F, Clotet B, Gunthard HF, Kuritzkes DR, Pillay D,
Schapiro JM, Richman DD: Update of the drug resistance mutations in
HIV-1: December 2009. Top HIV Med 2009, 17:138-145.
22. Braithwaite RS, Kozal MJ, Chang CC, Roberts MS, Fultz SL, Goetz MB,
Gibert C, Rodriguez-Barradas M, Mole L, Justice AC: Adherence, virological
and immunological outcomes for HIV-infected veterans starting
combination antiretroviral therapies. AIDS 2007, 21:1579-1589.
23. Braithwaite RS, Goulet J, Kudel I, Tsevat J, Justice AC: Quantifying the
decrement in utility from perceived side effects of combination
antiretroviral therapies in patients with HIV. Value Health 2008,
11:975-979.
24. Freedberg KA, Scharfstein JA, Seage GR, Losina E, Weinstein MC, Craven DE,
Paltiel AD: The cost-effectiveness of preventing AIDS-related
opportunistic infections. JAMA 1998, 279:130-136.
25. Red Book. Pharmacy’s Fundamental Reference. 113 edition. PDR Network;
2009.
26. World Health Statistics. [ />EN_WHS08_Full.pdf].
27. Mills EJ, Nachega JB, Buchan I, Orbinski J, Attaran A, Singh S, et al:
Adherence to antiretroviral therapy in sub-Saharan Africa and North
America: a meta-analysis. JAMA 2006, 296:679-690.
28. Yiannoutsos CT, An MW, Frangakis CE, Musick BS, Braitstein P, Wools-
Kaloustian K, et al: Sampling-based approaches to improve estimation of
mortality among patient dropouts: experience from a large PEPFAR-
funded program in Western Kenya. PLoS One 2008, 3:e3843.
29. Justice AC, Dombrowski E, Conigliaro J, Fultz SL, Gibson D, Madenwald T,
et al: Veterans Aging Cohort Study (VACS): Overview and description.
Med Care 2006, 44:S13-24.
doi:10.1186/1758-2652-14-38
Cite this article as: Braithwaite et al.: Alternative antiretroviral
monitoring strategies for HIV-infected patients in east Africa:
opportunities to save more lives? Journal of the International AIDS Society
2011 14:38.
Submit your next manuscript to BioMed Central
and take full advantage of:
• Convenient online submission
• Thorough peer review
• No space constraints or color figure charges
• Immediate publication on acceptance
• Inclusion in PubMed, CAS, Scopus and Google Scholar
• Research which is freely available for redistribution
Submit your manuscript at
www.biomedcentral.com/submit
Braithwaite et al. Journal of the International AIDS Society 2011, 14:38
/>Page 13 of 13