báo cáo hóa học:" The Global Fund’s resource allocation decisions for HIV programmes: addressing those in need" pptx
Bạn đang xem bản rút gọn của tài liệu. Xem và tải ngay bản đầy đủ của tài liệu tại đây (375.67 KB, 10 trang )
RESEARCH Open Access
The Global Fund’s resource allocation decisions
for HIV programmes: addressing those in need
Olga Avdeeva
1*
, Jeffrey V Lazarus
1,2
, Mohamed Abdel Aziz
3
and Rifat Atun
1,4
Abstract
Background: Between 2002 and 2010, the Global Fund to Fight AIDS, Tuberculosis and Malaria’s investment in HIV
increased substantially to reach US$12 billion. We assessed how the Global Fund’s investments in HIV programmes
were targeted to key populations in relation to disease burden and national income.
Methods: We conducted an assessment of the funding approved by the Global Fund Board for HIV programmes
in Rounds 1-10 (2002-2010) in 145 countries. We used the UNAIDS National AIDS Spending Assessment framework
to analyze the Global Fund investments in HIV programmes by HIV spending category and type of epidemic. We
examined funding per capita and its likely predictors (HIV adult prevalence, HIV prevalence in most-at-risk
populations and gross national income per capita) using stepwise backward regression analysis.
Results: About 52% ($6.1 billion) of the cumulative Global Fund HIV funding was targeted to low- and low-middle-
income countries. Around 56% of the total ($6.6 billion) was channelled to countries in sub-Saharan Africa. The
majority of funds were for HIV treatment (36%; $4.3 billion) and prevention (29%; $3.5 billion), followed by health
systems and community systems strengthening and programme management (22%; $2.6 billion), enabling
environment (7%; $0.9 billion) and other activities. The Global Fund investment by country was positively
correlated with national adult HIV prevalence. About 10% ($0.4 billion) of the cumulative HIV resources for
prevention targeted most-at-risk populations.
Conclusions: There has been a sustained scale up of the Global Fund’s HIV support. Funding has targeted the
countries and populations with higher HIV burden and lower income. Prevention in most-at-risk populations is not
adequately prioritized in most of the recipient countries. The Global Fund Board has recently modified eligibility
and prioritization criteria to better target most-at-risk populations in Round 10 and beyond. More guidance is
being provided for Round 11 to strategically focus demand for Global Fund financing in the present resource-
constrained environment.
Background
The Global Fund to Fight AIDS, Tuberculosis and
Malaria is a public-private partnership dedicated to
attracting and disbursing resources to address HIV,
tuberculosis (TB) and malari a pandemics. As of the end
of 2010, the Global Fund had allocated US$12 billion
and disbursed $7.4 bi llion for HIV programmes, making
it one of the leading sources of funding for HIV pro-
grammes worldwide. The resources from the Global
Fund, along with resources from key partners, such as
the US President’s Emergency Plan for AIDS Relief
(PEPFAR) and the World Bank Multi-Country HIV/
AIDS Program, have made a major contribution to
efforts t o achieve universal access to prevention, treat-
ment and care services for HIV and AIDS.
By 2009, the joint efforts in this significant expansion
in resources had resulted in the re duction of new infec-
tions by 19% from the levels in 1999 [1]. However, the
global population of people living with HIV continues
to be large, numbering an estimated 33.3 million at t he
end of 2009 [1]. Sub-Saharan Africa remains the region
most heavily affected by HIV, accounting for 68% of
HIV infections worldwide. The Asian region is h ome to
4.9 million people living with HIV [2]. The Asian epi-
demic is still concentrated within specific h igh-risk
* Correspondence:
1
The Global Fund to Fight AIDS, Tuberculosis and Malaria, Chemin de
Blandonnet 8, CH-1214 Vernier, Geneva, Switzerland
Full list of author information is available at the end of the article
Avdeeva et al. Journal of the International AIDS Society 2011, 14:51
/>© 2011 Avdeeva et al; licensee BioMed Central Ltd. This is an Open Ac cess article distributed under the terms of the Creative
Commons Attribution License ( .0), which permits unrestricted use, distribution, and
reproduction in any medium, provided the original work is properly cited.
populations. Nevertheless, with such a large population,
just a small increase could have catastrophic effects [3].
The three regions of the Middle East and North
Africa, Latin America and the Caribbean, and Eastern
Europe and Central Asia also experience concentrated
epidemics. HIV has more heavily affected the Caribbe an
Region than any other region outside sub-Saharan
Africa, with the second highest adult prevalence in the
world. In the Eastern Europe and Central Asia region,
where injecting drug use is the primary mode of trans-
mission, treatment levels are lower than in sub-Saharan
Africa [2], and most people are unaware of their status.
The global economic recession i s straining budgets in
many low- and middle-i ncome countries, with a decline
in health overseas developme nt aid, including commit-
ments to the Global Fund [3]. The Third Voluntary
Replenishment of the Global Fund, which led to pledges
of US$ 11.7 billion, will enable further scale up of Global
Fund investments for the 2011 to 2013 period, but not
at the same pace as in recent years and it is insufficient
to meet the anticipated demand. Therefore, not only is
there a need to mobilize domestic resources and exter-
nal a id for HIV programmes, but it is a lso necessary to
ensure that available resources are used as efficiently as
possible, and that allocation for HIV prevention, treat-
ment, care and support services matches epidemiological
patterns in order to maximize positive outcomes.
This study reviews the Global Fund HIV portfolio in
2002-2010 (funding rounds 1-10). It describes the trends
and allocation patterns of the Global Fund investment
in HIV programmes and assesses how these investments
were allocated in relation to disease burden in the gen-
eral population and among vulnerable groups, as well as
to levels of national income.
Methods
Conceptual framework
The conceptual framework for this assessment is an
analysis of funding flows and resource allocation pat-
terns, using the National AIDS Spending Assessment
(NASA) framewor k [4,5], developed by the Joint United
Nations Programme on AIDS (UNAIDS). NASA allows
for t he monitoring of the annual flow of funds used to
finance the resp onse to HIV and AIDS. Its methodology
is based on existing accounting approaches and the
National Health Accounts framework [6], an interna-
tionally recognized tool for tracking financial f lows on
overall healthcare from funding sources to financing
agents, service providers, services and beneficiaries.
The study presents the annual Global Fund-approved
funding for HIV programmesbycountry,regionofthe
world, epidemic type and spending category. Approved
funding for the Global Fund HIV programmes is pre-
sented using NASA spending categories [4]: (1)
prevention (including communication for social and
behaviour change, counselling and testing, condom
social marketing, and prevention of mother to child
transmission); (2) care and treatment (including antire-
troviral therapy, treatment of opportunistic infections,
and collaborative TB/HIV activities); (3) interventions
targeting orphans and vulnerable children; (4) pro-
gramme management and administration (including
planning, c oordination, monitoring and evaluation, and
operational research); (5) human resources (including
workforce services on training, recruitment, retention,
and rewarding of performance of the workforce involved
in the HIV field); and (6) enabling environment (includ-
ing advocacy, reduction of stigma and discrimination,
and capacity building).
Using the NASA framework, the study ana lyzes the
Global Fund flo w of HIV investment from the Global
Fund as the funding source, to interventions/spending
categories and beneficiary populations.
Methodology
We examined Global Fund-approved funding for HIV
programmes in 2002-2010 (Rounds 1-10) in 145 countries
for Phase 1 and 2 grants, exceptional extension funding,
and funding provided throu gh the Rolling Continuation
Channel and National Strategy Application grants.
We col lected data on the Global Fund-approved fund-
ing by spending categories from the proposal budgets,
including for Rolling Continuation Channel proposals
and National Strategy Application proposals, approved
by the Global Fund Board as of the end of 2010 [7]. If
the country grant proposal budget lacked detailed infor-
mation about the allocation by service delivery area or if
the amounts requested by the Country Coordinating
Mechanism deviated after the Technical Review Panel
review and Board approval, we used estimation methods
to generate a complete dataset of approved funding dis-
aggregated by spending categories.
If the proposal budget deviated from the Board-
approved grant amount (difference less o r equal to
10%), we assumed that the “error” (the difference
between the proposal and the Board-approved budget)
was proportionate across all spending categories. In
such cases, we adjusted the original budget accordingly
(for exam ple, propo rtionate reduction by 10%) . In other
cases, a closely related expenditure figure served as a
proxy [8,9]. The es timations for incomplet e or deviated
data were made based on the assumption that allocation
pattern of expenditure (in the absence of any major
reprogramming of Global Fund grants between 2002
and 2010) followed the allocation patterns of the grant-
approved funding.
The amounts under consideration were distributed
using proxy variables (we called them “allocation keys”)
Avdeeva et al. Journal of the International AIDS Society 2011, 14:51
/>Page 2 of 10
as indicators of the likely distribution. For 20 02-2010,
the estimations were made for 131 (20%) out of 651
reviewed proposal documents. The estimations for
incomplete data were made based on a review of
nat ional programmes, UNAIDS-reported data [10], HIV
sub-accounts and NASA reports available for selected
countries [11], the Global Fund Five-Year Evaluation
database [12], and previous analyses of the Global
Fund’s portfolio [13]. In most of the cases, the budget
proposals for early rounds (1-3) had a missing or incom-
plete breakdown by spending category that would bias
one of the key findings of the study, such as resource
allocation for most-at-risk populations. However, most
of the Global Fund support for these populations was
allocated through Rounds 8-10 and renewed grants that
have reliable budget data in the proposal documents.
The UNAID S definitions of HIV-related interventions
were used to aggregate multiple interventions used in
the country proposal budgets into a set of standardized
NASA classification schemes. Proposal analysis allowed
us to employ a bottom-up approach to calculate the
total amounts of funds for all spending categories by
country, funding round and year. The funding units
(funding per spending category) from the proposals
were aggregated to the level of funding per country and
programme.
The estimated funding units were compiled into a sin-
gle dataset for analysis. All results are presented in 2008
US dollars. Several important characteristics of countries
and/or regions were assessed by:
• The type of epidemic (generalized, concentrated, low
level) [1]
• Income levels of countries according to their 2009
gross national income (GNI) per capita using the World
Bank Atlas method as per current Global Fund income
eligibility criteria [14,15]
• Adult HIV prevalence and prevalence in most-at-risk
populations (MARPs) [2,10].
We examined the Global Fund-approved funding per
capita and its likely predictors, such as HIV adult preva-
lence, HIV prevalence in MARPs and GNI per capita as
based on the current Global Fund income eligibility
criteria [15]. Analysis was ca rried out using stepwise
backward regression analysis. Details on the variables
and the data sources are presented in Table 1. There
were 140 countries included in the analysis. Analysis
was done in SPSS (version 18.0).
Results
By the end of 2010, the Global Fund had approved US
$12 billion for HIV programmes in 145 countries. The
level of annual HIV investment expanded from $0.3 bil-
lion in 2002, when the Global Fund was established, to
$1.1 billion in 2003, $2.0 billion in 2008, $2.5 billion in
2009 and $1.2 billion in 2010.
Of the eight Global Fund regions, the three sub-
Saharan Africa regions showed the highest absolute gain
in investments over time, especially after the high rates of
approved funding in Round 8, increasing from US$0.2
billion in 2002 to $1.2 billion in 2008 and $1.1 in 2010),
while the Middle East and North Africa region saw the
greatest percentage increase. Other regions demonstrated
a steady scale up during the r eporting period, display ing
the highest increases in Rounds 8 and 9.
Allocation of the Global Fund-approved HIV funding by
spending categories
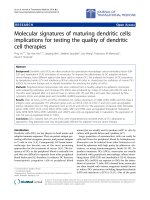
In 2002-2010, most of the funds were allocated to car e
and treatment ($4.3 billion or 36%) and prevention ($3.5
billion or 29%), followed by health systems and commu-
nity systems strengthening and programme management
and administration ($2.6 billion or 22%) (Figure 1).
Funding of US$0.9 billion, or 7%, was approved for
ensuring an enabling environment in countries. Funding
for services aimed at improving the lives of orphans and
other vulnerable children affected by HIV accounted for
$0.3 billion or 3% of the cumulative funding. About 3%
or $0.3 bill ion was approved for workforce activities tar-
geting retention, deployment and rewarding of person-
nel working in the HIV programmes. The remaining
funds were allocated to activities that were classified as
“other”.
In 2002-2010, the Global Fund allocated the majority
of its HIV funding to countries experiencing
Table 1 Variable definitions and data sources
Variable Definition Source of
data
National HIV adult prevalence The percentage of estimated number of all adults 15-49 living with HIV in the country, divided
by population in 2002-2009
UNAIDS [1,10]
HIV prevalence in most-at-risk
populations
The percentage of people who inject drugs, sex workers, and men who have sex with men
who are HIV positive in the country, divided by the population in 2002-2009
UNAIDS [1,10]
Gross national income per capita The gross national income, converted to US dollars using the World Bank Atlas method, divided
by the mid-year population
World Bank
[14]
The Global Fund annual median
funding per capita
The median Global Fund approved funding per country per year converted in 2008 US dollars
divided by mid-year population
Estimates of
the study
Avdeeva et al. Journal of the International AIDS Society 2011, 14:51
/>Page 3 of 10
generalized epidemics (US$8 billion or 68%). Countries
with generalized epidemics received the highest med-
ian per capita funding ($2.9). Funding is allocated to a
lesser extent to countries with concentrated epidemics
($2.9 billion o r 25% of the total portfolio and $1.2 per
capita) and low-level epidemics ($0.9 billion or 7% of
the total portfolio and $1.0 per ca pita). The Global
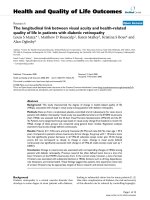
Fund resource allocation to specific programmes
addressing HIV prevention, care and treatment and
non-health categories varies among countries with dif-
ferent types of epidemics, as presented in Figure 2.
Overall, countries with low-level and concen trated epi-
demics allocate a higher propo rtion of their funds to
prevention (43% and 36%, respectively), while countries
with generalized epidemics allocate a larger share to
care and treatment (41%).
In the countries with concentrated epidemics driven
by sexual and injecting drug practices among at-risk
groups, interventions focusing on an enabling environ-
ment account for a larger share (15%) as compared with
countrie s with other types of epidemics. These interven-
tions primarily focus on improving the environment for
safer sex work, as well as stigma reduction.
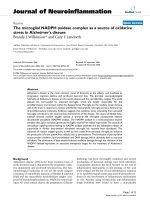
The overall allo cation of the Glo bal Fund resour ces
for prevention varies significantly by type of epidemic.
Figure 3 presents allocation o f funding by type of epi-
demic. In all epidemiological settings, countries showed
a tendency to prioritize interventions for behaviour
change communication (BCC). BCC accounted for 3 8%
to 54% of the cumulative prevention funding. Around
12% was allocated for c ondom distribution, and 14% to
16% to counselling and testing in all epidemiological set-
tings. Funding for prevention of mother to child trans-
mission services was higher, at 20%, in countries
experiencing generalized epidemics as compared with
the other types of epidemics, where it received only 5%
to 6% of the cumulative prevention funding.
The Global Fund investment addressing most-at-risk
populations
A separate analysis was conducted on HIV resources
allocated to specific risk groups, in particular for pro-
grammes targeting people who inject drugs, sex workers
and men who have sex with men (MSM). Cumulatively
approved funding addressing HIV prevention in these
risk groups through HIV programmes represented US
Figure 1 The Global Fund allocations by spending categories: cumulative portfolio, 2002-2010. Source: The Global Fund grant portfolio
database [7].
Avdeeva et al. Journal of the International AIDS Society 2011, 14:51
/>Page 4 of 10
$349 million or about 10% of funding on HIV preven-
tion in 2002-2010 as compared with 6% of the cumula-
tive funding till Round 10.
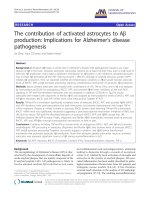
Figure 4 presents the allocation of the Global Fund-
approved funding for people who inject drugs, MSM
and sex workers by type of epidemic. The highest share,
18% of HIV prevention funding, targeted these three
groups in countries with concentrated epidemics with
the rest of the prevention funds invested in interven-
tions for the general po pulation. In the countries with
Figure 2 Allocation of the Global Fund approved funding by type of epidemics. Source: The Global Fund grant portfolio database [7].
Figure 3 Allocation of the Global Fund approved funding for prevention by type of epidemics. Source: The Global Fund grant portfolio
database [7].
Avdeeva et al. Journal of the International AIDS Society 2011, 14:51
/>Page 5 of 10
generalized epidemics, funding for these risk groups
accounted for 5%; in the countries with low-level epi-
demics, it represented 13% of cumulative funding for
HIV p revention. The remaining prevention funds were
allocat ed for interventions targeting the genera l popula-
tion. Relatively low levels of funding were allocated to
the prevention interventions targeting MSM ( $63 mil-
lion or 2% of total prevention funding for MARPs), even
in countries with concentrated epidemics.
Most of the funding for MARPs was channelled
through BCC in terventions. Cumulatively, in 2002-2010 ,
the Glo bal Fund invested $1.5 billion in HIV BCC inter-
ventions. About 13% of these funds, or $199 million,
was allocated for BCC for most-at risk populations.
During the reporting period, th e Global Fund cumula-
tively invested $392 million in condom distribution pro-
grammes. The condom distribution programmes for
MARPs accounted for 13% of the total, or $52 million.
Allocation in accordance with health needs and national
income
The median annual funding per capita for Global Fund-
supported HIV programmes was compared with the
countries’ disease burdens, measured as the share of
adult HIV prevalence and preva lence among MARPs.
The Global Fund funding per capita was also compared
with the level of GNI per capita.
ThemajorityofGlobalFundfundingforHIVpro-
grammes (52%) and the highest median annual per
capita funding ($2.3) was allocated to low-income coun-
tries; 34% of HIV funding ($1.3 per capita) was allocated
to lower-middle income countries; while 14% ($1.1 per
capita) was allocated to upper-middle income countries.
Forty-three low-income c ountries received 52% of
cum ulative funding for HIV programmes from the Glo-
bal Fund, while 55 lower-middle-income and 42 upper-
middle-income countries jointly accounted for 48% of
cumulative Global Fund support for HIV. Several coun-
tries with different levels of income (upper-middle-
income and low-income) receiv e similar funding per
capita regardless of their GNI level. Upper-middle-
income countries, such as Croatia, Mexico and th e Rus-
sian Federation, received per capita funding (less than
US$1) from the Global Fund, comparable with low-
income countries like Bangladesh and Madagascar.
We next assessed the likely predictors of the Global
Fund resource allocation to HIV programmes in 2002-
2010 (Rounds 1-10). The predictor variables were
selected based on the Global Fund country eligibility cri-
teria for fu nding that take into consideration GNI per
capita, adult HIV prevalence and the prevalence of HIV
in MARPs. Table 2 presents the predictors of Global
Fund funding per capita. The coefficients of the regres-
sion show a more significant effect of adult HIV
populations
Figure 4 Alloc ation of the Global Fund cumulative approved funding for most-at-risk populations . Source: The Global Fund grant
portfolio database [7].
Avdeeva et al. Journal of the International AIDS Society 2011, 14:51
/>Page 6 of 10
prevalence and MARPs prevalence on funding per capita
in all 145 countries with approved HIV grants. These
results were consistent for sub-group analysis for low-
income and upper-middle -income countries and for the
regional sub-analysis presented in Table 2.
Results of the analysis for the coefficient of the GNI
per capita showed no strong effect on the per capita
funding for HIV (0.165, significant at p < 0.05). How-
ever, sub-analysis by type of epidemics showed a strong
positive eff ect of GNI per capita in countries with gen-
eralized epidemics. Regional sub-analysis revealed a
positive effect of GNI per capita on the Global Fund
investment only in the Eastern Europe and Central Asia
region.
Discussion
The Global Fund’s guiding principles target investments
in line with need for HIV, tuberculosis and malaria, and
enable allocation of funding based on country demand.
The key HIV funding provided by the Global Fund
was for HIV treatment and care (35%) and prevention
activities (29%). There is an emerging consensus that
appropriately targeted “know-your-epidemic” prevention
efforts need to be expanded and the mix between treat-
ment and prevention interventions need to be adjusted
according to the national epidemiological context and
assessment of the roots of HIV transmission in the
country. In contrast, earlier start points (CD4 cell count
of 350 cells/mm
3
), improved treatment regimens, m ore
effective linkages to care and adherence support and the
treatment-as-prevention paradigm [16,17] would all
increase investments needed for HIV treatment and
care.
Differences in allocation patterns were observed in
relation to the dynamics and severity of t he epidemics.
The majority of the Global Fund HIV invest ments (69%
of cumul ative funds) and the highest per capita funding
were channelled to countries in sub-Saharan Africa
experiencing generalized epidemics. These countries
allocated about 40% of their funding for HIV care and
treatment activities. The review of the investment of
other key donors in HIV control showe d that in 2002-
2009, most PEPFAR funds also went to countries with
generalized epidemics and mostly for HIV treatment
[18], whereas domestic and international funding for
prevention remained underf unded [19]. Glo bal invest-
ment into HIV treatment and prevention c ould bring
better outcomes if national and international efforts to
control HIV epidemics were balanced between the most
effective programmatic interventions.
A lower shar e of the Global Fund HIV investment, as
well as lower per capita funding, was targeted to coun-
tries experiencing concentrated and low-level epidemics
where the recorded infection was largely confined to
individuals with risk behavi ours, for example, sex work-
ers, people who inj ect drugs and men who have sex
with men. Our analysis showed v ariability in the Global
Fund funding for prevention interventions by type of
Table 2 Assessing the predictors of Global Fund funding per capita
Variables GNI per capita,
2009
HIV prevalence
14-45, 2009
Prevalence in
MARPs
All countries-recipients of the Global Fund HIV programmes (n = 145)
Annual median per capita funding for HIV 0.282 (1.415)* 0.313 (1.937)*** 0.370 (2.118)***
Low-income countries (n = 40)
Annual median per capita funding for HIV NS 0.483 (1.795)** 0.338 (-0.047)*
Upper-middle-income countries (n = 37)
Annual median per capita funding for HIV NS 0.425 (1.380)*** 0.820 (2.412)***
Concentrated epidemics (n = 52)
Annual median per capita funding for HIV 0.121 (2.244)** 0.311 (1.840)* 0.580 (1.205)*
Generalized epidemics (n = 48)
Annual median per capita funding for HIV 0.427 (2.467)*** 0.250 (1.322)** 0.480 (1.783)**
Sub-Saharan Africa region (n = 43)
Annual median per capita funding for HIV NS 0.355 (2.073) 0.118 (0.959)
Eastern Europe and Central Asia region (n = 24)
Annual median per capita funding for HIV 0.621 (-1.446)* 0.430 (2.104)** 0.625 (2.1943)***
Latin America and Caribbean region (n = 30)
Annual median per capita funding for HIV NS 0.530 (1.775)* 0.748 (2.430)***
Asia region (n = 27)
Annual median per capita funding for HIV NS 0.350 (1.840) 0.348 (1.271)
Avdeeva et al. Journal of the International AIDS Society 2011, 14:51
/>Page 7 of 10
epidemics. All Global Fund countries prioritized beha-
viour change communication interventions in their pre-
vention activities, reaching about half of all prevention
funds in countries with low-level epidemics. However,
cumulatively, only 11% of all of such interventions tar-
geted most-at-risk populations, which are more effective
in settings where HIV burden is high among risk groups
[20-24].
The next priority for Global Fund recipients was social
marketing of condoms and HIV counselling and testing.
While there is some evidence of success in turning
around generalized HIV epidemics by changing sexual
behaviour, this turns out to be most effective in risk
groups in concentrated epidemics [25-29]. Several stu-
dies show only modest evidence for the effectiveness of
counselling and testing activities in generalized epi-
demics settings compared with concentrated epidemics,
but concluded that it should not negate the need to
expand them [30-35]. Its great potential should be
weighed against other interventions in allocating preven-
tion funding.
In 20 02-2010, about 10% of the Global Fund’s cumu-
lative approved funding for HIV prevention was allo-
cated to interventions targeting sex workers, people who
inject drugs and men who have sex with men. In coun-
tries with concentrated and low-level epidemics, funding
for interventions targeting prevention in most-at-risk
populations a ccount for 18% and 13% of all prevention
activities, respectively. The rest of the preventive funds
were invested in interventions for the general population
that did not address the epidemiological context of the
concentrated epidemics. New evidence suggests that tar-
geted approach in funding allocated to the major risks
of transmission and acquisition of HIV infection in the
concentrated epidemics provides the greatest effect and
substantial changes might be possible with a few appro-
priately targeted efficacious interventions [36].
Although there was low funding for the most-at-risk
populations, a review of the UNAIDS country reports
on HIV financing in 2005-2009 showed that the Global
Fund was the only or the major funding source targeting
risk groups for HIV prevention activities for most-at-risk
populations in many countries of the Eastern Europe
and Central Asia region (such as Albania, Armenia, Bul-
garia, Croatia, Georgia, Kazakhstan, Kyrgyzstan, the for-
mer Yugoslav Republic of Macedonia, Romania,
Tajikistan and Ukraine), as w ell as in countries of other
regions (such as Algeria, China, Ecuador, Madagascar,
Mongolia, Swaziland and Thailand) [1,7,10,37].
The Global Fund resource allocation model seeks to
ensure that funding is going to where it is most needed.
For the purposes of this analysis, the need is interpreted
in terms of HIV burden and national income [38]. The
observed relationships betwee n the HIV funding per
capita, national HIV prevalence and prevalence in
MARPs indicate that the Global Fund resource alloca-
tions to HIV programmes best correspond to the HIV
prevalence in the applicant countries.
Our analysis shows that the Global Fund eligibility
criteria resulted in allocating more funds to countries
with lower national in come. In 2002-2010, the Global
Fund provided more support to low- and low-middle
income countries (52% and 34% of cumulative funding
and US$2.3 and $1.3 per capita, respectively), which is
in line with the equity principles of the Global Fund
[15]. Country GNI per capita, although positive, was
not statistically significant with regards to the Global
Fund allocations per capita, except for the Eastern Eur-
opeandCentralAsiaregionandwithinthegroupof
countries with generalized epidemics. For some upper-
middle-income countries, mostly representing the East-
ern Europe and Central Asia and the Latin Ame rica
and Caribbean regions, the funding per capita was
comparable to those in low-income countries, disre-
garding the higher cost of living and higher unit cost
of HIV interventions in the concentrated HIV trans-
mission settings of these regions. This demonstrates
that the Global Fund invests in HIV programmes in
countries with the least financial ability to address the
problem.
However, within this group, the HIV funding does not
linearly corre spond to the country’s national income.
The national HIV prevalence and prevalence in MARPs
predict the magnitude of the Global Fund investment,
acknowledging the focus of the Global Fund pro-
grammes not only on the income level of the countries,
but also in prioritizing the most-in-need countries and
population groups; the latter was addressed in Round 10
(2010). A targeted response to concentrate d epidemics
is being achieved t hrough revised prio ritization criteria
adoptedbytheGlobalFundBoardforRound10that
allowed upper-middle-income countries to access fund-
ing solely for most-at-risk populations.
This expansion of the Global Fund eligibility criteria
for upper-middle income countries allowed the organi-
zation to overcome one of the drawbacks of the use of
the GNI per capita Atlas method indicator as one o f
the eligibility criteria as it is affected by annual fluctua-
tionsinthevalueoftherespectivedomesticcurrencies
in relation to the US dollar [39,40] and excludes some
countries in need from being eligible to receive sup-
portfromtheGlobalFund.TheuseoftheGNIper
capita indicator as a criteria for eligibility for Global
Fund support does not account for the sub-national
distribution of income, which is part of the social pol-
icy in many upper-middle-income applicant countries,
where sub-national averages of income significantly
deviate from national averages and affect subsequently
Avdeeva et al. Journal of the International AIDS Society 2011, 14:51
/>Page 8 of 10
equity in resource allocation by income [41-44]. The
regression analysis we conducted using purchasing
power parity did not bring significant difference in the
results; thus, we are not presenting them in this paper.
We have not adjusted our analysis to control for the
variationsintheunitcostofservicedeliveryinthe
countries with different income level that might evi-
dence a stronger correlation between GNI and the
Global F und funding.
This study assessed only some of the considerations
that predict the Global Fund’s funding decisions. These
include HIV prevalence, prevalence of risk factors and
national income. However, there are other fac tors that
influence Global Fund resource allocation, as well as the
country’s demand for HIV funding, such as the potential
for a rapid increase in burden of disease due to the cur-
rent trends, size of population at risk, and extent of
cross-border and internal migration.
The Global Fund resource allocation decisions are also
based on the levels of national contributions to the
financing of the proposal and contributions of other key
funders, such as PEPFAR, the World Bank and the Bill
& Melinda Gates Foundation, in order to ensure that
Global Fund support for HIV is as additional to o ther
sources a s possible. The country capacity to implement
the grant and existence of supportive national policies
play a vital role in the distributi on of the Glob al Fund’s
resources. These are the areas that sho uld be further
explored to ensure an evidence- and performance-based
resource allocation for HIV control in the Global Fund
recipient countries.
Conclusions
The Global Fund resource allocation model allows for
the scale up of investment in HIV prevention, treatment,
care and support programmes, and its funding is aligned
with HIV burde n and nation al income. Howe ver, pre-
vention in most-at-risk populations still does not have
an urgent enough priority in most of the country pro-
grammes supported by the Global Fund. The intensified
and targeted response to HIV control in these popula-
tions was further addressed through revised prioritiza-
tion criteria adopted by the Global Fund Board for
Round 10. More guidance is being provided for Round
11 to strategical ly focus demand for Global Fund finan-
cing, which is crucial in the present resource-con-
strained environment.
Acknowledgements
This paper draws extensively on the Assessment of the Global Fund HIV
portfolio for 2002-2010 conducted by O Avdeeva (The Global Fund) and S
Byberg (intern from Copenhagen University) with contributions and
comments by Global Fund experts, A Fakoya, E Korenromp, MA Lansang, I
Oliynyk, A Seale, G, Shakarishvili and K Viisainen.
Author details
1
The Global Fund to Fight AIDS, Tuberculosis and Malaria, Chemin de
Blandonnet 8, CH-1214 Vernier, Geneva, Switzerland.
2
Copenhagen HIV
Programme, Copenhagen University, Blegdamsvej 3B, DK-2200 Copenhagen
N, Denmark.
3
Stop TB, East Mediterranean Regional Office, World Health
Organization, Abdul Razzak Al Sanhouri Street, P.O. Box 7608, Nasr City, Cairo
11371, Egypt.
4
Imperial College London, London SW7 2AZ, UK.
Authors’ contributions
OA contributed to the conception and design of the study, data collection,
analysis and its interpretation, as well as drafting of the initial manuscript.
JVL made substantial contributions to data interpretation and revising of the
manuscript. MAA was involved in the drafting of the manuscript and
substantially contributed to data interpretation. RA substantially contributed
to the conception and design of the study, as well as to data interpretation.
All authors have read and approved the final manuscript.
Competing interests
During the manuscript writing all the authors worked for the Global Fund to
Fight AIDS, Tuberculosis and Malaria.
Received: 23 November 2010 Accepted: 26 October 2011
Published: 26 October 2011
References
1. Joint United Nations Programme on HIV/AIDS (UNAIDS): UNAIDS Report on
the global AIDS epidemic 2010 Geneva; UNAIDS; 2010.
2. Lazarus JV, Curth N, Bridge J, Atun R: Know your epidemic, know your
response: targeting HIV in Asia. AIDS 2010, 24 Suppl 3:S95-S99.
3. Kates J, Boortz K, Lief E, Avila C, Gobet B: Financing the Response to AIDS in
Low- and Middle-Income Countries: International Assistance from the G8,
European Commission and Other Donor Governments in 2009 Kaiser Family
Foundation; 2010.
4. UNAIDS: National AIDS Spending Assessment: A notebook on methods,
definitions and procedures to measure HIV and AIDS financial flows and
expenditure at the country level Geneva, Joint United Nations Programme on
HIV/AIDS (UNAIDS); 2008.
5. UNAIDS: National AIDS Spending Assessment (NASA): classification and
definitions Geneva: Joint United Nations Programme on HIV/AIDS; 2008.
6. World Health Organization, World Bank, United States Agency for
International Development: Guide to producing National Health Accounts:
with special applications for low-income and middle-income countries
Geneva, World Health Organizations; 2003.
7. The Global Fund to Fight AIDS, Tuberculosis and Malaria: Grant portfolio
database [ />8. Rice DP: Cost of illness studies: what is good about them? Injury
Prevention 2000, 6:177-179.
9. Drummond M: Cost-of-Illness Studies: A Major Headache?
Pharmacoeconomics 1992, 2(1):1-4.
10. Joint United Nations Programme on HIV/AIDS (UNAIDS): Report on the
global AIDS epidemics Geneva: Joint United Nations Programme on HIV/
AIDS; 2008.
11. UNAIDS: National AIDS Spending Assessment Country Reports [http://www.
unaids.org/en/KnowledgeCentre/HIVData/Tracking/Nasa.asp].
12. The Global Fund to Fight AIDS, Tuberculosis and Malaria: Five-Year
Evaluation Study Area 3: Health Impact of Scaling Up Against HIV, TB &
Malaria Geneva: The Global Fund; 2008 [ />terg/evaluations/5year/?lang=en].
13. The Global Fund to Fight AIDS, Tuberculosis and Malaria: Review of the
Global Fund grant portfolio. Funding the right things? Technical Evaluation
Group technical report Geneva: The Global Fund; 2006.
14. World Bank: World Development Indicators database Washington, USA; 2010
[ />15. The Global Fund to Fight AIDS, Tuberculosis and Malaria: The framework
document of the Global Fund to Fight AIDS, Tuberculosis and Malaria Geneva:
The Global Fund; 2002.
16. Vernazza P, Hirschel B, Bernasconi E, Flepp M: Les personnes seropositives
ne souffrant d’aucune autre MST et suivant un traitment antiretroviral
efficace ne transmettent pas le VIH par voie sexuelle. Bulletin des
Médecins Suisses 2008, 89:165-169.
Avdeeva et al. Journal of the International AIDS Society 2011, 14:51
/>Page 9 of 10
17. Wilson D, Law M, Grulich E, Cooper D, Kaldor J: Relation between HIV viral
load and infectiousness: a model-based analysis. Lancet 2008,
372:314-320.
18. The U.S. President’s Emergency Plan for AIDS Relief: PEPFAR Country statistics
[ />19. Izazola-Licea JA, Wiegelmann J, Aran C, Guthrie T, De Lay P, Avila-
Figueroa C: Financing the responce to HIV in low-income and middle-
income countries. J Acquir Immune Defic Syndr 2009, 52:119-126.
20. Halperin DT, Steiner MJ, Cassell MM, Green EC, Hearst N, Kirby D, Gayle HD,
Cates W: The time has come for common ground on preventing sexual
transmission of HIV. Lancet 2004, 364:1913-1915.
21. Mathers B, Degenhardt L, Ali H, Wiessing L, Hickman M, Mattick R, Myers B,
Ambekar A, Strathdee S: HIV prevention, treatment, and care services for
people who inject drugs: a systematic review of global, regional, and
national coverage. Lancet 2010, 375:1014-1028.
22. Strathdee SA, Hallett TB, Bobrova N, Rhodes T, Booth R, Abdool R,
Hankins C: HIV and the Risk Environment among People Who Inject
Drugs: Past, Present, and Projections for the Future. Lancet 2010,
376(9739):398-400.
23. Kenya National AIDS Control Programme, The World Bank: Kenya HIV
prevention response and modes of transmission analysis Nairobi, Kenya:
National AIDS Control Programme; 2009.
24. The World Bank: New HIV infections by mode of transmission in West Africa: a
multi-country analysis Dakar, Senegal: UNAIDS Regional Support Team for
West and Central Africa; 2010.
25. Wilson D: HIV epidemiology: A review of recent trends and lessons Global HIV/
AIDS Program, Washington: World Bank; 2006.
26. Green EC, Mah TL, Ruark A, Hearst N: A framework of sexual partnerships:
risks and implications for HIV prevention in Africa. Stud Fam Plann 2009,
40:63-70.
27. Chen L, Jha P, Stirling B, Sgaier S, Daid T, Kaul R, Nagelkerk N: Sexual risk
factors for HIV infection in early and advanced HIV epidemics in sub-
Saharan Africa: systematic overview of 68 epidemiological studies. PLoS
One 2007, 2:1001.
28. Menzies N, Abang B, Wanyenze R, Nuwaha F, Mugisha B, Coutinho A,
Bunnell R, Mermin J, Blandford J: The costs and effectiveness of four HIV
counseling and testing strategies in Uganda. AIDS 2009, 23:395-401.
29. Denison JA, O’Reilly KR, Schmid GP, Kennedy CE, Sweat MD: HIV voluntary
counseling and testing and behavioral risk reduction in developing
countries: a meta-analysis. AIDS Behav 2008, 12:363-373.
30. Hearst N, Chen S: Condoms for AIDS Prevention in the Developing
World: Is It Working? Studies in Family Planning 2004, 35:39-47.
31. Weinhardt LS, Carey MP, Johnson BT, Bickman NL: Effects of HIV
counseling and testing on sexual risk behavior: a meta-analytic review
of published research.
Am J Pub Health 1999, 89:1397-1405.
32. Bassett IV, Giddy J, Nkera J, Wang B, Losina E, Lu Z, Freedberg K,
Walensky R: Routine voluntary HIV testing in Durban, South Africa: the
experience from an outpatient department. J Acquir Immune Defic Syndr
2007, 46:181-186.
33. UNAIDS: Redefining AIDS in Asia: Crafting an effective response Geneva: Joint
United Nations Programme on HIV/AIDS; 2008.
34. World Bank: AIDS in South Asia Understanding and Responding to a
Heterogeneous Epidemic Washington, DC: World Bank; 2006.
35. April MD, Walensky RP, Chang Y, Pitt J, Freedberg KA, Losina E, Paltiel AD,
Wood R: HIV testing rates and outcomes in a South African community,
2001-2006: implications for expanded screening policies. J Acquir
Immune Def Syndr 2009, 51:310-316.
36. Schwartländer B, Stover J, Hallett T, Atun R, Avila C, Gouws E, Bartos M,
Ghys PD, Opuni M, Barr D, Alsallaq R, Bollinger L, de Freitas M, Garnett G,
Holmes C, Legins K, Pillay Y, Stanciole AE, McClure C, Hirnschall G, Laga M,
Padian N: Towards an improved investment approach for an effective
response to HIV/AIDS. Lancet 2011, 377:2031-2041.
37. UNAIDS: Resource Tracking Data Geneva: Joint United Nations Programme
on HIV/AIDS;[ />asp].
38. Wagstaff A, Claeson M: The Millennium Goals for health: Rising to the
challenges Washington, DC: World Bank; 2004.
39. United Nations Committee for Development Policy: Report of the Expert
Group Meeting on Improving the Criteria for Identification of Least Developed
Countries New York: United Nations; 2005, 20.
40. World Bank: The 2005 International Comparison Program Preliminary Global
Report compares Size of Economies Washington, DC: World Bank; 2007
[ />41. Keidel A: China Regional Disparities: The Causes and Impact of Chinese
Regional Inequalities in Income and Well-Being Washington, D.C.: Carnegie
Endowment for International Peace; 2007.
42. Heshmati A: Regional income inequality in selected large countries Bonn:
Institute for the Study of Labor; 2004, 1307.
43. Hofman B, Guerra S: Ensuring inter-regional equity and poverty reduction
Atlanta: Georgia State University; 2004, 4-11.
44. United Nations Development Programme: Russia’s Regions: Goals,
Challenges, Achievements. Human Development Report Russia 2006/2007
Russia: United Nations Development Project; 2007.
doi:10.1186/1758-2652-14-51
Cite this article as: Avdeeva et al.: The Global Fund’s resource allocation
decisions for HIV programmes: addressing those in need. Journal of the
International AIDS Society 2011 14:51.
Submit your next manuscript to BioMed Central
and take full advantage of:
• Convenient online submission
• Thorough peer review
• No space constraints or color figure charges
• Immediate publication on acceptance
• Inclusion in PubMed, CAS, Scopus and Google Scholar
• Research which is freely available for redistribution
Submit your manuscript at
www.biomedcentral.com/submit
Avdeeva et al. Journal of the International AIDS Society 2011, 14:51
/>Page 10 of 10