báo cáo hóa học:" Aflatoxin levels, plasma vitamins A and E concentrations, and their association with HIV and hepatitis B virus infections in Ghanaians: a cross-sectional study" pdf
Bạn đang xem bản rút gọn của tài liệu. Xem và tải ngay bản đầy đủ của tài liệu tại đây (266.03 KB, 10 trang )
RESEARCH Open Access
Aflatoxin levels, plasma vitamins A and E
concentrations, and their association with HIV
and hepatitis B virus infections in Ghanaians:
a cross-sectional study
Francis A Obuseh
1
, Pauline E Jolly
2*
, Andrzej Kulczycki
1
, John Ehiri
3
, John Waterbor
2
, Renee A Desmond
4
,
Peter O Preko
5
, Yi Jiang
2
and Chandrika J Piyathilake
6
Abstract
Background: Micronutrient deficiencies occur commonly in people infected with the human immunodeficiency
virus. Since aflatoxin exposure also results in reduced levels of several micronutrients, HIV and aflatoxin may work
synergistically to increase micronutrient deficiencies. However, there has been no report on the association
between aflatoxin exposure and micronutrient deficiencies in HIV-infected people. We measured aflatoxin B
1
albumin (AF-ALB) adduct levels and vitamins A and E concentrations in the plasma of HIV-positive and HIV-
negative Ghanaians and examined the association of vitamins A and E with HIV status, aflatoxin levels and hepatitis
B virus (HBV) infection.
Methods: A cross-sectional study was conducted in which participants completed a demographic survey and gave
a 20 mL blood sample for analysis of AF-ALB levels, vitamins A and E concentrations, CD4 counts, HIV viral load
and HBV infection.
Results: HIV-infected participants had significantly higher AF-ALB levels (median for HIV-positive and HIV-negative
participants was 0.93 and 0.80 pmol/mg albumin, respectively; p <0.01) and significantly lower levels of vitamin A
(-16.94 μg/dL; p <0.0001) and vitamin E (-0.22 mg/dL; p <0.001). For the total study group, higher AF-ALB was
associated with significantly lower vitamin A (-4.83 μg/dL for every 0.1 pmol/mg increase in AF-ALB). HBV- infected
people had significantly lower vitamin A (-5.66 μg/dL; p = 0.01). Vitamins A and E levels were inversely associated
with HIV viral load (p = 0.02 for each), and low vitamin E was associated with lower CD4 counts (p = 0.004).
Conclusions: Our finding of the significant decrease in vitamin A associated with AF-ALB suggests that aflatoxin
exposure significantly compromises the micronutrient status of people who are already facing overwhelming
health problems, including HIV infection.
Background
Sub-Saharan Africa accounts for approximately two-
thirds of all persons infected by HIV, and approximately
70% of new cases of HIV infection worldwide [1].
Although the estimated adult H IV seroprevalence rate
in Ghana in 2007 was 1.9% [2], the HIV sentinel surv ey
indicates that the seroprevalence rate in the country var-
ies by region from 0.8 to 8.4% [2].
Sub-Saharan Africa is disproportionately burdened by
malnutrition and deficiencies of nutrients, such as vita-
mins A, B, C, D and E, which have been implicated in
HIV transmission and progression [3-5]. These and
other studies have shown that deficiencies of vitamins A
and E are positively associated with HIV transmission,
disease progression and mortality [3-7]. Micronutrient
malnutrition further impairs the immune system by sup-
pressing immune function necessary for survival [8].
* Correspondence:
2
Department of Epidemiology, School of Public Health, University of
Alabama at Birmingham, Birmingham, Alabama, USA
Full list of author information is available at the end of the article
Obuseh et al. Journal of the International AIDS Society 2011, 14:53
/>© 2011 Obuseh et a l; licensee BioMed Central Ltd. This is an Open Access article distributed under the terms of the Cr eative Commons
Attribution License (http://creativecommons.o rg/licenses/by/2.0), which permits unrestricted use, distribution, and reproduction in
any medium, provided the original work is properly cited.
A study by Jiang et al [9] showed that vitamin A defi-
ciency is common in certain parts of Ghana and is asso-
ciated with impairment of innate and cytotoxic immune
function. Vitamin E is a lipophilic antioxidant that also
protects cell membranes. Studies conducted in HIV-
infected individuals have shown that vitamin E reduces
the production of oxidant compounds in lymphocytes
that would otherwise lead to viral activation or cell
death [10]. Vitamin E deficiency has been shown to
increase t he occurrence of wasting, oxidative stress and
HIV viral load, and is a driving force for viral mutation
[11].
However, supplementation of vitamins A and E or
multivitamins has not always been shown to have bene-
ficial effects. For example, it has been shown that vita-
min A may increase sexual or perinatal transmission of
HIV by increasing genital shedding [12] or increase
transmission through breast milk when breastfeeding
mothers are supplemented [13]. Similarly, vitamin A
supplementation trials have had mixed effects on clinical
outcomes , such as child morbidity and HIV disease pro-
gression [14,15]. In addi tion, vitamin E may facilitate
HIV entry into cells and higher plasma vitamin E levels
have been associated with adverse outcomes in HIV
[16].
Aflatoxins are toxic metabolites of Aspergillus species
of fungi, such as A. flavus and A. parasiticus, which are
found naturally in some staple foods, such as ground-
nuts, maize and other oil seeds. They constitute the
most potent hepatoca rcinogens known [17]. In West
African countries, including Ghana, aflatoxins are com-
monly found as contaminants in human and animal
food [18-21]. Crops can become contaminated with afla-
toxin-producing fungi during growth, b ut fungal prolif-
eration and toxin production increase during storage of
improperly dried grains and nuts under hot, humid and
unsanitary conditions.
Acute and chronic exposures to aflatoxins compro-
mise immunity and enhance macro- and micro-nutrient
malnutrition and ne onatal jaundice [19,22,23]. Exposure
to aflatoxin has been found to be associated with
reduced serum concentrations of vitamins A and vita-
min E in swine [24,25]. Two recent studies have
reported on the association between aflatoxin B
1
albu-
min (AF-ALB) adduct levels and vitamins A and E in
Ghanaians.
Obuseh et al [26] foun d a significant inverse relation-
ship b etween AF-ALB and vitamin A and a non-signifi-
cant inverse relationship between AF-ALB and vitamin
E deficiency, whereas Tang et al [27] found significant
negative correlations between both vitamins A and E
concentrations and AF-ALB levels. Jiang et al [28] also
found alterations in certain immunological parameters
of Ghanaians with high AF-ALB levels. These alterations
could result in impairments in cellular immunity that
decrease resistance to infections.
Thus, aflatoxin and HIV may work synergistically in
HIV-positive people to increase micronutrient deficien-
cies and immune suppression, and so promote HIV dis-
ease progression. No studies have examined the
association between micronutrie nt deficiency and afla-
toxin exposure among people living with HIV. We mea-
sured aflatoxin levels and vitamins A and E
concentrations in plasma of HIV-positive and HIV-nega-
tive Ghanaians chronically exposed to aflatoxin in their
diets and examined the association of vitamins A and E
concentrations, HIV status, AF-ALB levels and hepatitis
B virus (HBV) infection.
Methods
Study location, design and target population
A cross-sectional study using a convenience sample of
HIV-positive and HIV-negative males and females 19
years of age and older was conducted in Kumasi (a
major maize and peanut-producing and consuming
area) in the Ashanti Region of Ghana. All HIV-positive
and some HIV-negative study participants were
recruited from a hospital that cared for both HIV-posi-
tive and HIV-negative persons. Potential participants
were introduced to the research team by the physicians.
All HIV-positive persons who were not acutely ill were
eligible to participate in the study. No participant was
hospitalized or was acutely ill; all were outpatients.
Some HIV-negative persons were recruited from the
community and all (clinic and community recruits) had
no record of HIV positivity or symptoms of HIV infec-
tion (either from clinic records or self-report). HIV-
negative individuals who were recruited from the com-
munity came to the hospital to participate in the study.
HIV-positive study participants had previously been
tested for HIV and their positive test resul ts were avail-
able in their medical charts. Two rapid tests are used to
screen for HIV in Ghana.
Atthetimeofthestudy,theDetermineHIV-1/2test
(Abbott Laboratories, Abbott Park, IL, USA) was used
as the fir st screening test. If a person tested positive for
HIV or had an indeterminate result, the result was
checked using a RapiTest HIV 1 and 2 kit (Morwell
Diagnostics GmbH, Egg/ZH, Switzerland). An ELISA
test was used as a tiebreaker if there was disagreement
in the results from the two rapid tests. Plasma samples
from HIV-negative participants were tested for HIV
using the Coulter p24 antigen assay and those found to
be HIV negative w ere included as HIV negatives in the
study. Approximately 30% of HIV-positive participants
were on ART.
All participants were volunteers and gave informed
consent. Pregnant women, individuals younger than 19
Obuseh et al. Journal of the International AIDS Society 2011, 14:53
/>Page 2 of 10
years of age and acutely ill persons were excluded from
the study. A target sample size of 300 subjects w as spe-
cified for the study. This sample size of 300 was based
on the expected prevalence of vitamin A deficiency of
35%, an alpha level of 0.05 and precision of 5%. Based
on a hypothesized difference of 25% (35% deficiency
among HIV-negative and 50% among HIV-positiv e indi-
viduals), we would need about 150 per group to detect a
statistically significant result (odds ratio of 2.0).
Informed consent was obtained from 305 (147 HIV-
negative and 158 HIV-positive) participants who were
enrolled in the study. Approval for the study was
obtained from the Institutional Review Board at the
University of Alabama at Birmingham ( UAB), and the
Committee on Human Research, Publication and Ethics,
Kwame Nkrumah University of Sci ence and T echno logy
(KNUST) College of Health Sciences, Kumasi, Ghana.
Data and blood sample collection
An interviewer-administered questionnaire on demo-
graphic characteristics was completed for each partici-
pant. A 20 mL sample of venous blood was drawn from
each participant using sterile needles and vacutainer
tubes. The tubes were wrapped in foil to reduce the
effect of oxidation and light on retinol. Blood was trans-
ported to the laboratories of the Kumasi Center for Col-
laborative Research (KCCR) in Tropic al Medicine at
KNUST within six hours of collection.
Plasma was obtained by centrifugation at 3000 rpm
for five minutes and aliquoted into vials for the different
analyses, mainly retinol, tocopherol, HIV viral load,
HBV surface antigen, and AF-ALB. The vials containing
plasma for retinol and tocopherol analysis were wrapped
in aluminum foil and kept in thick black poly thene bags
at -80°C. These samples were subsequently air trans-
ported to UAB and kept at -80°C until analyzed.
Simultaneous determination of retinol (vitamin A) and
tocopherol (vitamin E) in plasma
A modified version of the high-performance liquid chro-
matography (HPLC) procedure developed by Stacewicz-
Sapuntzakis et al [29] was used to measure both vita-
mins A and E in plasma. The HPLC system included
150 × 3.9 mm Nova-pak C18 (4 microns) column with
a guard pak pre-column (bothfromWaters,Milford,
MA), Waters Millipore TCM column heater, Waters
490 multi-wavelength detector, Hitachi 655-61 proces-
sor, Hitachi 655A-11 liquid chromatography, and Bio-
Rad auto sampler AS-10 0. The mobile phase consisted
of methanol/acetonitrile/methylene chloride (50:45:5, v/
v/v; Mallinckrodt Specialty Chemical Co., Paris , KY) run
at 1 ml/min.
Vitamin A (all trans retinoic acid) was obtained from
Sigma Chemical Co., St. Louis, MO, and vitamin E (dl-
alpha tocopherol) and tocol were obtained from Hoff-
mann-La Roche Inc., Nutley, NJ. Tocol is a tocopherol
derivative that is used as an internal standard to correct
for any loss in retinol and tocopherol during the extrac-
tion procedure. It was chosen as an internal standard
because it is well separated from retinol under the nor-
mal phase co nditions. In preparation of the standards,
vitamins A and E were dissolved in ethanol and concen-
trations were measured at 325 nm and 292 nm, respec-
tively, u sing a programmable multi-wavelength detector
(Waters 490). Tocol was dissolved in ethanol (0.3µg/
mL). All procedures were performed in subdued yellow
light. Fresh standards were prepared for each assay and
standard curves were constructed by plotting peak
heights against the concentrations of vitamin standards.
Plasma samples from study participants were th awed
and 200 μL of each placed in a separate test tube; 100
μL of the internal standard (tocol) and 100 μLethanol
for protein precipit ation were added and the tubes were
vortexed for two minutes. For ex traction, 1 mL of hex-
ane (EM Science, Cherry Hill, NJ) was added and the
mixture was vortexed for five minutes and centrifuged
at 8000 revolutions per minute for 10 minutes. The top
hexane layer containing the micronutrients was carefully
removed with a Pasteur pipette into another microcen-
trifuge tube, dried using a rotary speed-vac concentra-
tor/evaporator (Savant Instrument Inc, Farmingdale,
NY), and heated to 37ºC for 25 minutes. The residue
was dissolved in 200µL mobile phase and vortexed for
30 seconds. Twenty microliters of this extract was
injected for chromatographic analysis.
Tocol internal standard was used to determine the
percent recovery in samples. For quality control, pooled
normal human plasma samples were divided into two
portions of high and low concentration for vitamin A
and E, and prepared for analysis in the same manner as
the patient samples. These were run in each assay. Eva-
luation of the laboratory performance was assessed by
comparing the results of the quality control samples
with the mean and standard deviations (SD) calculated
from the results of several runs of the assay. The run
was rejected if any value fell outside the range of ± 2
SD from the mean.
Determination of AF-ALB levels in plasma by
radioimmunoassay
AF-ALB levels in plasma from study participants were
determined by radioimmunoassay (RIA) [30]. The assay
measures aflatoxin that is covalently bound in peripheral
blood albumin and reflects aflatoxin exposure in the
previous two to three months. Plasma samples were
concentrated by high-speed centrifugal filtration, and
the concentrated protein was re-suspended in phosphate
buffered saline (PBS). Plasma albumin was determined
Obuseh et al. Journal of the International AIDS Society 2011, 14:53
/>Page 3 of 10
by using a bromocresol purple dye binding method
(Sig ma, St. Louis, MO), and the amount of total protein
was determined by using the Bradford procedure (San
Rafael, CA). Total protein per sample was then digested
with Pronase (Calbiochem, La Jolla, CA), and bound
aflatoxin was extracted with acetone.
The RIA procedure [30] was used to quantify AF-ALB
in duplicate plasma p rotein digests that each contained
2 mg of protein. Normal human serum/plasma samples
purchasedfromSigma-Aldrich(St.Louis,MO)and
authentic AFB-albumin standard were used for quality
control purposes. The standard curve for the RIA was
determined by using a nonlinear regression method.
The concentrations o f albumin, total protein and AF-
ALB in individual plasma samples were calculated, and
the values were expressed as pmol AF-ALB per mg
albumin [30]. The accuracy of the analysis based on
three days ranged from 93.3% to 96.3% for low concen-
tration quality control. (0.1 pmol AF-ALB) and from
92.2% to 97.3% for high concentration quality control (2
pmol AF-ALB). The within day imprecision was 5.9% (n
= 15) for LQC and 2.9% (n = 15) for HQC. The overall
var iation of inaccuracy and imprecision rates are within
10%. The average recovery (0.1-5.0 pmol AF-ALB) was
88.1% ± 5.2%. The detection limit of the assay was 0.01
pmol/mg albumin.
Determination of CD4+ T cell count
Circulating CD4+ T cell populations were determined
by flow cytometry using fluorescein isothiocyante-
labelled monoclonal antibody against CD4 (BD Phar-
Mingen, San Diego, CA). Isotype-matched controls (BD
PharMingen, San Diego, CA) were used in all experi-
ments. Briefly, cells were washed and stained with
monoclonal antibodies for 30 minutes in the dark at 4°
C. They were then washed twice with staining PBS sup-
plemented with 0.1% sodium azide and 1% fetal bovine
serum pH 7.4, (BD PharMingen, San Diego, CA) and
fixed in 4% paraformaldehyde in PBS (BD PharMingen,
SanDiego,CA).Thecellsweresubsequentlyrunona
fluorescent activated cell sorting instrument (Becton
Dickinson, San Diego, CA) and analyzed using Cell-
Quest software. Cells were gated on live peripheral
bloo d lymphoc yte population identified by forward- and
side-scatter parameters, and at least 10,000 cells were
acquired. Absolute CD4 counts were derived by using
the percentage of CD4+ T cells in relation to the lym-
phocyte fraction determined by automatic differential
blood count, as performed in the biochemistry labora-
tory at the KNUST.
Quantitative HIV-1 RNA assay
HIV-1 RNA was measured using a quantitative reverse
transcriptase polymerase chain reaction assay (Amplicor
Monitor, Roche Diagnostic System, Brandersburg, NJ).
Virus from 0.2 ml of plasma was lysed in the kit lysis
buffer, and the HIV RNA was precipitated using isopro-
panol and pelleted by centrifugation. After washing with
ethanol, the RNA was re-suspended in the kit dilution
buffer. Extracted RNA was amplified and detected
according to the manufacturer’s instructions. The results
were reported as HIV RNA copies/mL. All undetectable
values (below 400 copies) were assigned a value of 399.
The maximum detectable limit was 750,000 copies/mL.
Test for HBV surface antigen
HBV surface antigen (HBsAg) in plasma samples was
determined using the Bio-Rad Enzyme Immunoassay
according to the manufacturer’sdirections(Bio-Rad,
Redmont, WA, USA). Briefly, 100µL of specimens or
controls were added in duplicate to appropriate wells on
a microwell strip plate coated with mouse monoclonal
antibody to HBVsAg and incubated for 60 minutes at
37°C. After washing, 100µL of peroxidase-conjugated
mouse monoclonal antibodies against HBsAg was added
to each well and the plate was incub ated for 60 minutes
at 37°C.
The plates were then washed; 100µL of tetramethyl-
benzidine substrate solution was added to each well and
incubated in the dark for 30 minutes at room tempera-
ture. The reaction was stopped with the addition of
100µL of stopping solution to each well and the plate
was read on a spectrophotometer at 450 nm. A sample
was considered initially reactive for anti-HBs if the
absorbance value was greater than or equal to the cut-
off value. The cut-off value was determined by addition
of 0.07 to the mean absorbance value of the HIV-nega-
tive controls. Positive samples were determined by
repeated reactivity in duplicate tests.
Tests of liver function (aminotransferases, bilirubin, total
blood protein and plasma albumin)
Hepatic function tests were conducted on plasma from
participants at the UAB Hospital Laboratory. This
included tests of the liver enzymes aspartate amino-
transferase (AST) and alani ne aminotransferase (ALT),
liver transport (direct bilirubin), and liver synthesis
(albumin and t otal protein). The normal range values
were based on those in the University of Alabama Hos-
pital Laboratories Bulletin of Information (revised Octo-
ber 2002).
Statistical analysis
Categorical variables were compared using chi-square
tests. The World Health Organization’ s generally
accepted cut-off values for micronutrient deficiencies for
retino l (20µg/dL) and tocopherol (0.5 mg/dL) were used
to categorize participants as deficient ( low) or normal
Obuseh et al. Journal of the International AIDS Society 2011, 14:53
/>Page 4 of 10
(high) [31]. These cut-off points were based on tissue
concentrations low enough to ca use adverse health out-
comes. Univariate comparisons among strata for contin-
uous variables such as micronutrients, aflatoxin, total
protein, viral load and CD4 cell count values, were eval-
uated by using the Wilcoxon rank sum test. Associa-
tions between continuous variables were assessed using
the Spearman correlation coefficient.
A subset analysis was restricted to HIV-positive indivi-
duals and stratified based on the viral load and CD4+
cell counts. We quantified the relationship between afla-
toxin and micronutrients by log (natural log) of the HIV
viral load (high and low viral load based on the median
cut-offpointof7.7copies/mL)andCD4counts(<200
cells/mm
3
, 200-499 cells/mm
3
, and >499 cells/mm
3
).
CD4 was categorized based on the 1993 revised classifi-
cation system by the Centers for Disease Control and
Prevention [32].
The viral load categorization was based on published
research that showed that people with viral loads below
10,000 copies/mL of blood did not show disease pro-
gression in greater than a nine-year period compared
with people with higher viral loads [33]. The median
viral load is high. The study was done before the recom-
mendation was made to begin ARV treatment at a CD4
count of 350 cells/mm
3
. Therefore, antiretroviral (ARV)
treatment was started at CD4 levels of 250 cells/mm
3
.
Approximately 30% of study participants were on ARV
treatment.
Multivariate linear regression was used to assess the
relationship between levels of vitamins A and E as out-
comes, and aflatoxin, HIV status and HBV as primary
exposures of int erest. Variables that were significant in
the univariate analysis at p <0.10 or less were considered
for multivariate analysis. To maintain the precision of
our estimates, we normalized our exposure and outcome
variables w here necessary with a transformation to
ensure model fit. Regression diagnostics, such as resi-
dual checking, were used to refine the model. We co n-
trolled for potential confounders, such as age, sex,
occupation and education. All hypothesis tests were two
tailed, with a Type 1 error rate fixed at 5%. All statistical
analyses were performed with Statistical Analyses Sys-
tem version 9.1 SAS Institute Inc., Cary, North Carolina.
Results
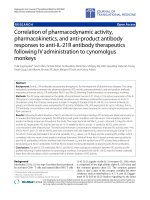
Table 1 presents the descriptive statistics for the 305
study participants by HIV status (147 HIV negative and
158 HIV positive). There was no significant difference in
age between the two gro ups. The mean age ± standard
deviation (SD) for HIV-negative participants was 39.0 ±
16.2 years and for HIV-positive participants was 38.7 ±
9.2 y ears. Sixty-six percent of HIV-positive participants
and 60% of HIV-negative participants were younger
than 40 years. There were significant differences (p
<0.05) between the two groups with regard to sex, edu-
cation and occupation. A higher percentage of HIV-
positive than HIV-negative participants (67% versus
46%, respectively) were women, and HIV-positive parti-
cipants were more likely than HIV-negative parti cipants
to be educated (87% versus 52%, respectively). Half of
HIV-positive participants were traders, whereas half of
HIV-negative participants were farmers.
Table 1 Descriptive statistics of the study population by
HIV status
Characteristics HIV-
[N = 147]
n (%)
HIV+
[N = 158]
n (%)
P value
Age (years) 0.28
19-39 88 (59.9) 104 (65.8)
≥ 40 59 (40.1) 54 (34.2)
Sex 0.0004
Male 79 (53.7) 53 (33.5)
Female 68 (46.3) 105 (66.5)
Formal education <.0001
No 70 (48.3) 21 (13.4)
Yes 75 (51.7) 136 (86.6)
Intake of alcohol 0.03
No 102 (76.1) 129 (86.0)
Yes 32 (23.9) 21 (14.0)
Occupation <0.0001
Farmer 71 (50.3) 2 (1.6)
Trader 25 (17.7) 61 (49.6)
Farmer/trader 14 (10.0) 0 (0.0)
Other 31 (22.0) 60 (48.8)
Knowledge of aflatoxin 0.09
No 107 (83.6) 116 (75.3)
Yes 21 (16.4) 38 (24.7)
Hepatitis B virus infection 0.21
No 123 (84.3) 139 (89.1)
Yes 23 (15.7) 17 (10.9)
Vitamin A ( μg/dL) <.0001
Low (<20 μg/dL) 46 (31.7) 124 (83.2)
High (≥20 μg/dL) 99 (68.3) 25 (16.8)
Vitamin E (mg/dL) 0.001
Low (<0.5 mg/dL) 106 (73.1) 131 (87.9)
High (≥0.5 mg/dL) 39 (26.9) 18 (12.1)
Aflatoxin B1 (pmol/mg albumin) 0.01
Low (<0.8 pmol/mg albumin) 85 (58.2) 68 (43.6)
High (≥0.8 pmol/mg albumin) 61 (41.8) 88 (56.4)
HIV viral load (log copies/mL)
Mean ± standard deviation 8.4 ± 2.7
Median 7.7
CD4 T cell counts (cells/mm
3
)
Mean ± standard deviation 308 ± 253
Median 253
Obuseh et al. Journal of the International AIDS Society 2011, 14:53
/>Page 5 of 10
There was no significant difference in HBV infection
between the groups. Significant differences were noted
in micronutrient status between the groups. Significantly
higher percentages of individuals with low vitamin A
(<20 µg/dL ) and low vitamin E (<0.5 mg/dL) levels were
HIV-positive (83% and 88%, respectively) compared with
HIV-negative participants (32% and 73%, respectively).
There were significant differences in the plasma concen-
trat ion of aflatoxin; 56% of HIV-positive individ uals had
high levels of AF-ALB (≥0.8 pmol/mg albumin) com-
pared with 42% of HIV-negative individua ls. The mean
CD4 count for HIV-positiv e participants was 308 ± 253
cells/mm
3
(median 253 cells/mm
3
), and the mean log
viral load was 8.4 ± 2.7 (median 7.7).
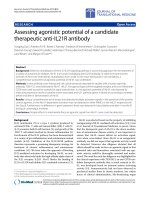
The mean ± the standard deviation (SD) and median
concentrations of micronutrients, AF-ALB and liver
function tests for HIV-negative and HIV-positive partici-
pants are shown in Table 2. Vitamins A and E and AF-
ALB concentrations were all significantly different (p <
0.01) between the two groups. The median level of vita-
min A in HIV-negative participants was significantly
higher than that of HIV-posit ive participants (27.5µg/dL
versus 12.6µg/dL, respectively). Also, the median level of
vitamin E in HIV-negative participants was significantly
higher than that of HIV-positive participants (0.37 ver-
sus 0.24 mg/dL, respectively).The median AF-ALB level
for HIV-positive participants was 0.93 pmol/mg albu-
min, and that for HIV-negative participants was 0.80
pmol/mg albumin (p <0.01). CD4 counts were not
determined for the HIV-negative participants.
Liver function tests (ALT, AST, direct bilirubin, albu-
min and total protein) differed by HIV status. AST and
tot al protein were significantly higher among HIV-posi-
tive participants. Although ALT was significantly higher
and albumin was significantly lower for the HIV-positive
group, these values were within the normal ranges.
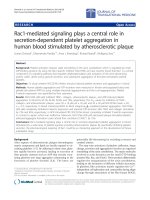
The subset analysis of HIV-positive individuals strati-
fied by viral load and CD4 counts is shown in Table 3.
The median mi cronutrient concentrations of vitamins A
and E dif fered significantly by viral load. HIV-positive
individuals with high viral loads had significantly (p
<0.02) lower vitamin A or E concentrations than those
with low viral loads. Stratification by CD4 counts
showed that lower plasma vitamin A and E levels were
associated with lower CD4 cell counts or more advanced
immunosuppression. However, the difference was signif-
icant only for vitamin E (p = 0.004).
There was no significant difference in AF-ALB con-
centration according to viral load or CD4+ T cell count.
Spearman’s correlation coefficients between variables
showed significant correlations for AF-ALB with vitamin
A (r = -0.20, p = 0.0007). Also, although vitamin E was
not significantly correlated with AF-ALB, vitamins A
and E were strongly correlated (r = 0.50, p <0.0001).
When liver function concentrations within the HIV-
positive group were stratified by viral load and CD4
count, there were no striking differences. Therefore,
liver function data were not included in the multivariate
analysis.
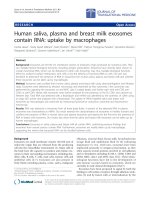
Regression analysis
We found a significant negative relationship between
AF-ALB and vitamin A concentration (p <0.01) (Table
4). Higher aflatoxin exposure was associated with lower
Table 2 Univariate statistics and distributions of vitamins A and E and plasma aflatoxin by HIV status
HIV negative HIV positive
Variables Mean ± SD Median Mean ± SD Median P value
Micronutrients
Vitamin A (µg/dL) 32.4 ± 20.6 27.5 13.7 ± 7.5 12.6 <0.0001
Vitamin E (mg/dL) 0.4 ± 0.3 0.4 0.3 ± 0.2 0.2 <0.0001
Aflatoxin B
1
albumin adducts
(pmol/mg albumin)
0.9 ± 0.5 0.8 1.1 ± 0.6 0.9 0.01
Liver function tests
Alanine aminotransferase 17.9 ± 9.7 15.0 25.9 ± 17.8 21.0 <0.0001
(NR = 6-45U/L)
Aspartate aminotransferase 41.3 ± 26.5 37.0 65.1 ± 66.4 53 <0.0001
(NR = 0-37U/L)
Bilirubin direct 0.14 ± 0.08 0.1 0.15 ± 0.23 0.1 0.03
(NR = 0.1-0.3 mg/dL)
Albumin 3.53 ± 0.44 3.6 3.21 ± 0.79 3.3 <0.0001
(NR = 3.4-5.0 g/dL)
Total protein 7.34 ± 0.86 7.4 8.47 ± 1.63 8.4 <0.0001
(NR = 6.0-7.9 g/dL)
The Wilcoxon rank sum test for equality of medians was conducted
Obuseh et al. Journal of the International AIDS Society 2011, 14:53
/>Page 6 of 10
vitamin A (-4.83 μg/dL per 0.1 pmol/mg increase in AF-
ALB). HIV-infected people had significantly lower levels
of vitamin A (-16.94 μg/dL; p <0.0001). HBV-infected
people also had significantly lower levels of vitamin A
(-5.66 μg/dL; p = 0.01). Multivariate regression analysis
did not show a significant association between vitamin E
and AF-ALB (Table 5). HIV-infe cted people had signifi-
cantly lower vitamin E concentrations (-0.22 mg/dL).
Discussion
Our results and those of previously published studies
show associations between vitamins A and E deficiencies
and HIV infection [3-5]. In this study, HIV-positive indi-
viduals had higher prev alence of vitamins A and E defi-
ciencies than HIV-negative individuals. The prevalence
of vitamin A deficiency exceeded 80% in HIV-positive
individuals compared with 31% among those who were
HIV negative. However, the prevalence of vitamin E
deficiency was generally high in both groups (88% in the
HIV-positive group and 73% in the HIV-negative
group), although higher in the HIV-positive group.
Although some of the foods that are high in vitamin
E, such as green leafy vegetables and peanuts, are pre-
sent in the diet of the study population, it is possible
that there is not adequate intake of these naturally
occurring sources of vitamin E. The high level of vita-
min E deficiency indicates that the study participants
are more likely to suffer from oxidative stress since vita-
min E is an antioxidant that reduces antioxidant stress.
High levels of antioxidant compounds in lymphocytes
could lead to viral activation and increase in HIV viral
load.
We found a significant difference in plasma AF-ALB
levels between H IV-positive and HIV-negative indivi-
duals. Surprisingly, the HIV-positive individuals had
higher plasma levels of AF-ALB than HIV-negative indi-
viduals. We also saw indication of impairment of liver
function (AST and total protein) among HIV-positive
participants. Impaired liver fun ction has been documen-
ted in HIV-positive people [34]. Thus, HIV-positive peo-
ple, probably as a result of impaired liver function, may
have decreased ability to detoxify aflatoxin metabolites
leading to higher concentrations of these metabolites in
the blood. Aflatoxin can also cause liver disease since it
induces injury to both hepatic parenchyma and the bili-
ary tract [35]. Antiretrovirals could also induce liver
toxicity in HIV-positive people on treatment [36-38].
Although we did not collect dietary information, we
do not believe that the differences in AF-ALB levels
between the HIV-positive and HIV-negative groups is
due to whether stored or fresh grains were being eaten
by a particular group. At t he time that the study was
conducted (June to August), both groups were likely to
have been eating food stored at the end of the Septem-
ber to November rainy season of the previous year (har-
vested December to January). Participants may also have
been ea ting some fresh food produced during the April
to late June rainy season of the study year. However,
Table 3 Micronutrient concentrations in relation to HIV viral load and CD4+ T cell counts
Vitamin A concentration (µg/dL) Vitamin E concentration (mg/dL)
Mean ± SD Median P value Mean ± SD Median P value
Low viral load (<7.7 log) 12.36 ± 7.42 13.99 0.02 0.22 ± 0.20 0.29 0.02
High viral load (≥7.7 log) 15.11 ± 7.37 11.58 0.29 ± 0.20 0.18
CD4 <200 cells/mm
3
12.60 ± 8.50 11.60 0.40 0.18 ± 0.16 0.11 0.004
CD4 200-499 cells/mm
3
14.00 ± 6.50 13.30 0.28 ± 0.18 0.27
CD4 >499 cells/mm
3
15.75 ± 8.66 16.37 0.34 ± 0.27 0.31
The Wilcoxon rank sum test for equality of medians was conducted
Table 4 Parameter estimate of predictors associated with
vitamin A
Parameter Estimate (std err) P value
Intercept 37.34 (3.66) <0.0001
Aflatoxin B
1
-4.83 (2.16) <0.01
HIV infection -16.94 (3.29) <0.0001
Hepatitis B virus infection -5.66 (2.46) 0.01
R
2
0.36
F-value 13.80
P-value <0.0001
Model was adjusted for demographic variables listed in Table 1.
Table 5 Parameter estimate of predictors associated with
vitamin E
Parameter Estimate (std err) P value
Intercept 0.33 (0.07) <0.0001
Aflatoxin B
1
-0.02 (0.04) 0.56
HIV infection -0.22 (0.06) <0.001
Hepatitis B virus infection -0.007 (0.05) 0.99
R
2
0.12
F-value 3.20
P-value 0.0007
Model was adjusted for demographic variables listed in Table 1.
Obuseh et al. Journal of the International AIDS Society 2011, 14:53
/>Page 7 of 10
because the aflatoxin albumin adduct is an indicator of
aflatoxin exposure over a two- to three -month period, it
is more likely that stored food is the method of expo-
sure for both HIV-positive and HIV-negative individuals.
To the best of our knowledge, this study is the first to
examine the relationship between micronutrients and
aflatoxin in HIV-positive people. Almost all (99.7%) of
HIV-positive study participants and all HIV-negative
participants had AF-ALB in their blood. Jolly et al [39]
have previously shown high levels of AF-ALB in a group
of HIV-negative Ghanaians. We found significantly
lower vitamin A concentration in study participants
with high AF-ALB. Saron et al [40] have reported lower
serum levels of retinol in individuals with chronic liver
diseases, related to the severity of the condition.
Hepatic stellate cells within liver lobules store about
80% of the total body vitamin A in lipid droplets in
their cytoplasm [41]. These cells also play a pivotal role
in the regulation of vitamin A homeostasis [42-44]. Afla-
toxin has been shown to injure both hepatic parench-
yma and the biliary tract [45]. Thus, aflatoxin likely
damages the liver’s vitamin A functioning, and the com-
bination of HIV and aflatoxin exacerbates the vitamin A
problems faced by HIV-positive people because they
have higher biological exposure.
In our study participants, HBV infection was also a
strong predictor of vitamin A deficiency. Aflatoxi n and
HBV infection could have impacted the hepatic cells,
thereby affecting vitamin A metabolism and storage.
The association of vitamin A deficiency and high AF-
ALB levels may result in impairment of the host
immune response, which would increase susceptibility
to infectious diseases and faster rate of HIV disease
progression.
Vitamin E (a-tocopherol) was previously found to be
positively associated with the detection rate of AFB
1
-
DNA adducts in a dose-dependent manner in HBVsAg-
positive and HBVsAg-negative males from Taiwan [46].
However, no association with AFB
1
-DNA adducts was
found for plasma retinol . Our results revealed that afla-
toxin exposure (AF-ALB) is a predictor of plasma vita-
min A (retinol) status, but we did not find a significant
relationship between AF-ALB and vitamin E.
The time of HIV infection was not known for our par-
ticipants, and the assessment of disease progression was
based on the clinical stages of the disease as determined
by CD4+T cell counts and HIV viral load measure-
ments. Changes in vitamin A status have been shown to
significantly affect T cell functions in human and animal
experiments [47,48]. In our study, there was no associa-
tion between plasma vitamin A concentration and CD4
counts. This finding is consistent with the previous
results of Jones et al [7], but contrary to findings by
Semba et al [6] and Baum et al [49]. Although our
results were not significant, we found a dose response
relationship between CD4 coun t and vitamin A concen-
tration. Individuals with CD4 counts <200 cells/mm
3
had lower vitamin A levels compared with those indivi-
dua ls with 200-499 cells/mm
3
and >499 cells/mm
3
.The
lack of association between vitamin A and CD4 counts
could have been confounded by the cross-sectional for-
mat of the study design. Differences in study design may
explain inconsistent findings on vitamin A supplementa-
tion and HIV progression [49-51].
Vitamin E has been shown to be important in immune
function [52]. Further, low serum vitamin E was found
to be assoc iated with HIV disease progression in pro-
spective studies [49,53]. Consistent with these studies,
we found a highly significant association between vita-
min E and CD4 counts. Recent studies in HIV-positive
people have associated vitamin E deficiency with
decreased immune response, increased viral mutation
and, overall, increased viral pathogenicity [11]. Beck [11]
proposed that the mechanism for increased viral patho-
genicity is based on the interplay between malnutrition
leading to immune dysfunction, and direct oxidative
damage of viral genes resulting in increased mutation
rate.
Previous research has shown relationships between
micronutrients and HIV viral load and between micro-
nutrients and HIV progression [54]. We found both
vitamins A and E to be significantly associated with HIV
viral load; low plasma vitamin A and E levels w ere
found in individuals with high viral load. Thus, vitamins
A and E levels may be associated with HIV progression.
However, the results should be interpreted with caution
because our study design preclude s any causal infer-
ences about the associations. Further, the results of the
study can be generalized only to people in Kumasi and
its surroundings in the Ashanti Region of Ghana.
Our study permitted sim ultaneous assessment of sev-
eral predictors of vitamins A and E, and assessment of
the interaction among these predictors. In addition, we
adjusted for possible confounders, such as sex and age;
however, residual confounders may still have affected
the study findings. There was no dietary information on
the exposure to aflatoxin, but serum AF-ALB level has
been shown to be a reliable biological marker of afla-
toxin exposure [55]. Likewise, the study did not account
for the dietary intake of vitamins A and E; therefore, it
is difficult to establish that the deficiencies were caused
entirely by our predictors.
Sampling all HIV-positive participants from a hospital
setting and some HIV-negative particip ants from the
community has likely introduced bias into the study.
Also, we acknowledge that the p24 assay is sub-optimal
for determining prevalent HIV infection. However, the
HIV prevalence rate in Ghana has always been low
Obuseh et al. Journal of the International AIDS Society 2011, 14:53
/>Page 8 of 10
(1.9% in 2007 and 2.2% in earlier years). Therefore, no
more than about three of our potentially HIV-negative
participants would have been HIV posit ive. Using the
p24 test, we were able to rule out two potentially HIV-
negative participants as HIV positive. Based on this, on
participants’ responses to questions regarding their
health and HIV testing, and on available clinic records
for HIV-negative participants who attended the clinic,
we feel that it is highl y likely that partici pants classified
as HIV negative in the study were truly HIV negative.
Studies have shown relationships between aflatoxin
and vitamin E; our finding of a lack of association
between aflatoxin and vitamin E in the HIV-positive
population might be confounded by high prevalence of
vitamin E deficiency in the study group, the small sam-
plesizeandthestageofHIVinfection.Weassumed
that the variation in the time of HIV infection before
enrolment is most likely random.
Conclusions
Micronutrient deficiency and HIV infection are both
major and increasingly important prob lems in sub-
Saharan Africa. Our multivariate analysis confirms that
HIV status, aflatoxin exposure and HBV infection are
independent predictor s of vitamin A concentration, and
that HIV infection is an independent predictor of vita-
min E concentration. Although we could not ascertain
the effect of low vitamin A status and CD4 counts, our
viral load results clearly indicate an association between
vitamins A and E and HIV disease progression.
It has been found that multiple, rather than single,
vitamin supplementation slows HIV progression [15].
Therefore, further studies on the associati on or effect of
exposure to aflatoxin (and other mycotoxins) on other
micronutrients in HIV-positive people are warranted so
that the role of these toxins ca n be del ineated and the
appropriate steps taken to decrease exposure.
Acknowledgements
The authors express their appreciation to staff at the Nutritional Sciences
Laboratory, University of Alabama at Birmingham (UAB), for their technical
assistance and Dr Jia-Sheng Wang for conducting the AFB
1
albumin adduct
analysis. This research was supported by USAID grant LAG-G-00-96-90013-00
for the Peanut Collaborative Support Research Program, UAB Cancer
Prevention and Control Training Program grant (NIH 5 R25 CA 047888), and
Minority Health International Research Training Grant T37 MD001448 from
the National Center on Minority Health and Health Disparities, National
Institutes of Health, Bethesda, MD, USA. We thank Dr Thomas Kruppa, and
Mr Lincoln Gankpala at the Kumasi Center for Collaborative Research (KCCR)
in Tropical Medicine, KNUST, for assistance with cell separation, storage and
shipping.
Author details
1
Department of Health Care Organization and Policy, School of Public
Health, University of Alabama at Birmingham, Birmingham, Alaba ma, USA.
2
Department of Epidemiology, School of Public Health, University of
Alabama at Birmingham, Birmingham, Alabama, USA.
3
Division of Health
Promotion Sciences, Mel and Enid Zuckerman College of Public Health,
University of Arizona, Tucson, Arizona, USA.
4
Division of Preventive Medicine,
School of Medicine, University of Alabama at Birmingham, Birmingham,
Alabama, USA.
5
St. Markus Hospital, AIDS ALLY, Kumasi, Ghana.
6
Department
of Nutrition Sciences - Nutritional Biochemistry and Genomics, University of
Alabama at Birmingham, Birmingham, Alabama, USA.
Authors’ contributions
FO developed the protocol, conducted vitamins A and E assays and
statistical analysis, and wrote the first draft of the manuscript. PJ developed
the protocol, conducted the field study, interpreted data, and revised the
paper. PP assisted with protocol development and approval, participant
recruitment and paper revision. AK, JE and JW reviewed the protocol,
interpreted data, and participated in the revisions of the paper. YJ
conducted lab analyses, interpreted lab data, and revised the paper. CP
supervised vitamins A and E analysis and interpreted the data, and revised
the paper. RD supervised statistical analysis, interpretation of data and
revisions of the paper. All authors have read and approved the final
manuscript.
Competing interests
The authors declare that they have no competing interests.
Received: 30 November 2010 Accepted: 11 November 2011
Published: 11 November 2011
References
1. UNAIDS: Global Facts and Figures 2009. The Global AIDS Epidemic UNAIDS
Press Office.
2. Epidemiological Fact Sheet on HIV and AIDS, Ghana 2008 Update UNAIDS/
WHO Working Group on Global HIV/AIDS and STI Surveillance, Geneva,
Switzerland; 2008.
3. Fawzi W: Micronutrients and human immunodeficiency virus type 1
disease progression among adults and children. Clin Infect Dis 2003,
37(Suppl 2):S112-116.
4. Fawzi WW, Hunter DJ: Vitamins in HIV disease progression and vertical
transmission. Epidemiology 1998, 9:457-466.
5. Kennedy CM, Kuhn L, Stein Z: Vitamin A and HIV infection: disease
progression, mortality, and transmission. Nutr Rev 2000, 58:291-303.
6. Semba RD, Graham NM, Caiaffa WT, Margolick JB, Clement L, Vlahov D:
Increased mortality associated with vitamin A deficiency during human
immunodeficiency virus type 1 infection. Arch Intern Med 1993,
153:2149-2154.
7. Jones CY, Tang AM, Forrester JE, Huang J, Hendricks KM, Knox TA,
Spiegelman D, Semba RD, Woods MN: Micronutrient levels and HIV
disease status in HIV-infected patients on highly active antiretroviral
therapy in the Nutrition for Healthy Living cohort. J Acquir Immune Defic
Syndr 2006, 43:475-482.
8. Semba RD: Vitamin A, immunity, and infection. Clin Infect Dis 1994,
19:489-499.
9. Jiang Y, Obuseh F, Ellis WO, Piyathilake C, Jolly PE: Association of vitamin A
deficiency with decrease in TNF-α expressing CD3-CD56+ NK cells in
Ghanaians. Nutr Res 2007, 27:400-407.
10. Suzuki YJ, Packer L: Inactivation of NF-kappa B activation by vitamin E
derivatives. Biochem Biophys Res Commun 1993, 193:277-283.
11. Beck MA, Selenium and vitamin E status: Impact on viral pathogenicity. J
Nutr 2007, 137:1338-1340.
12. McClelland RS, Baeten JM, Overbaugh J, Richardson BA, Mandaliya K,
Emery S, Lavreys L, Ndinya-Achola JO, Bankson DD, Bwayo JJ, Kreiss JK:
Micronutrient Supplementation Increases Genital Tract Shedding of HIV-
1 in Women: Results of a Randomized Trial. J Acquir Immune Defic Syndr
2004, 37:1657-1663.
13. Fawzi WW, Msamanga GI, Hunter D, Renjifo B, Antelman G, Bang H, Manji K,
Kapiga S, Mwakagile D, Essex M, Spiegelman D: Randomized trial of
vitamin supplements in relation to transmission of HIV-1 through
breastfeeding and early child mortality. AIDS 2002, 16:1935-1944.
14. Fawzi WW, Msamanga GI, Wei R, Spiegelman D, Antelman G, Villamor E,
Manji K, Hunter D: Effect of providing vitamin supplements to human
immunodeficiency virus-infected, lactating mothers on the child’s
morbidity and CD4+ cell counts. Clin Infect Dis 2003, 36:1053-1062.
15. Fawzi WW, Msamanga GI, Spiegelman D, Wei R, Kapiga S, Villamor E,
Mwakagile D, Mugusi F, Hertzmark E, Essex M, Hunter DJ:
A randomized
Obuseh et al. Journal of the International AIDS Society 2011, 14:53
/>Page 9 of 10
trial of multivitamin supplements and HIV disease progression and
mortality. N Engl J Med 2004, 351:23-32.
16. Graham SM, Baeten JM, Richardson BA, Bankson DD, Lavreys L, Ndinya-
Achola JO, Mandaliya K, Overbaugh J, McClelland RS: Higher pre-
infection vitamin E levels are associated with higher mortality in HIV-
1-infected Kenyan women: a prospecti ve stud y. BMC I nfect Dis 2007,
7:63.
17. Gourama H, Bullerman LB: Aspergillus flavus and Aspergillus parasiticus,
aflatoxigenic fungi of concern in foods and feed - a review. J Food
Protect 1995, 58:1395-1404.
18. Oyelami OA, Maxwell SM, Adeoba E: Aflatoxins and ochratoxin A in the
weaning food of Nigerian children. Ann Trop Paediatr 1996, 16:137-140.
19. Egal S, Hounsa A, Gong YY, Turner PC, Wild CP, Hall AJ, Hell K, Cardwell KF:
Dietary exposure to aflatoxin from maize and groundnut in young
children from Benin and Togo, West Africa. Int J Food Microbiol 2005,
104:215-224.
20. Kpodo K, Thrane U, Hald B: Fusaria and fumonisins in maize from Ghana
and their co-occurrence with aflatoxins. Int J Food Microbiol 2000,
61:147-157.
21. Awuah RT, Kpodo KA: High incidence of Aspergillus flavus and aflatoxins
in stored groundnut in Ghana and the use of a microbial assay to assess
the inhibitory effects of plant extracts on aflatoxin synthesis.
Mycopathologia 1996, 134:109-114.
22. de Vries HR, Lamplugh SM, Hendrickse RG: Aflatoxins and kwashiorkor in
Kenya: a hospital based study in a rural area of Kenya. Ann Trop Paediatr
1987, 7:249-251.
23. Gong YY, Cardwell K, Hounsa A, Egal S, Turner PC, Hall AJ, Wild CP: Dietary
aflatoxin exposure and impaired growth in young children from Benin
and Togo: cross sectional study. Brit Med J 2002, 325:20-21.
24. Abdelhamid AM, el-Shawaf I, el-Ayoty SA, Ali MM, Gamil T: Effect of low
level of dietary aflatoxins on baladi rabbits. Arch Tierernahr 1990,
40:517-537.
25. Harvey RB, Kubena LF, Elissalde MH: Influence of vitamin E on aflatoxicosis
in growing swine. Am J Vet Res 1994, 55:572-577.
26. Obuseh FA, Jolly PE, Jiang Y, Shuaib FM, Waterbor J, Ellis WO, Piyathilake CJ,
Desmond RA, Afriyie-Gyawu E, Phillips TD: Aflatoxin B1 albumin adducts in
plasma and aflatoxin M1 in urine are associated with plasma
concentrations of vitamins A and E. Int J Vitam Nutr Res 2010, 80:355-368.
27. Tang L, Xu L, Afriyie-Gyawu E, Liu W, Wang P, Tang Y, Wang Z, Huebner HJ,
Ankrah NA, Ofori-Adjei D, Williams JH, Wang JS, Phillips TD: Aflatoxin-
albumin adducts and correlation with decreased serum levels of
vitamins A and E in an adult Ghanaian population. Food Additives and
Contaminants Part A 2009, 1:108-118.
28. Jiang Y, Jolly PE, Ellis WO, Wang JS, Phillips TD, Williams JH: Aflatoxin B1
albumin adduct levels and cellular immune status in Ghanaians.
Int
Immunol 2005, 17:807-814.
29. Stacewicz-Sapuntzakis M, Bowen PE, Kikendall JW, Burgess M: Simultaneous
determination of serum retinol and various carotinoids: their distribution
in middle-age men and women. J Micronutr Anal 1987, 3:27-45.
30. Wang JS, Qian GS, Zarba A, He X, Zhu YR, Zhang BC, Jacobson L, Gange SJ,
Munoz A, Kensler TW, Groopman JD: Temporal patterns of aflatoxin-
albumin adducts in hepatitis B surface antigen-positive and antigen-
negative residents of Daxin, Qidong County, People’s Republic of China.
Cancer Epidemiol Biomarkers Prev 1996, 5:253-61.
31. WHO: Global prevalence of vitamin A deficiency. Micronutrient Deficiency
Information System, MDIS Working paper #2, WHO/NUT/95.3 Geneva,
Switzerland: World Health Organization; 1995.
32. CDC: 1993 Revised classification system for HIV infection and expanded
surveillance case definition for AIDS among adolescents and adults.
MMWR , December 18, 1992/41(RR-17).
33. Rinaldo C, Huang X, Fan Z, Ding M, Beltz L, Logar A, Panicali D, Mazzara G,
Liebmann J, Cottrill M, Gupta P: High levels of anti-human
immunodeficiency virus type 1 (HIV-1) memory cytotoxic T-lymphocyte
activity and low viral load are associated with lack of disease in HIV-1-
infected long-term nonprogressors. J of Virol 1995, 69:5838-5842.
34. Feczko PJ: Gastrointestinal complications of human immunodeficiency
virus (HIV) infection. Sem in Roentgenology 1994, XXIX(3):275-287.
35. Becker S: Liver Toxicity in Epidemiological Cohorts. Clinical Infectious
Diseases 2004, 38(Suppl 2):S49-55.
36. Sulkowski MD, Thomas DL, Chaisson RE, Moore RD: Hepatotoxicity
associated with antiretroviral therapy in adults infected with human
immunodeficiency virus and the role of Hepatitis C or B virus infection.
JAMA 2000, 283:74-80.
37. Bonacini M, Louis S, Weisman K: Hepatotoxicity of antiviral medications. In
Drug-induced Liver Disease. Edited by: Kaplowitz N, DeLeve L. New York;
2002:519-548.
38. Aceti A, Pasquazzi C, Zechini B, De Bac C, LIVERHAART Group:
Hepatotoxicity development during antiretroviral therapy containing
protease inhibitors in patients with HIV: the role of hepatitis B and C
virus infection. Acquired Immune Deficiency Syndrome 2002, 29:41-48.
39. Jolly P, Jiang Y, Ellis W, Awuah R, Nnedu O, Phillips T, Wang JS, Afriyie-
Gyawu E, Tang L, Person S, Williams J, Jolly C: Determinants of aflatoxin
levels in Ghanaians: sociodemographic factors, knowledge of aflatoxin
and food handling and consumption practices. Int J Hyg Environ Health
2006, 209:345-358.
40. Saron ML, Godoy HT, Hessel G: Nutritional status of patients with biliary
atresia and autoimmune hepatitis related to serum levels of vitamins A,
D and E. Arq Gastroenterol 2009, 46:62-68.
41. Higashi N, Sato M, Kojima N, Irie T, Kawamura K, Mabuchi A, Senoo H:
Vitamin A storage in hepatic stellate cells in the regenerating rat liver:
with special reference to zonal heterogeneity. Anat Rec A Discov Mol Cell
Evol Biol 2005, 286:899-907.
42. Senoo H, Wake K: Suppression of experimental hepatic fibrosis by
administration of vitamin A.
Lab Invest 1985, 52:182-194.
43. Blomhoff R, Green MH, Berg T, Norum KR: Transport and storage of
vitamin A. Science 1990, 250:399-404.
44. Imai K, Sato M, Kojima N, Miura M, Sato T, Sugiyama T, Enomoto K,
Senoo H: Storage of lipid droplets in and production of extracellular
matrix by hepatic stellate cells (vitamin A-storing cells) in Long-Evans
Cinnamon-like colored (LEC) rates. Anat Rec 2000, 258:338-48.
45. Tao P, Zhi-Ming L, Tang-Wei L, Le-Qun L, Min-Hao P, Xue Q, Lu-Nam Y,
Ren-Xiang L, Qiao W, Santella RM: Associated factors in modulating
aflatoxin B1-albumin adduct level in three Chinese populations. Digestive
Dis Sci 2005, 50:525-532.
46. Yu MW, Chiang YC, Lien JP, Chen CJ: Plasma antioxidant vitamins, chronic
hepatitis B virus infection and urinary aflatoxin B
1
-DNA adducts.
Carcinogenesis 1997, 18:1189-1194.
47. Ross AC, Hammerling UG: Retinoid and the immune system. In The
Retiniods: Biology, Chemistry and Medicine. Edited by: Sporn MB, Roberts AB,
Goodman DS. New York: Raven Press; 1994:521-543.
48. Visser ME, Maartens G, Kossew G, Hussey GD: Plasma vitamin A and zinc
levels in HIV-infected adults in Cape Town, South Africa. Br J Nutr 2003,
89:475-482.
49. Baum MK, Shor-Posner G, Lu Y, Rosner B, Sauberlich HE, Fletcher MA,
Szapocznik J, Eisdorfer C, Buring JE, Hennekens CH: Micronutrients and
HIV-1 disease progression. AIDS 1995, 9:1051-1056.
50. Tang AM, Graham NM, Kirby AJ, McCall LD, Willett WC, Saah AJ: Dietary
micronutrient intake and risk of progression to acquired
immunodeficiency syndrome (AIDS) in human immunodeficiency virus
type 1 (HIV-1)-infected homosexual men. Am J Epidemiol 1993,
138:937-951.
51. Semba RD, Caiaffa WT, Graham NM, Cohn S, Vlahov D: Vitamin A
deficiency and wasting as predictors of mortality in human
immunodeficiency virus-infected injection drug users. J Infect Dis 1995,
171:1196-1202.
52. Han SN, Meydani S: Impact of vitamin E on immune function and its
clinical implications. Expert Rev Clin Immunol 2006, 2:561-567.
53. Tang AM, Graham NM, Semba RD, Saah AJ: Association between serum
vitamin A and E levels and HIV-1 disease progression. AIDS 1997,
11:613-620.
54. Ferre F, Moss RB, Daigle A, Richieri SP, Jensen F, Carlo DJ: Viral load in
peripheral blood mononuclear cells as surrogate for clinical progression.
J Acq Imm Def Synd Hum Retrovirol 1995, 10(Suppl 2):51-56.
55. Strickland PT, Groopman JD: Biomarkers for assessing environmental
exposure to carcinogens in the diet. Am J Clin Nutr 1995, 61(Suppl
3):710-70.
doi:10.1186/1758-2652-14-53
Cite this article as: Obuseh et al.: Aflatoxin levels, plasma vitamins A
and E concentrations, and their association with HIV and hepatitis B
virus infections in Ghanaians: a cross-sectional study. Journal of the
International AIDS Society 2011 14:53.
Obuseh et al. Journal of the International AIDS Society 2011, 14:53
/>Page 10 of 10