Communications and Networking Part 15 pot
Bạn đang xem bản rút gọn của tài liệu. Xem và tải ngay bản đầy đủ của tài liệu tại đây (1.83 MB, 26 trang )
Data-Processing and Optimization Methods for Localization-Tracking Systems
409
22
22
()()
,
()()
, a nd
j
lili
il
eE
il il
xy
jl
ljlj
il
jl
il jl
xxyy
K
jl
d
xxyy
K
jl e E
d
σ
σ
∈
−−
⎧
=
⎪
⎪
⎡⎤
=
⎨
⎣⎦
−−
⎪
−
≠∈
⎪
⎩
∑
F (66)
where e
j
indicates the set of links connected to the j-th node.
The first case-of-study is a network with N
A
= 4 anchors and one target deployed in a square
area of size [–10,10] × [–10,10]. The target location is generated as a random variable with
uniform distribution within the size of the square while anchors, are located at the locations
x
1
= [–10,–10], x
2
= [10,–10], x
3
= [10,10] and x
4
= [–10,10]. We assume that all nodes are connected
and the distance of each link is measured K
ij
times, with K
ij
∈ [2,7]. We use the ranging model
given in equation 2 to generate distance measurements, and we consider
σ
ij
∈ (1e-4,
σ
max
).
In figure 9, we show the RMSE obtained with different localization algorithms and unitary
weight (unweighted strategy). In this particular study, all algorithms have very similar
performance, and the reason is due to the convexity property of the WLS-ML objective
function. Indeed, if the target is inside the convex-hull formed by the anchors and the noise
is not sufficiently large, then the objective function in typically convex. However, all
algorithms do not attain the CRLB because, under the assumption that σ
ij
’s are all different,
the unitary weight is not optimal.
In figure 10 we show the RMSE obtained with the L-GDC algorithm using different
weighing strategy, namely, the optimal, the unweighted, the exponential and the dispersion
weighing strategy given in equations12, 14, 17, and20, respectively. The results show that
the L-GDC algorithm using
i
j
w
∗
is able to achieve the CRLB, whereas the others stay above.
0 0.2 0.4 0.6 0.8 1 1.2 1.4 1.6 1.8 2
0
0.1
0.2
0.3
0.4
0.5
0.6
Performance of the WLS-ML Algorithms
(Comparison of di erent optimization techniques)
σ: noise standard deviation
RMSE
MDS
Nystr
¨
om
SMACOF
L-GDC
CRLB
ff
Fig. 9. Comparison of different optimization techniques and using binary weight
(unweighted strategy) for a localization problem with N
A
= 4, N
T
= 1, K
min
= 2, K
max
= 7,
σ
max
= 1 and
σ
min
= 1e-4.
Communications and Networking
410
0 0.2 0.4 0.6 0.8 1 1.2 1.4 1.6 1.8 2
0
0.1
0.2
0.3
0.4
0.5
0.6
0.7
Performance of the WLS-ML Algorithms
(Comparison of di erent weighing strategies)
σ: noise standard deviation
RMSE
Exponential weight
Unweighted
Dispersion weight
Optimal weight
CRLB
ff
Fig. 10. Comparison of different weighing strategies and using L-GDC optimization method
for a localization problem with N
A
= 4, N
T
= 1, K
min
= 2, K
max
= 7,
σ
max
= 1 and
σ
min
= 1e-4.
However, to use the optimal weighing strategy we assumed that
σ
ij
’s are known a priori.
Therefore, if we reconsider the LT problem under the assumption that the noise statistics are
unknown, then the proposed dispersion weight provides the best performance. Indeed,
using
L
i
j
w
we are able to rip ≈ 50% of gain from the unweighted and exponential strategies
towards the CRLB.
In the second case-of-study, we consider instead a network with N
A
= 4 anchors and N
T
= 10
targets. As before, anchors are located at the corners of a square area while targets are
randomly distributed. For this type of simulations, we evaluate the performance of the
WLSML algorithms as functions of the meshness ratio defined as
(| | 1)
,
(| | 1)
F
EN
m
EN
−+
−+
(67)
where E
F
indicates the set of links of the fully connected network and |·| indicates the
cardinal number of a set Adams & Franzosa (2008)Destino & De Abreu (2009).
This metric is commonly used in algebraic topology and Graph theory to capture, in one
number, information on the planarity of a Graph. For example, under the constraint of a
connected network, m = 0 results from |E| = N −1, which implies that the network is
reduced to a tree. In contrast, m = 1 results from |E| = |E
F
|, which implies that the network
is not planar, except for the trivial cases of N ≤ 4. More importantly, the mesheness ratio is
an indicator of the connectivity of the network, in a way that is more relevant to its
localizability than the simpler connectivity ratio |E|/|E
F
|.
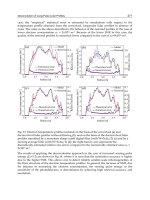
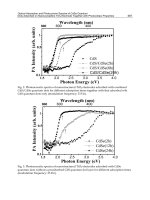
In figures 11 and 12, the results confirm that the L-GDC is the best optimization technique
and, the dispersion weight is the best performing weighing strategy. Similarly to the first
case-of-study, also in this case the WLS-ML method based on L-GDC and using the
dispersion weights rips about 50% of the error from the alternatives towards the CRLB.
Furthermore, from the results shown in figure 11, the L-GDC algorithm is the only one to
Data-Processing and Optimization Methods for Localization-Tracking Systems
411
maintain an almost constant gap from the CRLB within the entire range of meshness ratio.
This let us infer that the L-GDC algorithm finds the global optimum of the WLS-ML function
with high probability, while SMACOF of the algebraic methods find sub-optimal solutions.
0.4 0.5 0.6 0.7 0.8 0.9 1
0.5
1
1.5
2
2.5
3
3.5
4
4.5
5
5.5
6
Performance of the WLS-ML Algorithms
(Comparison of di erent optimization techniques)
m: meshness
RMSE
Nystr
¨
om
SMACOF
L-GDC
CRLB
ff
Fig. 11. Comparison of different optimization techniques and using binary weight
(unweighted strategy) for a localization problem with N
A
= 4, N
T
= 10, K
min
= 2, K
max
= 7,
σ
max
= 1 and
σ
min
= 1e-4.
0.4 0.5 0.6 0.7 0.8 0.9 1
0.05
0.1
0.15
0.2
0.25
0.3
0.35
0.4
0.45
0.5
0.55
0.6
Performance of the WLS-ML Algorithms
(Comparison of different weighing strategies)
m: meshness
RMSE
Exponential weight
Unweighted
Dispersion weight
CRLB
Fig. 12. Comparison of different weighing strategies and using L-GDC optimization method
for a localization problem with N
A
=4, N
T
=10, K
min
=2, K
max
=7,
σ
max
=1 and
σ
min
=1e-4.
Communications and Networking
412
The third and final case-of-study, is the tracking scenario. The network consists of 4 anchor
nodes placed at the corner of a square in a η = 2 dimensional space with 1 targets that moves
following an autoregressive model of order 1 within space defined by the anchors. It is
assumed full anchor-to-anchor and anchor-to-target connectivity and measurements are
perturbed by zero-mean Gaussian noise.
We use the L-GDC optimization method to perform successive re-localization of the target
and we employ different weighing strategies. The result shown in figure 14 illustrates the
performance of the WLS-ML algorithm as a function of σ considering a velocity ν = 1.
Since the tracking is treated as a mere re-localization, the dynamics only affect the output of
the filter block and it is seen from the localization algorithm as an additive noise.
For this reason, the trend of the RMSE is similar to that one obtained in a static scenario.
From figure 14 the impact of the velocity on the performance of the WLS-ML algorithm with
wavelet-based filter is revealed more clearly. The effect of velocity, indeed, is yet similar to a
gaussian noise.
Finally, from both results we observe that the dispersion weight is the best weighing strategy.
7. Conclusions and future work
In this chapter we considered the LT problem in mesh network topologies under LOS
conditions. After a general description of the system we focused on a wavelet based filter to
smooth the observations and a centralized optimization technique to solve the WLS-ML
localization problem. The proposed algorithm was compared with state-of-the-art solutions
and it was shown that by combining the wavelet-based filter together with the dispersion
weighing strategy and the L-GDC algorithm it is possible to get close to the CRLB.
The work described in this chapter did not address the problem of NLOS channel conditions
which needs to be taken into consideration in most of the real life applications. To cope with
the biases introduced by NLOS condition two main strategies can be distinguished. In the
0 0.5 1 1.5 2 2.5 3 3.5 4
0
0.2
0.4
0.6
0.8
1
1.2
1.4
1.6
1.8
Performance of the L-GDC Algorithm
(Weighing Strategies as a function of σ )
σ
RMSE
Unweighted
Wavelet-based
Dispersion Weight
Optimal
Fig. 13. Performance for the L-GDC algorithm for the different weighing strategies.
Scenario measurements at the 4 anchor nodes subject to normal noise process with standard
deviation between 0 and
σ
.
Data-Processing and Optimization Methods for Localization-Tracking Systems
413
0 0.5 1 1.5 2 2.5 3 3.5 4
0.3
0.35
0.4
0.45
0.5
0.55
0.6
0.65
Performance of the L-GDC Algorithm
(Weighing Strategies for different velocities ν)
ν
RMSE
Unweighted
Wavelet-based
Dispersion Weight
Optimal
Fig. 14. Performance for the L-GDC algorithm for the different weighing strategies. Scenario
measurements at the 4 anchor nodes subject to normal noise process with
σ
= 2 and variable
target dynamic ν.
first one the biases are treated as additional variables and are directly estimated by the LT
algorithm while the second approach aims at discarding the bias introduced by the NLOS
condition by applying channel identification and bias compensation algorithms before the
LT engine. Concluding, a new method recently proposed by the authors to overcome the
NLOS effects is based on an accurate contraction of all the measured distances which has
been shown to positively affect the convexity of the objective function and consequently the
final location estimates.
8. References
Abramowitz, M. & Stegun, I. A. (1965). Handbook of Mathematical Functions with Formulas,
Graphs, and Mathematical Tables, 10 edn, Dover Publications.
Adams, C. & Franzosa, R. (2008). Introduction to Topology Pure and Applied, Pearson Prentice Hall.
Alfakih, A. Y., Wolkowicz, H. & Khandani, A. (1999). Solving euclidean distance matrix
completion problems via semidefinite programming, Journ. on Comp. Opt. and App.
12(1): 13 – 30.
Beck, A., Stoica, P. & Li, J. (2008). Exact and approximate solutions for source localization
problems, IEEE Trans. Signal Processing 56(5): 1770–1778.
Biswas, P., Liang, T C., Toh, K C. & Wang, T C. (2006). Semidefinite programming based
algorithms for sensor network localization with noisy distance measurements,
ACM Trans. on Sensor Netw. (TOSN) 2(2): 188–220.
Biswas, P., Liang, T C., Toh, K C., Wang, T C. & Ye, Y. (2006). Semidefinite programming
approaches for sensor network localization with noisy distance measurements,
IEEE Trans. Autom. Sci. Eng. 3: 360–371.
Boyd, S. & Vandenberghe, L. (2004). Convex Optimization, Cambridge University Press. C.
Fowlkes, S. Belongie, F. C. & Malik, J. (2004). Spectral grouping using the Nystr¨om
method, IEEE Trans. Pattern Anal. Machine Intell. 26(2).
Communications and Networking
414
Cheung, K., So, H., Ma,W K. & Chan, Y. (2004). Least squares algorithms for time-of-
arrival-based mobile location, IEEE Trans. on Signal Processing 52(4): 1121–1130.
Costa, J. A., Patwari, N. & III, A. O. H. (2006). Distributed multidimensional scaling with
adaptive weighting for node localization in sensor networks, ACM J. on Sensor
Netw. 2(1): 39–64.
Cox, T. F. & Cox, M. A. A. (2000). Multidimensional Scaling, 2 edn, Chapman & Hall/CRC.
Dattorro, J. (2005). Convex Optimization and Euclidean Distance Geometry, Meboo Publishing.
Destino, G. & Abreu, G. (2009). Solving the source localization prolem via global distance
continuation, Proc. IEEE International Conference on Communcations. IEEE Asilomar
Conference on Signals, Systems, and Computers.
Destino, G. & Abreu, G. (2010). On the maximum likelihood formulation of the network
localization problem, (to submit).
Destino, G. & De Abreu, G. T. F. (2009). Weighing strategy for network localization under
scarce ranging information, Trans. Wireless. Comm. 8(7): 3668–3678.
Gibbons, J. (1992). Nonparametric Statistical Inference, Marcel Dekker.
Guvenc, I., Gezici, S., Watanabe, F. & Inamura, H. (2008). Enhancements to linear least
squares localization through reference selection and ML estimation, Proc. IEEE
Wireless Comm. and Netw. Conf. (WCNC), pp. 284–289.
Joon-Yong, L. & Scholtz, R. (2002). Ranging in a dense multipath environment using an
UWB radio link., IEEE J. Sel. Areas Commun. 20: 1667–1683.
Jourdan, D., Dardari, D. &Win, M. (2006). Position error bound for UWB localization in
dense cluttered environments, Proc. IEEE International Conference on Communcations,
Vol. 8, pp. 3705–3710.
Li, X. & Pahlavan, K. (2004). Super-resolution toa estimation with diversity for indoor
geolocation, IEEE Trans. Wireless Commun. 3(1): 224–234.
Macagnano, D. & de Abreu, G. T. F. (2008). Tracking multiple dynamic targets in LOS-NLOS
condition with multidimensional scaling, IEEE 5th Workshop on Positioning,
Navigation and Communication.
Mao, G., Fidan, B. & Anderson, B. D. O. (2007). Wireless sensor network localization
techniques, Computer Networks: The Intern. J. of Comp. and Telecomm. Networking
51(10): 2529–2553.
More, J. &Wu, Z. (1997). Global continuation for distance geometry problems, SIAM J.
Optim. 7: 814–836.
Nocedal, J. &Wright, S. (2006). Numerical Optimization, Springer.
Ouyang, R., Wong, A S. & Chin-Tau, L. (2010). Received signal strength-based wireless
localization via semidefinite programming: Noncooperative and cooperative
schemes, IEEE Transactions on Vehicular Technology 59(3): 1307 –1318.
Patwari, N., Dea, R. J. O. & Wang, Y. (2003). Relative location estimation in wireless sensor
networks, IEEE Trans. Signal Processing 51(8): 2137–2148.
Shang, Y. & Ruml, W. (2004). Improved MDS-based localization,
Proc. 23-rd Ann. Joint Conf.
of the IEEE Comp. and Comm. Societies (INFOCOM’04), Vol. 4, Hong-Kong, China,
pp. 2640 – 2651.
S.Mallat (1998). A Wavelet Tour of Signal Processing, second edn, Academic Press.
S.Mallat & S.Zhong (1992). Characterization of signals from multiscale edges, IEEE Trans.
Pattern Anal. Machine Intell. 14(7): 710–732.
Williams, C. & M.Seeger (2000). Using the Nyström method to speed up kernel machines,
Annual Advances in Neural Information Processing Systems 13 pp. 682–688.
21
Usage of Mesh Networking in a
Continuous-Global Positioning System
Array for Tectonic Monitoring
Hoang-Ha Tran and Kai-Juan Wong
Nanyang Technological University
Singapore
1. Introduction
In recent years, tectonic plate movements have caused huge natural disasters, such as the
Great Sumatra-Andaman earthquake and the resulting Asian tsunami, which led to
significant loss of human lives and properties (Ammon et al., 2005; Lay et al., 2005).
Scientific evidences proved it was the beginning of a new earthquake supper-cycle in this
active area (Sieh et al., 2008). In order for scientists to further study such disasters and
provide early warning of imminent seismic events, many continuous-Global Positioning
System (cGPS) arrays were developed and deployed to monitor the active tectonic plates
around the world such as “SuGAr” along the Sumatran fault, “GEONET” covering all Japan
islands, and “SCIGN” covering most of southern California. Each of these cGPS arrays
contains tens to hundreds of GPS stations. Using precise GPS receivers, antennas and
scientific-grade GPS processing software, measurements from each GPS station are able to
provide location information with sub-millimeter accuracy. These location data produced by
the GPS stations, which are located in the vicinity of active tectonic plates, provided accurate
measurements of tectonic movements during the short period of a co-seismic event as well
as for the long period observation of post-seismic displacement.
The GPS applications in earthquake studies (Segall & Davis, 1997) include monitoring of
co-seismic deformation, post seismic and inter-seismic processes. Post seismic (except
aftershocks) and inter-seismic deformations are much smaller than co-seismic events, where
there is little or no supporting information from seismic measurements. In this instance, GPS
can be used to detect the long time inter-seismic strain accumulation which leads to
indentify the location of future earthquake (Konca et al., 2008).
In cGPS arrays utilizing satellite communications such as the Sumatran cGPS Array
(SuGAr), each GPS station in the cGPS array will periodically measure the tectonic and/or
meteorological data which will be stored locally. A collection of these observed GPS data
will then be sent to a data server through a dedicated satellite link from each station either
in real-time or at update intervals ranging from hours to months. At the server, the collected
data from the GPS stations will be processed by using closely correlated data from each
station to reduce errors in the location measurements. Since the amount of data transmitted
from each station could be relatively large, the communication bandwidth and the number
of uplinks are the most important factors in terms of operational expenditure. Each satellite
Communications and Networking
416
link requires costly subscription and data transmission across these links are usually
charged based on the connection time or the amount of data transmitted/received.
Therefore, in order to reduce the operational cost of a cGPS array, it is paramount that the
number of satellite links as well as the data sent on these links be kept to a minimum. The
rest of this chapter is organized as follows. Commonly used data formats for GPS processing
is introduced in section 2. Introduction of cGPS arrays including SuGAr are presented in
section 3. Proposed modifications of SuGAr network and parallel GPS processing which
make use of mesh network are evaluated in section 4. Lastly, the chapter will end with a
brief conclusion.
2. Common data formats used for cGPS systems
Scientific-grade GPS receivers store their measured signals in binary format that prolong
logging time of those devices. Some of the most commonly used property binary formats for
GPS receivers are R00/T00/T01/T02 and B-file/E-file used by Trimble and Ashtech
receivers respectively. Another widely adopted binary format proposed by UNAVCO is the
“BINary EXchange” (BINEX) format, which is used for research purposes. It has been
designed to encapsulate most of the information currently acceptable for GPS data. Binary
files were converted to text file for easy handling and processing. For GPS data storage and
transmission, the most generally used GPS exchange data type is the RINEX format
(Gurtner & Mader, 1990). It contains processed data collected by the GPS stations. This
format defined four file types for observation data, navigation message, meteorological
message and GLONASS navigation message. As correlation exists between the consecutive
GPS measurement data, CRINEX (Hatanaka, 1996), a compressed RINEX format, proposed
based on the idea that observation information between each measurement was related and
changed at a small pace. The use of CRINEX reduces the storage space and transmission
bandwidth requirements as only the difference between the current observation data and
the first occurrence of it is stored.
3. Sumatran cGPS array - introduction and configuration
Many cGPS arrays were deployed to monitor some of the active tectonic plates around the
world. Each of these cGPS arrays contains tens to hundreds of GPS stations, spanning from
hundreds to thousands kilometers and varying methods are used for monitoring and
harvesting the data from those stations. In this section, some of those arrays are described.
The GPS Observation Network system (GEONET) (Yamagiwa et al., 2006) is one of the most
dense cGPS network comprising of over 1200 GPS stations nationwide. It was used to
support real-time crustal deformation monitoring and location-based services. GEONET
provides real-time 1Hz data through a dedicated IP-VPN (Internet Protocol Virtual Private
Network).
The Southern California Integrated GPS Network (SCIGN) (Hudnut et al., 2001) contain
more than 250 stations covering most of southern California which provide near real-time
GPS data. SCIGN is used for fault interaction and post-seismic deformation in the eastern
California shear zone.
The New Zealand GeoNet (Patterson et al., 2007) is a nation-wide network of broadband
and strong ground motion seismometers complimented by regional short period
seismometers and cGPS stations, volcano-chemical analyzers and remote monitoring
Usage of Mesh Networking in a Continuous-Global Positioning System Array for Tectonic Monitoring
417
capabilities. It comprises of more than 150 cGPS stations across New Zealand. All seismic
and GPS data are transmitted continuously to two data centers using radio, land-based or
VSAT systems employing Internet Protocol data transfer techniques.
The Sumatran continuous-Global Positioning System Array (SuGAr) is located along
Sumatra, Indonesia. As at the end of 2009, it consists of 32 operational GPS stations
spanning 1400 km from north to south of Sumatra (Fig. 1). Stations are located either in
remote islands or in rural areas near the tectonic place boundary which is one of the most
active plates in the world. Due to the lack of local data communication network
infrastructure, satellite telemetry is the only means of communicating with the GPS stations.
All of the stations are equipped with a scientific-grade GPS receiver, a GPS antenna, a
satellite modem, solar panels and batteries.
TIKU station
PSKI station
Fig. 1. Geographical distribution of the SuGAr stations
Communications and Networking
418
4. Utilisation of mesh networking
Mesh networking is proposed in this chapter to reduce the number of satellite links and
bandwidth requirement for transmission of GPS data. To analyze the optimization achieved
by the use of mesh networking on the SuGAr network, evaluation was performed using the
archived SuGAr observation data from the last two months (61 days) of 2007. Only 24
stations were taken into account in this case study, as only 24 GPS stations were able to
provide the complete GPS dataset for this entire period. This experiment data set can be
accessed from the SOPAC website (
Several assumptions were made for the evaluations presented in this study as follows:
• All GPS stations have enough energy to deal with the overheads cause by the additional
communication equipments and data computation required. This assumption can be
satisfied by adding more batteries and solar panels to the existing nodes.
• To simplify the analysis, the terrain information between the GPS stations was not
taken into consideration in this analysis. In practice, construction of tall antenna towers
as well as the use of multi-hop relays/repeaters can be used to overcome obstructions if
required.
• The transmission overheads for the long range radios, such as packet formatting and
control protocols, were not included in the evaluation as they will not have an impact
on the analysis presented in this study.
The two main performance attributes of interest in this study are the reduction of the
number of satellite links as well as the total amount of data transmitted via these links.
4.1 Removal of co-related data and reduction of uplink requirements
Mesh networking and clustering can be used to reduce the number of satellite links required
for data telemetry between the GPS stations and the remote server. Wireless mesh networks
can be established using long-range radios such as those developed by companies like
FreeWave or Intuicom. These radios provide a point-to-point line-of-sight (LoS) wireless
communication link with a maximum range of more than 96 kilometres (60 miles) and a
maximum over-the-air throughput of 154 Kbps. For communication links over a longer
distance, multi-hop communications can be utilized by deploying relay stations. The use of
relay stations may also overcome LoS obstructions between GPS stations as well as provide
for extended mesh networking capabilities such as redundancy. Depending on the cost,
geographical, power or latency considerations, the number of hops and the radio range
supported may be limited. In this case, clusters of GPS stations will be formed and a cluster-
head would be selected for each cluster. Each cluster-head will have satellite communication
capabilities and will be responsible for collecting all the observation data from the GPS
stations within the cluster and transmitting them to the remote centralized data server. This
greatly reduces the number of satellite links needed, as each cluster requires a minimum of
only one satellite link. The various possible mesh network setups using the current
geographical locations of the GPS station in the SuGAr array will also be presented.
In this study, each GPS station can be equipped with one or more long-range radios such as
the FreeWave FGR-115RE. These radios specify a maximum range of over 90 km and can be
used to form peer-to-peer wireless mesh networks between GPS stations. Assuming the
maximum range of 90 km, the absence of relay stations or repeaters and the geographical
locations of the 24 GPS stations, Fig.2 shows the network topology of GPS stations that will
be formed using the FreeWave radios. It will contain one cluster with eight nodes, one
Usage of Mesh Networking in a Continuous-Global Positioning System Array for Tectonic Monitoring
419
cluster with three nodes, two clusters with two nodes, and nine clusters with one node.
Assuming that only one satellite uplink is required for each cluster, 13 satellite links will
have to be maintained.
Fig. 2. Clusters of GPS station using 90 kilometer radio range
The range of the radio can be extended through the use of relay stations or repeaters. Thus,
using the geographical locations of the 24 GPS stations, the minimum number of uplinks
required and cluster size across various radio ranges can be determined. Fig. 3 shows the
number of uplinks required for the various ranges. From the figure, it can be seen that given
a maximum radio range of 20 km, only two GPS stations can be linked together and all other
GPS stations were out of range from each other. Therefore, 23 satellite uplinks were required
in this case. However, given a maximum radio range of 250 km, all GPS stations were
grouped into one cluster using only one uplink.
Fig. 3. Number of satellite uplinks required across various radio ranges
Communications and Networking
420
Fig. 4 provides the graph showing the average and the maximum number of GPS stations in
a cluster across a radio range from 10 km to 250 km. As the number of GPS stations in a
cluster increases, the data aggregated at the cluster-head will also increase in size. This will
lead to better compression ratio at the cluster-heads and this phenomenal will be presented
in more detail in the later part of this secion.
Fig. 4. Cluster sizes characteristics based on the various radio ranges
4.2 Collaborative compression of data
Cluster-based compression at the cluster-heads will be introduced where each cluster-head
will compress the observation data from all GPS stations within the cluster using the LZMA
(Ziv & Lempel, 1977) algorithm prior to transmission via the satellite link. Compared to the
existing SuGAr deployment where each GPS station transmits the observation data
independently, the use of mesh networking allows larger datasets to be formed through the
aggregation of observation data from each GPS station within the cluster. Given that the
compression ratio generally increases in proportion to the size of the dataset to be
compressed, the number of bytes transmitted via the satellite will be significantly reduced.
Currently, the SuGAr sends collected data daily through dedicated satellite links from each
GPS station. For this analysis, the GPS measurements will be converted locally to CRINEX
format at each GPS station. Fig. 5 shows the total number of data bytes transmitted via all
the satellite links using three different setups as follows:
• Setup 1: For the first setup, CRINEX data was uploaded via dedicated satellite links
from each GPS stations without further compression.
• Setup 2: For the second setup, the CRINEX data was compressed using the LZMA
algorithm prior to transmitting via dedicated satellite links at each GPS station.
• Setup 3: For the third and final setup, clusters of GPS stations were formed using long
range radios with various maximum transmission ranges. In each cluster, one GPS
station will be designated as the cluster-head and all other stations will forward their
CRINEX data to the cluster-head. The cluster-head will perform further compression
using LZMA algorithm on the aggregated data as a whole prior to transmitting the
compressed data to the data server via a satellite link.
From Fig. 5, it can be seen that for Setup 2, the total number of bytes transmitted via all the
satellite links over a 61 days period were reduced by about 67% when compared to Setup 1.
Usage of Mesh Networking in a Continuous-Global Positioning System Array for Tectonic Monitoring
421
This demonstrates the effectiveness of the LZMA compression algorithm. Further reduction
was demonstrated by the use of the cluster-based approach in Setup 3. In this setup, as a
larger dataset was compressed, the compression ratios achieved by the LZMA algorithm at
the cluster-head were more significant than in the case where compression was performed
at individual GPS stations separately. Thus, this method reduced the total number of bytes
transmitted by about 2% and 9% when compared to Setup 2 for a maximum radio range of
90 km and 250 km respectively.
Fig. 5. Total size of transmitted data based on daily updates across two months (61 days) for
various radio ranges
The analysis performed in Fig. 5 was based on daily updates from the GPS stations.
However, more frequent updates might be useful for early warning systems and near real-
time assessment of tectonic plate movements. Thus, further analysis was performed to
evaluate the performance of the three setups across three different update intervals: daily,
hourly and two minutely. Table 1 shows the comparison of Setup 1 (uncompressed data)
and Setup 2 (un-clustered compressed data) with various update frequency. It can be seen
from the results that as the update intervals get more regular, the performance of the LZMA
algorithm suffers as smaller datasets were being compressed. For example, when daily
updates were performed with the GPS station sampling once every 2 seconds, dataset
consisting of a total of (24hrs * 60min * 60 sec /2) = 43200 measurements (epochs) was
compressed whereas in the case where hourly updates were performed, each dataset consist
of only (60 min * 60 sec /2) = 1800 measurements (epochs). However, from the results, it can
be seen that even when updates were performed every two minutes, the use of the LZMA
compression in Setup 2 still enables less data to be transmitted via the satellite when
compared to Setup 1.
Total Transmitted Data
Update Frequency
Uncompress Compress Percentage
a
Daily 325,099,037 byte 112,188,360 byte 35%
Hourly 402,298,012 byte 158,994,711 byte 40%
2Minutely 2,245,193,111 byte 979,810,017 byte 44%
a. Percentage of compress data when compare with uncompress data
Table 1. Compare Uncompressed and Compressed Data
Communications and Networking
422
Fig. 6 shows the total transmitted data size in Setup 3 as a percentage to the total transmitted
data size in Setup 2 across various radio ranges. From the results, it can be seen that the use
of long range radios to form mesh networks and clusters in Setup 3 significantly reduces the
amount of data to be transferred via the satellite links when compared to Setup 2. This
reduction is more significant when the update frequency increases. This is due to the use of
data aggregation within the cluster to enable larger datasets to be compressed. For example,
when a maximum radio range of 250 km is used, data from all 24 GPS stations will
aggregated prior to compressing using the LZMA algorithm. Assuming hourly update
intervals, each dataset consisting of ((60min * 60 sec /2) * 24 nodes) = 43200 measurements
(epochs) was compressed in Setup 3 as compared to the 1800 measurements in Setup 2.
Because of this, Setup 3 managed to reduce the total data transmission across the 61 days by
about 70% when compared to Setup 2.
Fig. 6. Compare the improvement between compress observation data and use of clusters
over different update intervals and radio range.
Total Transmitted Data
Update Frequency
Uncompress Compress Percentage
b
Daily 322,554,780 byte 111,317,030 byte 35%
Hourly 341,813,991 byte 137,613,065 byte 40%
2 Minutely 710,381,007 byte 417,818,057 byte 59%
b. Percentage of compress data when compare with uncompress data without header
Table 2. Compare Uncompress and Compress Data without Header
To further reduce the size of the transmitted data, the observation headers sent with every
update from the GPS stations were removed whenever possible. This significantly reduced
the size of the uncompressed data in Setup 1 as shown in Table 2. Moderate reductions in
Setup 2 were also observed when the observation headers were removed.
To conclude the evaluations, the use of Setup 3 (the use of wireless mesh networks) without
observation headers was compared to Setup 2 (use of dedicated satellite links). The result of
this comparison is shown in Fig. 7. From the figure, it can be seen that the use of mesh
Usage of Mesh Networking in a Continuous-Global Positioning System Array for Tectonic Monitoring
423
networking, cluster-based compression and removal of the observation header significantly
reduces the amount of data transmitted via the satellite links.
Fig. 7. Compare the improvement between compress observation data (with header) and use
of cluster-based compression (without headers) over different update intervals and radio
range.
4.3 Parallel and distributed in-situ processing for GPS corrections
In-situ parallel and distributed processing of GPS corrections can be made possible using
mesh networking. The observation data from adjacent GPS stations can be grouped together
and processed in a hierarchy fashion. Compared to the conventional method of sequential
processing, the computational complexity and computation time of parallel and distributed
GPS processing with various schemes decreases significantly. By sharing data within the
mesh network, it is possible for in-network processing to be performed for GPS corrections
using the embedded processing capability at each GPS station. This allows early-warning
applications to be developed without the need for costly data transmission to a remote
centralised server. The remaining of this section is organized as follow. Firstly, GPS
measurement and parameters estimation process is briefly presented. Secondly, the
computational complexity of parallel processing is evaluated using one layer and multiple
layers approach. Finally, two empirical studies with various settings are studied.
Assuming that all receivers can receive signals from both frequencies L1 and L2, the
ionosphere-free linear combination can be calculated. The distance between satellites and
receivers are given by carrier phase and pseudo-range measurements. In phase
measurement, at time t, the distance between receiver r and the satellite x models is derived
as
()
rxt rxt rxt rt rxt rxt rt xt rxt
Lbzm Ccv
ρ
θω
=
++ + +++ (1)
and the pseudo-range measurement is derived as
()
rxt rxt rt rxt rt xt rxt
PzmCc
ρ
θη
=
++++ (2)
Communications and Networking
424
in which, ρ
rxt
is the true range, b
rxt
is the phase bias or ambiguity, z
rt
is the zenith
troposphere delay, m(θ
rxt
) is the map function of elevation angle between transmitter and
receiver. Receiver and transmitter correction are C
rt
and c
xt
respectively. The noise of the
measurement is represented by v
rxt
for phase and η
rxt
for pseudo-range measurement.
Data is considered from R receiver and X transmitters spanning across Δ time with the data
collection frequency σ. The median probability that a satellite signal is detected by a receiver
above an elevation cutoff is given by Ω/4π (≈ 0.25 for a 15° cutoff). Thus, the number of
measurement is given by
m = RX ( /4 ) ( / ) d
πδ
ΩΔ
(3)
in which d is the number of data types, typically including two types; ionosphere-free phase
and pseudo-range. The number of parameters from those receivers and transmitters will be
estimated and consist of receivers, transmitters and polar motion parameters. It is given by
n = aR + bX + c (4)
The parameters related to the receiver include three Cartesian coordinates, tropospheric
delay, receiver clock bias and phase bias parameter for each transmitter in the view of that
receiver, so a = 5 + X. The transmitter parameters include epoch state position, velocity, two
solar radiation parameters, Y bias parameter and clock bias, b = 10. Polar motion and rates
are estimated in one day time given by c = 5.
The computation complexities of the parameter evaluation process using least square
estimate method of n parameters with m measurement requires the number of arithmetic
operations B in equation (5). This is also known as the computation burden. The detail
analysis was presented in Zumberge, et al (1997).
2
B nm∝ (5)
One approach to reduce the computation complexity is to divide the data into groups and
layers, which could then be processed in a parallel fashion. In addition, it makes use of
common parameters and receivers between groups in the same layer. The detail of this
processing approach will be presented in the next sub-sections.
4.3.1 Parallel GPS processing
In this part, parallel parameters estimation is studied with the objective of reducing the
computation complexity and processing time when compared to the centralize processing
method that is mentioned previously. It deals with estimating n unknown parameters of m
measurements from R receivers and X transmitters. Moreover, receivers are divided into
groups based on some criteria such as antenna type (Miyazaki, 1999), geography (Serpelloni
et al., 2006), and/or the availability of data. Groups may share some common reference
stations/receivers. One layer and multilayer parallel processing approach will be presented
in the remaining of this section. All used notations are listed at the end of this chapter.
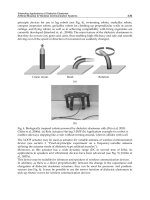
a. One layer parallelism
In one layer method, receivers are divided into J computation groups (Fig. 8) instead of
estimating all parameters within one group. Suppose that the number of common
parameters between all groups is κn and the remaining parameters equally divided for each
group is (1-κ)n/J. In addition, the number of common reference receivers between all
Usage of Mesh Networking in a Continuous-Global Positioning System Array for Tectonic Monitoring
425
Fig. 8. One level parallel processing
groups is ζR. For simplicity, suppose the number of common measurement proportional to
ζ is given by ζm and the remaining measurements are equally divided between groups, (1-
ζ)m/J, for each group. The number of parameters and measurements at level zero for each
group is thus derived as
(
)
(
)
0, 0,
1- 1-
ii
nm
nn andmm
JJ
κζ
κζ
=+ = + (6)
Arithmetic operations required are proportional to
2
0, 0,ii
nm
, thus from equation (5)
2
0,
(1 ( 1) ) (1 ( 1) )
B
i
Jn Jm
JJ
κζ
⎛⎞
+− +−
∝
⎜⎟
⎝⎠
(7)
in which B
0,i
is the number of arithmetic operations required at any group i (1≤i≤J) at level
zero. There are J groups in this level with the same number of arithmetic operations so the
total number of operations is equal to J multiplied by the number of operation of one
representative group B
0,1
. Hence, the total number of arithmetic operations at level zero is
equal to
00, 0,1
1
J
i
i
BBJB
=
==∗
∑
(8)
Finally, the parameter estimation processing at level 1 is the refinement of J group at level
zero. It includes n parameters and the number of measurement equaling to the total number
of estimated parameter of J groups at level zero. Using equation (5), the computation burden
is derived as
()
()
22
10,
1
11
J
i
i
Bnnn J n
κ
=
∝=+−
∑
(9)
Thus, the total number of operations B is equal to the sum of all computation burdens at
level zero and level one as follows,
2
01
2
(1 ( - 1) )(1 ( 1) )
(1 ( - 1) )( )
JJm
BB B n J n
J
κζ
κ
++−
=
+∝ + + (10)
Communications and Networking
426
The computation reduction percentage χ is equal to number of operations divide by the
number of operation n
2
m required for simultaneous parameter evaluation.
22
(1 ( - 1) )(1 ( 1) )
(1 ( - 1) )( )
BJJn
J
m
nm J
κζ
χκ
++−
=∝+ + (11)
The value of χ approaches unity when ζ and κ approaches 1 assuming n/m is small.
Therefore, if all the parameters and receivers are common between groups, parallel
processing is ineffective.
This method is applied for the Sumatra continuous GPS (cGPS) array (Tran & Wong, 2009)
and the results are evaluated for two different configurations using the parameters X = 24,
Ω/4π = 0.25, Δ = 24h, σ = 2 min, d = 2, a = 29, b = 10, c = 5. For the first configuration, the
number of receivers R equal to 40 which include 32 GPS stations of Sumatra cGPS array and
8 International GNSS Service (IGS) reference stations. In the second configuration, only 32
Sumatra cGPS stations were used without reference stations.
In the first configuration, we have ζ equal to the number of reference stations divide by the
total number of stations, thus, ζ=8/40=0.2. The number of common parameters equal to the
sum of the parameters of the common reference stations, the transmitter parameters and the
polar motion. This can be calculated using equation (12), so κ ≈ 0.34.
naRbXc
κ
ζ
=
++
(12)
In the second configuration, the number of common reference stations,
ζ, is equal to zero
and so, using equation (12),
κ ≈ 0.17.
The computation reduction with respect to the different groups is presented in Fig. 9. In the
case where reference stations were utilized, the maximum reduction reached 57% when
receivers were divided into 5 groups. It decreases when the number of group increased due
to the overheads of the reference station when using more groups. In the case where no
reference stations were used, the maximum reduction reaches 91.6% when receivers where
divided into 16 groups with 2 receivers per groups.
0
10
20
30
40
50
60
70
80
90
100
0246810121416
Computation reduction percentage
Number of Partition
Without reference frame
With reference frame
Fig. 9. Computation reduction for the Sumatra cGPS array using one level parallel processing
Usage of Mesh Networking in a Continuous-Global Positioning System Array for Tectonic Monitoring
427
b. Multilayer parallelism
For generalization, the multilayer parallel is studied with L layer and each layer includes
power of p groups. It denotes that there are p power of L groups at level zero and each
group at level j (1≤j≤L) receives data from p groups at the adjacent predecessor level j-1. For
instance, p equals to two in Fig. 10.
Group 1 Group 2
Group
2^L-1
Group
2^L
Group 3 Group 4
Level 0
Level 1
Level 2
Level L
Fig. 10. Multilayer parallel processing with L layer with power of 2 groups. The processing
tree will contain 2^L groups at level 0 and each group at level j (0<j≤L) is the combination of
2 node at level j – 1.
With the same assumption of common parameters and measurements with the one layer
parallel method mentioned previously, the number of parameters is equal to the sum of the
common parameters and private parameters of each group of receivers and number of
measurements are equal to sum of the common measurements from common receivers and
private measurements from the private receivers.
0, 0,
(1 - ) (1 - )
ii
LL
nm
nn andmm
pp
κζ
κζ
=+ =+ (13)
Therefore, the number of arithmetic operations of group i at level zero is
22
0, 0, 0,
(1 ) (1 )
= ( ) ( )
iii
LL
nm
Bnm n m
pp
κζ
κζ
−−
∝+ + (14)
So, the total computation burden for level zero which include
L
p
group equals to
00,
1
=
L
p
i
i
BB
=
∑
(15)
Communications and Networking
428
Furthermore, the computation burden for each group i at level j (1≤ j ≤L) is proportional
to
2
,,
j
i
j
i
nm , in which the number of parameter n
j,i
is equal to the sum of common parameters
κn and the private parameters of p ancestor group at level j–1, each of which comprise
of
(
)
1
(1 - ) /
j
L
np p
κ
−
∗ private parameters. Therefore,
,
(1 - )
j
ji
L
n
nn p
p
κ
κ
=+ (16)
In addition, the number of measurements at level j is equal to the summation of all
estimated parameters of p ancestor at level j–1,
1
,
(1 - ) (1 - )
p( ) p
j
i
ji
LL
nn
mn
p
n
p
pp
κκ
κκ
−
=+ =+ (17)
Therefore, the computation burden of each group i at level j equals to
2
,
(1 - ) (1 - )
( )( )
jj
ji
LL
nn
Bn
pp
n
p
pp
κκ
κκ
∝+ + (18)
The total computation burden for level j which include
L
j
p
−
groups is then derived as
2
,
1
(1 - ) (1 - )
( )( )
Lj
p
jj
L
j
jji
LL
i
nn
BBn ppn pp
pp
κκ
κκ
−
−
=
=∝+ +
∑
(19)
The total computation burden of multiple parallel processing is equal to summation of
computation of all level from level 0 to L as follows:
2
0
11
2
(1 - ) (1 - )
( )( )
(1 - )
( ) (1 ( 1) )
LL
jj
L
j
j
LL
jj
L
L
nn
BBB n ppn pp
pp
n
np m
p
κκ
κκ
κ
κζ
−
==
=+∝ + + +
++−
∑∑
(20)
c. Computation time
Assuming that the computation time is the dominant latency between processing groups at
adjacent layer, the processing time of parallel GPS processing, in the worst case, is
calculated by the summation of the maximum computation time at each layer at the critical
computation path. The critical path for one layer and multilayer parallel processes is given
in Fig. 11 and Fig. 12 respectively.
The computation time C is equal to number of arithmetic operation multiply by c, the
computation time for each arithmetic operation. The equation for one layer and multilayer
are therefore derived as follow:
()
()
2
2
(1 ( 1) ) (1 ( 1) )
11 *
onelayer
Jn Jm
CnJn c
JJ
κζ
κ
⎛⎞
⎛⎞
+− +−
⎜⎟
=+−+
⎜⎟
⎜⎟
⎝⎠
⎝⎠
(21)
Usage of Mesh Networking in a Continuous-Global Positioning System Array for Tectonic Monitoring
429
2
1
2
(1 - ) (1- )
(( )( )
(1 - )
( ) (1 ( 1) ) ) *
L
jj
multilayer
LL
j
L
LL
nn
Cnppnp
pp
nm
np c
pp
κκ
κκ
κ
κζ
=
=
+++
++−
∑
(21)
.
Fig. 11. One layer critical path
Group 1 Group 2
Group
2^L-1
Group
2^L
Group 3 Group 4
Level 0
Level 1
Level 2
Level L
Fig. 12. Multilayer critical path
4.3.2 Empirical study
To compare the reduction in computation burden and computation time of one layer and
multilayer parallel parameter estimation for GPS processing, two experimental setups were
studied as following.
Experiment set 1: for the network parameter estimation, reference receivers were not
included. This experiment compares the number of processing groups, computation
reduction and computation time between three system settings with different number of
GPS receivers. Three system settings are
Communications and Networking
430
• One layer,
•
Multilayer with power of 2,
•
Multilayer with power of 3
The results of experiment set 1 is shown from Fig. 13 to Fig. 15. From the results, it can be
seen that when the number of receivers is equal to 16 or 48, the number of computation
process for multilayer with power of 3 is smaller than other two settings. As a result, the
computer reduction is lower than other settings and the computation burden is larger than
multilayer with power of 2. With other number of receivers bigger than 48, the computation
reduction is almost analogous for all settings. Parallel GPS processing significantly reduces
the computation complexity, especially when the number of receivers is bigger than 32.
Furthermore, multilayer processing drastically reduces the computation time by about 50%
when compared with the one layer approach. In most of cases, the number of computation
0
2
4
6
8
10
12
14
16
18
20
22
24
26
28
30
0 8 16 24 32 40 48 56 64 7 2 80 88 96 104 112 120 1 28
Number of computation process
Number of Receiver
One layer
Multilayer power of 2
Multilayer power of 3
Fig. 13. Compare the number of computation processing groups with respect to number of
receiver
50
55
60
65
70
75
80
85
90
95
100
0 8 16 24 32 40 48 56 64 72 80 88 96 104 112 120 128
Computation reduction percentage
Number of Receiver
One layer
Multilayer power of 2
Multilayer power of 3
Fig. 14. Compare the computation reduction with respect to number of receivers
Usage of Mesh Networking in a Continuous-Global Positioning System Array for Tectonic Monitoring
431
0
2
4
6
8
10
12
14
0 8 16 24 32 40 48 56 64 72 80 88 96 104 112 120 128
Computation time x 10^10c
Number of Receiver
One layer
Multilayer power of 2
Multilayer power of 3
Fig. 15. Computation time comparison. The computation time is product of c, the
computation time for one arithmetic operation
processes of multilevel methods is lower than one level method. As a result, multilevel is the
best selection for in-network parameter estimation processing as demonstrated in this
experiment.
Experiment set 2: global parameter estimate with 8 reference receivers (all group will share
the same 8 reference receivers) using the same three comparative setting with the first
experiment:
•
One layer,
•
Multilayer with power of 2,
•
Multilayer with power of 3
The experiment results are shown from Fig. 16 to Fig. 18 (reference receivers are not
included in the number receivers in the x-axis of the graph).
0
2
4
6
8
10
12
14
16
18
20
22
24
26
28
30
0 8 16 24 32 40 48 56 64 72 8 0 88 96 104 112 120 128
Number of computation process
Number of Receiver
One layer
Multilayer power of 2
Multilayer power of 3
Fig. 16. Compare the number of computation processing groups with respect to number of
receivers
Communications and Networking
432
20
30
40
50
60
70
80
90
100
0 8 16 24 32 40 48 56 64 72 80 88 96 104 112 120 128
Computation reduction percentage
Number of Receiver
One layer
Multilayer power of 2
Multilayer power of 3
Fig. 17. Compare the computation reduction with respect to number of receivers
0
2
4
6
8
10
12
14
16
18
20
0 8 16 24 32 40 48 56 64 72 80 88 96 104 112 120 128
Computation time x 10^10c
Number of Receiver
One layer
Multilayer power of 2
Multilayer power of 3
Fig. 18. Computation time comparison. The computation time is product of c, the
computation time for one arithmetic operation
From the results, it can be seen that when the number of receivers is equal to 32 or 96, the
number of computation processes using the multilayer approach with a power setting of 3 is
smaller when compared to the other settings. The computation reduction is also larger than
the other settings in the case of 32 receivers and larger than multilayer with a power of 2 in
the case of 96 receivers. Thus, it can be seen that parallel GPS processing significantly
reduces the computation complexity, especially when the number of receivers is bigger than
32 and steadily increases when the number of receivers increases. Furthermore, the
multilayer processing approach slightly decreases the computation time, as in most of the
cases, the number of computational operations performed by the multilevel methods is
lower than the one level method.
Usage of Mesh Networking in a Continuous-Global Positioning System Array for Tectonic Monitoring
433
5. Conclusion
A study using mesh networking for tectonic monitoring was presented. Mesh networks can
be established between the GPS stations by means of long-range radios and data
aggregation was performed to enable cluster-based compression. Using the actual data
captured from the Sumatran cGPS array (SuGAr) in the evaluation and analysis, it was
concluded that the proposed use of mesh networking not only reduces the number of costly
satellite uplinks required, it also significantly reduces the total amount of data transferred
through these links. Moreover, by making use of mesh networks between the GPS stations,
parallel, distributed and hierarchical GPS processing methods can be made possible. By
reducing the computation complexity, this proposed computational model allows the
possible use of the spare computational power within the cGPS network such as from the
routers and station controllers using the wireless mesh network connections between
stations to transmit GPS data and perform collaborative GPS processing in a real-time
fashion.
6. References
Ammon, C. J., Ji, C., Thio, H K., Robinson, D., Ni, S., Hjorleifsdottir, V., et al. (2005).
Rupture Process of the 2004 Sumatra-Andaman Earthquake. Science, 308(5725),
1133-1139. doi: 10.1126/science.1112260
Gurtner, W., & Mader, G. (1990). Receiver Independent Exchange Format Version 2. GPS
Bulletin, 3(3), 1-8.
Hatanaka, Y. (1996, 17-20 September ). A RINEX Compression Format and Tools. Paper
presented at the Proceedings of ION GPS-96.
Hudnut, K. W., Bock, Y., Galetzka, J. E., Webb, F. H., & W. H. Young. (2001). The Southern
California Integrated GPS Network (SCIGN). 10th International Symposium on
Crustal Deformation Measurement, 129-148.
Konca, A. O., Avouac, J P., Sladen, A., Meltzner, A. J., Sieh, K., Fang, P., et al. (2008). Partial
rupture of a locked patch of the Sumatra megathrust during the 2007 earthquake
sequence. [10.1038/nature07572]. Nature, 456(7222), 631-635. doi:
/>html
Lay, T., Kanamori, H., Ammon, C. J., Nettles, M., Ward, S. N., Aster, R. C., et al. (2005). The
Great Sumatra-Andaman Earthquake of 26 December 2004. Science, 308(5725),
1127-1133. doi: 10.1126/science.1112250
Miyazaki, S i. (1999). Construction of GSI's Nationwide GPS Array. Proceedings of the Joint
Meeting of the U.S Japan Cooperative Program in Natural Resources Panel on
Wind and Seismic Effects, 31, 518-528.
Patterson, N., Gledhill, K., & Chadwick, M. (2007). New Zealand National Seismograph
Network Report for the Federation of Digital Seismograph Networks Meeting,
2007. Perugia, Italy: 2007 FDSN Meeting.
Segall, P., & Davis, J. L. (1997). GPS applications for geodynamics and earthquake studies.
Annual Review of Earth and Planetary Sciences, 25, 301-336. doi:
10.1146/annurev.earth.25.1.301