Natural Gas Part 6 pptx
Bạn đang xem bản rút gọn của tài liệu. Xem và tải ngay bản đầy đủ của tài liệu tại đây (2.16 MB, 40 trang )
Natural Gas192
All of the collected gases are CO
2
-dominant (the content varies from a minimum of 83.64
vol. % to a maximum of 98.43 vol. %). Fig. 6 shows a comparison of the CO
2
values from the
five monitored vents through a statistical distribution (box plots). The CO
2
leakage varies at
the different vents being higher at the Black point and lowest at the Sink point. However,
median values are very similar for each vent suggesting a common degassing input linked
to local tectonic features. In fact, all the gas emission points are located along N–S, E–W and
NE–SW oriented active faults controlling the Aeolian Volcanic District. The main
consequence of the presence of high levels of CO
2
in the water chemistry is a generic
acidification of the sea with a reduction in pH. This phenomenon affected both the macro
and the micro biota. Regarding the macro life-forms in particular, extensive damage to the
benthic life-forms was observed; this damage was mainly to the calcareous-shell organisms.
Even though the damage to the benthic life-forms seems to be permanent, there is a general
healing of the ecosystem with the return of some species of fish. Another organism that was
seriously affected by the presence of carbon dioxide is the “Posidonia oceanica” sea-grass.
Once the Posidonia was dead, the available substratum was colonized by other species such
as more resistant algae. Of the studied micro life-forms, the viral abundance was affected by
the presence of the gas vents with a decrease close to the carbon dioxide plumes. From these
results it is possible to hypothesize that viruses can be less tolerant than prokaryotes to the
carbon dioxide chemistry and this can have consequences on the biota equilibrium in the
areas affected by increased levels of CO
2
(Manini et al., 2008).
Fig. 6. Box plots of soil gas CO
2
data from the Panarea vents. The median values are very
similar for each vent suggesting a common degassing input linked to local tectonics.
Another example of toxic emanation study was performed in the Albani Hills area (a
volcano located about 20 km southeast of Rome and extending over an area of about 1500
km) where strong areally diffuse and localised spot degassing processes occur
(Annunziatellis et al., 2003). The main structural features which cause the high degassing
phenomena are buried highs in the carbonate basement which act as gas traps.
Data were processed in order to build risk maps and highlight areas having a potential
health hazard in terms of the short-term risk caused by elevated CO
2
concentrations and the
long-term risk caused by high radon concentrations (Beaubien et al., 2003).
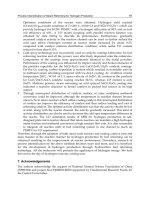
Figs. 7 and 8 show the contour maps of radon and carbon dioxide concentrations in soil gas
calculated using the kriging method and spherical variograms model estimation. In the
surveyed area, the distribution of anomalous radon values (>60 kBq/m
3
) shows a maximum
anisotropy orientation (N340°–350°), which parallels that of the Apennine mountains. This
can be seen both in the western and the eastern sectors along the Appia road (where aligned
effervescent water springs occur). Point anomalies occur around the Consorzio Vigna Fiorita
(from 75 to 250 kBq/m
3
, 1.8–2.4 in log scale), as well as near the village of Cava dei Selci
(>100 kBq/m
3
) where the major gas release occurs. Background values (i.e. in situ
production) occur in the central sector of the area.
Fig. 7. Map of the radon distribution in soil gas. The radon anomalous values (>60 Bq/l, 1.7
in log scale) shows clear linear trends parallel to the Apennine mountains. The anomalies
are located in the western sector where an alignment of sparkling water springs also occur,
and in the eastern sector.
Fig. 8. Map of the carbon dioxide distribution in soil gas. Carbon dioxide concentrations also
show a mild anisotropy along a NW–SE major axis, similar to that of radon. Most of the
anomalous concentrations (up to 80%, 1.9 in log scale) occur as spots in the eastern sector.
Soil gas geochemistry: signicance and application in geological prospectings 193
All of the collected gases are CO
2
-dominant (the content varies from a minimum of 83.64
vol. % to a maximum of 98.43 vol. %). Fig. 6 shows a comparison of the CO
2
values from the
five monitored vents through a statistical distribution (box plots). The CO
2
leakage varies at
the different vents being higher at the Black point and lowest at the Sink point. However,
median values are very similar for each vent suggesting a common degassing input linked
to local tectonic features. In fact, all the gas emission points are located along N–S, E–W and
NE–SW oriented active faults controlling the Aeolian Volcanic District. The main
consequence of the presence of high levels of CO
2
in the water chemistry is a generic
acidification of the sea with a reduction in pH. This phenomenon affected both the macro
and the micro biota. Regarding the macro life-forms in particular, extensive damage to the
benthic life-forms was observed; this damage was mainly to the calcareous-shell organisms.
Even though the damage to the benthic life-forms seems to be permanent, there is a general
healing of the ecosystem with the return of some species of fish. Another organism that was
seriously affected by the presence of carbon dioxide is the “Posidonia oceanica” sea-grass.
Once the Posidonia was dead, the available substratum was colonized by other species such
as more resistant algae. Of the studied micro life-forms, the viral abundance was affected by
the presence of the gas vents with a decrease close to the carbon dioxide plumes. From these
results it is possible to hypothesize that viruses can be less tolerant than prokaryotes to the
carbon dioxide chemistry and this can have consequences on the biota equilibrium in the
areas affected by increased levels of CO
2
(Manini et al., 2008).
Fig. 6. Box plots of soil gas CO
2
data from the Panarea vents. The median values are very
similar for each vent suggesting a common degassing input linked to local tectonics.
Another example of toxic emanation study was performed in the Albani Hills area (a
volcano located about 20 km southeast of Rome and extending over an area of about 1500
km) where strong areally diffuse and localised spot degassing processes occur
(Annunziatellis et al., 2003). The main structural features which cause the high degassing
phenomena are buried highs in the carbonate basement which act as gas traps.
Data were processed in order to build risk maps and highlight areas having a potential
health hazard in terms of the short-term risk caused by elevated CO
2
concentrations and the
long-term risk caused by high radon concentrations (Beaubien et al., 2003).
Figs. 7 and 8 show the contour maps of radon and carbon dioxide concentrations in soil gas
calculated using the kriging method and spherical variograms model estimation. In the
surveyed area, the distribution of anomalous radon values (>60 kBq/m
3
) shows a maximum
anisotropy orientation (N340°–350°), which parallels that of the Apennine mountains. This
can be seen both in the western and the eastern sectors along the Appia road (where aligned
effervescent water springs occur). Point anomalies occur around the Consorzio Vigna Fiorita
(from 75 to 250 kBq/m
3
, 1.8–2.4 in log scale), as well as near the village of Cava dei Selci
(>100 kBq/m
3
) where the major gas release occurs. Background values (i.e. in situ
production) occur in the central sector of the area.
Fig. 7. Map of the radon distribution in soil gas. The radon anomalous values (>60 Bq/l, 1.7
in log scale) shows clear linear trends parallel to the Apennine mountains. The anomalies
are located in the western sector where an alignment of sparkling water springs also occur,
and in the eastern sector.
Fig. 8. Map of the carbon dioxide distribution in soil gas. Carbon dioxide concentrations also
show a mild anisotropy along a NW–SE major axis, similar to that of radon. Most of the
anomalous concentrations (up to 80%, 1.9 in log scale) occur as spots in the eastern sector.
Natural Gas194
The distribution of radon anomalies in the Ciampino–Marino districts marks the presence of
high permeability channels (faults and fractures) along which, due to the action of a carrier
gas (such as CO
2
), the short-lived Rn is able to migrate quickly and produce soil gas
anomalies. Furthermore, the orientation of the anomalies accords with the trend of known
structural features, mimicking the general NW–SE trend of the Ciampino high (Di Filippo &
Toro, 1995). The anomalies are spatially continuous along the major NW–SE axis, and their
width of about 1 km emphasises the spatial domain of the faults which border the Ciampino
high structure.
The soil gas CO
2
results (Fig. 8) show a pattern that is similar to that in the radon contour
map. Most of the anomalous concentrations (up to 80%, 1.9 in log scale) occur as spots in the
eastern sector (Cava dei Selci area and the urbanised area of the Consorzio Vigna Fiorita).
The high CO
2
levels in the ground are therefore probably associated with a low enthalpy
geothermal system, either metamorphic reactions involving the carbonate substratum or
magma degassing, corresponding to faults associated with the Ciampino high.
Generally, the high radon concentration in soils causes high radon concentration indoor: as
reported in the literature (Reimer & Gundersen, 1989), indoor radon and soil gas radon
show a linear correlation coefficient of 0.77. For this reason, indoor radon measurements (30
samples) were made, using a Genitron Instruments AlphaGuard Radon monitor in random
selected private and public dwellings and cellars located in the surveyed area (Cava dei
Selci and S. Maria delle Mole villages). Fig. 9 shows a comparison between mean indoor
radon values calculated for cellars, ground and first floors and soil gas concentrations. The
mean values calculated for the three monitored levels highlight the expected trend, in which
cellars show the highest values (in certain sites, measured indoor radon values are
extremely high up to 25 kBq/m
3
). It is worth noting that the mean soil gas concentration
corresponding to the cellar measurements is not the highest. This confirms that enclosed
spaces in contact with the ground are more affected by radon and/or toxic gas
accumulations.
Fig. 9. The bar chart shows the comparison between the radon indoor mean values at
different levels (cellars, ground levels and first floor) with the radon concentrations
measured in the soil gas samples at the same sites. Numbers in the bars indicate the radon
values in Bq/m
3
. The figure highlights that cellars show the highest radon values (up to
25,000 Bq/m
3
).
4.3 Radionuclide migration
Two different examples of the study of radionuclide migration will be discussed. The first
one regards the study of soil gas distributions in clays altered by heating, based on findings
at Orciatico site of natural analogue of nuclear waste disposal. The second example is
related to the presence of an abandoned uranium mine in proximity of the main natural
water resource of Kyrgyzstan (central Asia).
The physical properties of thermally altered clays of the Orciatico area (Tuscany, Central Italy)
were studied as argillaceous formations could act as geological barriers to radionuclide
migration in high-level radioactive-waste isolation systems. Though available data do not
allow exact evaluations of depth, many features of the Orciatico igneous body (widespread
glass, highly vesicular peripheral facies etc.) point to a shallow emplacement, comparable with
that reasonably forecast for a repository. Not even exact definitions of the temperature of
magma at the moment of emplacement are feasible. Only some evaluations can be proposed:
from its distinctly femic composition temperatures over 800 °C may be assumed for the
alkalitrachytic magma intrusion (Leoni et al., 1984; Hueckel & Pellegrini, 2002). These values
are much higher than those expected around a radiowaste container (up to 300°C, according to
Dayal & Wilke, 1982); therefore, as to the thermal aspects the Orciatico magmatic body and its
metamorphic aureole must be regarded as an extreme condition model of a radiowaste
repository and probably it can be mainly used to demonstrate a worst case. The study was
performed through detailed soil gas surveys in order to define the gas permeability of the clay
unit (Voltattorni et al., 2010). A total of 1086 soil gas samples was collected in the Orciatico
area. A first survey was performed collecting 486 samples along a regular grid near the village
of Orciatico with a sampling density of about 500 samples/km
2
. After that, monthly surveys
(from April to September 1998) were performed to monitor possible variations of soil gas
concentration due to weather conditions.
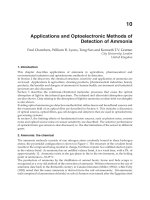
Fig. 10. Carbon dioxide (to the right) and radon (to the left) distributions in soil gases.
Anomalous values (CO
2
>2 %,v/v, Rn >25 Bq/l) are in correspondence of the boundary of
the resistive complex supposed on geoelectrical results.
The radon, as well as the CO
2
contour line maps, figure 10, show that highest values (
222
Rn>
25 Bq/l, CO
2
>2 %,v/v ) occur in the south-western part of the studied area (characterized by
the presence of the igneous body outcrop named Selagite) and along a narrow belt, with
direction NNW-SSE, where metamorphosed clays (named Termantite) are present.
Soil gas geochemistry: signicance and application in geological prospectings 195
The distribution of radon anomalies in the Ciampino–Marino districts marks the presence of
high permeability channels (faults and fractures) along which, due to the action of a carrier
gas (such as CO
2
), the short-lived Rn is able to migrate quickly and produce soil gas
anomalies. Furthermore, the orientation of the anomalies accords with the trend of known
structural features, mimicking the general NW–SE trend of the Ciampino high (Di Filippo &
Toro, 1995). The anomalies are spatially continuous along the major NW–SE axis, and their
width of about 1 km emphasises the spatial domain of the faults which border the Ciampino
high structure.
The soil gas CO
2
results (Fig. 8) show a pattern that is similar to that in the radon contour
map. Most of the anomalous concentrations (up to 80%, 1.9 in log scale) occur as spots in the
eastern sector (Cava dei Selci area and the urbanised area of the Consorzio Vigna Fiorita).
The high CO
2
levels in the ground are therefore probably associated with a low enthalpy
geothermal system, either metamorphic reactions involving the carbonate substratum or
magma degassing, corresponding to faults associated with the Ciampino high.
Generally, the high radon concentration in soils causes high radon concentration indoor: as
reported in the literature (Reimer & Gundersen, 1989), indoor radon and soil gas radon
show a linear correlation coefficient of 0.77. For this reason, indoor radon measurements (30
samples) were made, using a Genitron Instruments AlphaGuard Radon monitor in random
selected private and public dwellings and cellars located in the surveyed area (Cava dei
Selci and S. Maria delle Mole villages). Fig. 9 shows a comparison between mean indoor
radon values calculated for cellars, ground and first floors and soil gas concentrations. The
mean values calculated for the three monitored levels highlight the expected trend, in which
cellars show the highest values (in certain sites, measured indoor radon values are
extremely high up to 25 kBq/m
3
). It is worth noting that the mean soil gas concentration
corresponding to the cellar measurements is not the highest. This confirms that enclosed
spaces in contact with the ground are more affected by radon and/or toxic gas
accumulations.
Fig. 9. The bar chart shows the comparison between the radon indoor mean values at
different levels (cellars, ground levels and first floor) with the radon concentrations
measured in the soil gas samples at the same sites. Numbers in the bars indicate the radon
values in Bq/m
3
. The figure highlights that cellars show the highest radon values (up to
25,000 Bq/m
3
).
4.3 Radionuclide migration
Two different examples of the study of radionuclide migration will be discussed. The first
one regards the study of soil gas distributions in clays altered by heating, based on findings
at Orciatico site of natural analogue of nuclear waste disposal. The second example is
related to the presence of an abandoned uranium mine in proximity of the main natural
water resource of Kyrgyzstan (central Asia).
The physical properties of thermally altered clays of the Orciatico area (Tuscany, Central Italy)
were studied as argillaceous formations could act as geological barriers to radionuclide
migration in high-level radioactive-waste isolation systems. Though available data do not
allow exact evaluations of depth, many features of the Orciatico igneous body (widespread
glass, highly vesicular peripheral facies etc.) point to a shallow emplacement, comparable with
that reasonably forecast for a repository. Not even exact definitions of the temperature of
magma at the moment of emplacement are feasible. Only some evaluations can be proposed:
from its distinctly femic composition temperatures over 800 °C may be assumed for the
alkalitrachytic magma intrusion (Leoni et al., 1984; Hueckel & Pellegrini, 2002). These values
are much higher than those expected around a radiowaste container (up to 300°C, according to
Dayal & Wilke, 1982); therefore, as to the thermal aspects the Orciatico magmatic body and its
metamorphic aureole must be regarded as an extreme condition model of a radiowaste
repository and probably it can be mainly used to demonstrate a worst case. The study was
performed through detailed soil gas surveys in order to define the gas permeability of the clay
unit (Voltattorni et al., 2010). A total of 1086 soil gas samples was collected in the Orciatico
area. A first survey was performed collecting 486 samples along a regular grid near the village
of Orciatico with a sampling density of about 500 samples/km
2
. After that, monthly surveys
(from April to September 1998) were performed to monitor possible variations of soil gas
concentration due to weather conditions.
Fig. 10. Carbon dioxide (to the right) and radon (to the left) distributions in soil gases.
Anomalous values (CO
2
>2 %,v/v, Rn >25 Bq/l) are in correspondence of the boundary of
the resistive complex supposed on geoelectrical results.
The radon, as well as the CO
2
contour line maps, figure 10, show that highest values (
222
Rn>
25 Bq/l, CO
2
>2 %,v/v ) occur in the south-western part of the studied area (characterized by
the presence of the igneous body outcrop named Selagite) and along a narrow belt, with
direction NNW-SSE, where metamorphosed clays (named Termantite) are present.
Natural Gas196
Furthermore, anomalous values occur in unaltered clays especially in correspondence of the
boundary of the resistive complex supposed on previous geoelectrical results (Voltattorni et
al., 2010). All over the north-eastern sector, in non metamorphosed clays, radon and carbon
dioxide values are very similar to background values reported in literature (Rn: 10-15 Bq/ l,
CO
2
: 0.5 %,v/v).
As radon and carbon dioxide values seem to decrease gradually from Selagite outcrop
towards un-metamorphosed clays, soil gas data set were projected along one longitudinal
lines coinciding with a performed geoelectrical profile. Figure 11 shows polynomial
regression (3
rd
degree) of radon and carbon dioxide values plotted against the distance from
a reference point. Graphs highlight a slight decreasing trend of radon soil gas values
(continuous line) towards the NE, from Selagite outcrop until un-metamorphosed clays.
Fig. 11. Comparison between polynomial regression (3° degree) map and geoelectrical
profile. Radon graph (continuous line) highlights a general slightly decreasing trend of soil
gas values towards the NE, from Selagite outcrop until un-metamorphosed clays. The same
behaviour is well evident also for CO
2
polynomial regression (dashed line). Values slightly
rise towards un-metamorphosed clays, indicating the presence of structural discontinuities
not visible at the surface.
The same behaviour is well evident also for CO
2
polynomial regression (dashed line): the
overlapping peaks in the radon-carbon dioxide plots should confirm that the soil gas
distribution is linked to clay alteration degree. In fact, highest CO
2
and Rn values were
found between Selagite outcrop and the first resistive limit, in a narrow belt characterized
by a high alteration degree and, probably, by an intense shallow fracturing (Gregory &
Durrance, 1985). On the other hand, after the second resistive limit, where clays did not
undergo the effects of the intrusive body, radon and carbon dioxide values are in agreement
with the mean values reported in literature excepting in the last 200m of the profile where
values slightly increase again.
The results of this study provided specific information about soil gas permeability on the
Orciatico clay units characterized by different degrees of thermal alteration. This research
represents the first study performed in thermally and mechanically altered clays and results
demonstrated that the method gives interesting information also in clays that apparently
did not undergo to mineral and geotechnical variations. Radon and carbon dioxide soil gas
anomalies are mostly concentrated in zones where the Selagite and thermally altered clays
are present. Soil gas distributions are interpreted as being due to intense shallow fracturing
of clays along the inferred Selagite boundary: the volcanic intrusion caused thermo-hydro-
chemical and thermo-hydro-mechanical stress and contact metamorphism in the clay. Far
from Selagite, clays apparently prevent the rising of gases. In fact, small soil gas anomalies
were found over the estimated intact Pliocenic clays having permeability due to structural
discontinuities not visible at the surface. This study allowed to highlight the role of soil gas
technique for the identification of secondary permeability in a clay sequence: clay can
strongly modify its characteristics (i.e., reduction of the properties of isolation and sealing
material) when affected by even very low thermal alteration although this effect is not
visible through traditional investigative methods. The results of this study suggest a review
of the role of clays as geological barrier for the permanent isolation of long-lived toxic
residues in the radioactive-waste isolation framework.
0 0.005 0.01 0.015 0.02
0
1000
2000
3000
Radon (Bq/L)
0 0.005 0.01 0.015 0.02
Distance (km)
0
2
4
6
Carbon dioxide (%, v/v)
NNW SSE
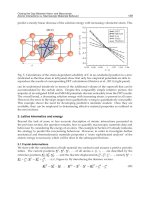
Fig. 12. Radon and carbon dioxide profiles at Djilubulak valley (Kyrgyzstan, central Asia).
Graphs highlight a slightly decreasing trend of radon and carbon dioxide soil gas values
towards the north, from the waste until the lake.
A different study of radionuclide migration was performed in the Djilubulak ephemeral
stream valley on the southern shore of Issyk-Kul (Kyrgyzstan, central Asia), one of the
largest and most pristine lakes in the world (Gavshin et al., 2002). The tail storages from the
Soil gas geochemistry: signicance and application in geological prospectings 197
Furthermore, anomalous values occur in unaltered clays especially in correspondence of the
boundary of the resistive complex supposed on previous geoelectrical results (Voltattorni et
al., 2010). All over the north-eastern sector, in non metamorphosed clays, radon and carbon
dioxide values are very similar to background values reported in literature (Rn: 10-15 Bq/ l,
CO
2
: 0.5 %,v/v).
As radon and carbon dioxide values seem to decrease gradually from Selagite outcrop
towards un-metamorphosed clays, soil gas data set were projected along one longitudinal
lines coinciding with a performed geoelectrical profile. Figure 11 shows polynomial
regression (3
rd
degree) of radon and carbon dioxide values plotted against the distance from
a reference point. Graphs highlight a slight decreasing trend of radon soil gas values
(continuous line) towards the NE, from Selagite outcrop until un-metamorphosed clays.
Fig. 11. Comparison between polynomial regression (3° degree) map and geoelectrical
profile. Radon graph (continuous line) highlights a general slightly decreasing trend of soil
gas values towards the NE, from Selagite outcrop until un-metamorphosed clays. The same
behaviour is well evident also for CO
2
polynomial regression (dashed line). Values slightly
rise towards un-metamorphosed clays, indicating the presence of structural discontinuities
not visible at the surface.
The same behaviour is well evident also for CO
2
polynomial regression (dashed line): the
overlapping peaks in the radon-carbon dioxide plots should confirm that the soil gas
distribution is linked to clay alteration degree. In fact, highest CO
2
and Rn values were
found between Selagite outcrop and the first resistive limit, in a narrow belt characterized
by a high alteration degree and, probably, by an intense shallow fracturing (Gregory &
Durrance, 1985). On the other hand, after the second resistive limit, where clays did not
undergo the effects of the intrusive body, radon and carbon dioxide values are in agreement
with the mean values reported in literature excepting in the last 200m of the profile where
values slightly increase again.
The results of this study provided specific information about soil gas permeability on the
Orciatico clay units characterized by different degrees of thermal alteration. This research
represents the first study performed in thermally and mechanically altered clays and results
demonstrated that the method gives interesting information also in clays that apparently
did not undergo to mineral and geotechnical variations. Radon and carbon dioxide soil gas
anomalies are mostly concentrated in zones where the Selagite and thermally altered clays
are present. Soil gas distributions are interpreted as being due to intense shallow fracturing
of clays along the inferred Selagite boundary: the volcanic intrusion caused thermo-hydro-
chemical and thermo-hydro-mechanical stress and contact metamorphism in the clay. Far
from Selagite, clays apparently prevent the rising of gases. In fact, small soil gas anomalies
were found over the estimated intact Pliocenic clays having permeability due to structural
discontinuities not visible at the surface. This study allowed to highlight the role of soil gas
technique for the identification of secondary permeability in a clay sequence: clay can
strongly modify its characteristics (i.e., reduction of the properties of isolation and sealing
material) when affected by even very low thermal alteration although this effect is not
visible through traditional investigative methods. The results of this study suggest a review
of the role of clays as geological barrier for the permanent isolation of long-lived toxic
residues in the radioactive-waste isolation framework.
0 0.005 0.01 0.015 0.02
0
1000
2000
3000
Radon (Bq/L)
0 0.005 0.01 0.015 0.02
Distance (km)
0
2
4
6
Carbon dioxide (%, v/v)
NNW SSE
Fig. 12. Radon and carbon dioxide profiles at Djilubulak valley (Kyrgyzstan, central Asia).
Graphs highlight a slightly decreasing trend of radon and carbon dioxide soil gas values
towards the north, from the waste until the lake.
A different study of radionuclide migration was performed in the Djilubulak ephemeral
stream valley on the southern shore of Issyk-Kul (Kyrgyzstan, central Asia), one of the
largest and most pristine lakes in the world (Gavshin et al., 2002). The tail storages from the
Natural Gas198
past mining may pose a pollution hazard to the lake water and sediments. A chain of six
protective pools interconnected by drain pipes descend from the abandoned mine and
processing plant down the Djilubulak stream valley. To assess the effectiveness of these
catch pools and the scale of pollution risk, a soil gas survey was performed from the
abandoned mine to the shore of the lake (Giralt et al., 2003; Voltattorni et al., 2004).
In the river bed the soil gas survey was done performing measurements following both
profiles perpendicular to the river flow and random distribution. The profiles were carried
out approximately every 200 m. In each profile, the measurements were made roughly every
30-40 m. A total of 130 soil gas samples were collected sampling at the lower part of the river
valley (close to the lake shore), along the river valley and at the waste.
The highest radon values (>40 Bq/ l) occur in the south-eastern part of the studied area
characterised by the presence of the waste. All over the northern sector radon values are
very similar to background values reported in literature (10-15 Bq/ l). The CO
2
soil gas
distribution shows a greater concentration of anomalous values (> 3%) all over the mine and
the waste area. Hypotheses about biogenic and/or thermogenic origin of this gas require
isotope analysis. In spite of this, it is reasonable suppose that mine ruins and coal remains
influenced soil gas distribution as highest values are present all over the waste and there is a
good correspondence between high radon and carbon dioxide values. Fig 12 shows two
profiles along which results were projected considering a longitudinal line intersecting the
valley. Graphs highlight a slightly decreasing trend of radon and carbon dioxide soil gas
values towards the north, from the waste until the lake. The overlapping peaks in the Rn
and CO
2
plots imply that the soil gas distribution is linked to the presence of radioactive
material in the waste. In fact, highest CO
2
and Rn values were found in the same area. On
the other hand, outside the “contaminated” area, where soil did not undergo the effects of
the mine activities, radon and carbon dioxide values are in agreement with the mean values
reported in literature (Voltattorni et al., 2004).
Soil gas results, therefore, suggest that there has not been a significant down-stream
migration of radiogenic particles or elements, either via mass transport during flooding
events or via groundwater movement. However, it is worth noting that in case of a
catastrophic event such as an intensive flash flood, the deposits of Kadji-Sai could be eroded
and distributed in the Djilubulak valley and may reach the shores of Issyk-Kul Lake
(Gavshin et al., 2002). These contaminants would then produce high local levels of
radioactivity in any area they reach. In the worst case scenario, the exposure rates in the
Djilubulak valley and at its confluence with Issyk-Kul Lake may reach values which exceed
not only safe exposure rates for general public but even long-term occupational exposure
limits. The total amount of radioactive deposits currently at the site would not pose danger
to the entire Issyk-Kul Lake and areas further than 10–15 km from the site.
5. Conclusion
The limitation of soil gas investigations lies in weaker crustal gas concentrations in cases of
thick sedimentary cover, and in high level of atmospheric dilution in soils (Baubron et al.,
2002). However, on the basis of the many achieved results, it can be said that soil gas
prospection constitutes a powerful tool to identify complex phenomena occurring within the
crust.
The comprehensive approach followed in this study has provided insights on the spatial
influence of tectonic discontinuities and geology on gas migration toward the surface. Soil
gas measurements, performed at different scales, involved two gaseous species with very
different geochemical behaviour. Soil gas surveys yielded different features of the
anomalies, reflecting the different gas bearing these properties of the pathways along which
gases can migrate.
The association of the two proposed gas species, radon and carbon dioxide, is considered
fundamental in the study of gas migration as CO
2
often acts as carrier in transporting the
radon trace gas: this mechanism for surface soil gas anomalies is due to advection as
suggested by relatively high rate of migration needed to obtain anomalies of short-life
222
Rn
in the soil pores.
As soil gas distribution can be affected by some phenomena related to the climatic factors,
soil moisture and gas behaviour (mobility, solubility and reactivity), a multivariate study
including a large number of gaseous species has been considered.
However, independent from gas origin, all the results show that gases migrate preferentially
through zones of brittle deformation and enhanced permeability. In order to quantify the
spatial influence of fault geometry and geochemical properties on the distribution of soil
gases, the geostatistical approach (i.e., variograms) is necessary.
Because of the very high variability of gas concentrations at the surface, soil gas prospection
appears necessary in order to select potential optimum sites for surveillance to identify, for
example, regional changes of strain fields or variations in toxic emanation. Due to the
complex relationship between geology and local phenomena, a network of geochemical
stations would be much more useful.
It is hoped that the present study has brought attention to the problems associated with
natural gas migration and that there is more awareness of how the soil gas method can be
used in these situations, both to plan land-use zoning or to resolve health problems in
existing residential areas dealing with the danger of natural toxic gases. In the case of the
former, areas defined as high risk can be zoned for agricultural or parkland use and not for
residential development, while for the latter modifications can be made on ‘high-risk’
existing homes or monitoring stations can be installed to improve safety.
Communication of these results to the local government can result in heightened awareness
and the initiation of some preventive programmes, such as the development of a continuous
monitoring station.
6. References
Amato, A.; Margheriti, L.; Azzara, R.M.; Basili, A.; Chiarabba, C.; Ciaccio, M.G.; Cimini,
G.B.; Di Bona, M.; Frepoli, A.; Lucente, F.P.; Nostro, C. & Selvaggi, G. (1998).
Passive Seismology and Deep Structure in Central Italy. Pure and Applied
Geophysics, Special Issue: Geodynamics of the Lithosphere and the Earth’s Mantle,
151, 479-493.
Aubert, M. & Baubron, J.C. (1988). Identification of a hidden thermal fissure in a volcanic
terrain using a combination of hydrothermal convection indicators and soil
atmospheres analysis. J. Volcanol. Geotherm. Res., 35, 217–225.
Soil gas geochemistry: signicance and application in geological prospectings 199
past mining may pose a pollution hazard to the lake water and sediments. A chain of six
protective pools interconnected by drain pipes descend from the abandoned mine and
processing plant down the Djilubulak stream valley. To assess the effectiveness of these
catch pools and the scale of pollution risk, a soil gas survey was performed from the
abandoned mine to the shore of the lake (Giralt et al., 2003; Voltattorni et al., 2004).
In the river bed the soil gas survey was done performing measurements following both
profiles perpendicular to the river flow and random distribution. The profiles were carried
out approximately every 200 m. In each profile, the measurements were made roughly every
30-40 m. A total of 130 soil gas samples were collected sampling at the lower part of the river
valley (close to the lake shore), along the river valley and at the waste.
The highest radon values (>40 Bq/ l) occur in the south-eastern part of the studied area
characterised by the presence of the waste. All over the northern sector radon values are
very similar to background values reported in literature (10-15 Bq/ l). The CO
2
soil gas
distribution shows a greater concentration of anomalous values (> 3%) all over the mine and
the waste area. Hypotheses about biogenic and/or thermogenic origin of this gas require
isotope analysis. In spite of this, it is reasonable suppose that mine ruins and coal remains
influenced soil gas distribution as highest values are present all over the waste and there is a
good correspondence between high radon and carbon dioxide values. Fig 12 shows two
profiles along which results were projected considering a longitudinal line intersecting the
valley. Graphs highlight a slightly decreasing trend of radon and carbon dioxide soil gas
values towards the north, from the waste until the lake. The overlapping peaks in the Rn
and CO
2
plots imply that the soil gas distribution is linked to the presence of radioactive
material in the waste. In fact, highest CO
2
and Rn values were found in the same area. On
the other hand, outside the “contaminated” area, where soil did not undergo the effects of
the mine activities, radon and carbon dioxide values are in agreement with the mean values
reported in literature (Voltattorni et al., 2004).
Soil gas results, therefore, suggest that there has not been a significant down-stream
migration of radiogenic particles or elements, either via mass transport during flooding
events or via groundwater movement. However, it is worth noting that in case of a
catastrophic event such as an intensive flash flood, the deposits of Kadji-Sai could be eroded
and distributed in the Djilubulak valley and may reach the shores of Issyk-Kul Lake
(Gavshin et al., 2002). These contaminants would then produce high local levels of
radioactivity in any area they reach. In the worst case scenario, the exposure rates in the
Djilubulak valley and at its confluence with Issyk-Kul Lake may reach values which exceed
not only safe exposure rates for general public but even long-term occupational exposure
limits. The total amount of radioactive deposits currently at the site would not pose danger
to the entire Issyk-Kul Lake and areas further than 10–15 km from the site.
5. Conclusion
The limitation of soil gas investigations lies in weaker crustal gas concentrations in cases of
thick sedimentary cover, and in high level of atmospheric dilution in soils (Baubron et al.,
2002). However, on the basis of the many achieved results, it can be said that soil gas
prospection constitutes a powerful tool to identify complex phenomena occurring within the
crust.
The comprehensive approach followed in this study has provided insights on the spatial
influence of tectonic discontinuities and geology on gas migration toward the surface. Soil
gas measurements, performed at different scales, involved two gaseous species with very
different geochemical behaviour. Soil gas surveys yielded different features of the
anomalies, reflecting the different gas bearing these properties of the pathways along which
gases can migrate.
The association of the two proposed gas species, radon and carbon dioxide, is considered
fundamental in the study of gas migration as CO
2
often acts as carrier in transporting the
radon trace gas: this mechanism for surface soil gas anomalies is due to advection as
suggested by relatively high rate of migration needed to obtain anomalies of short-life
222
Rn
in the soil pores.
As soil gas distribution can be affected by some phenomena related to the climatic factors,
soil moisture and gas behaviour (mobility, solubility and reactivity), a multivariate study
including a large number of gaseous species has been considered.
However, independent from gas origin, all the results show that gases migrate preferentially
through zones of brittle deformation and enhanced permeability. In order to quantify the
spatial influence of fault geometry and geochemical properties on the distribution of soil
gases, the geostatistical approach (i.e., variograms) is necessary.
Because of the very high variability of gas concentrations at the surface, soil gas prospection
appears necessary in order to select potential optimum sites for surveillance to identify, for
example, regional changes of strain fields or variations in toxic emanation. Due to the
complex relationship between geology and local phenomena, a network of geochemical
stations would be much more useful.
It is hoped that the present study has brought attention to the problems associated with
natural gas migration and that there is more awareness of how the soil gas method can be
used in these situations, both to plan land-use zoning or to resolve health problems in
existing residential areas dealing with the danger of natural toxic gases. In the case of the
former, areas defined as high risk can be zoned for agricultural or parkland use and not for
residential development, while for the latter modifications can be made on ‘high-risk’
existing homes or monitoring stations can be installed to improve safety.
Communication of these results to the local government can result in heightened awareness
and the initiation of some preventive programmes, such as the development of a continuous
monitoring station.
6. References
Amato, A.; Margheriti, L.; Azzara, R.M.; Basili, A.; Chiarabba, C.; Ciaccio, M.G.; Cimini,
G.B.; Di Bona, M.; Frepoli, A.; Lucente, F.P.; Nostro, C. & Selvaggi, G. (1998).
Passive Seismology and Deep Structure in Central Italy. Pure and Applied
Geophysics, Special Issue: Geodynamics of the Lithosphere and the Earth’s Mantle,
151, 479-493.
Aubert, M. & Baubron, J.C. (1988). Identification of a hidden thermal fissure in a volcanic
terrain using a combination of hydrothermal convection indicators and soil
atmospheres analysis. J. Volcanol. Geotherm. Res., 35, 217–225.
Natural Gas200
Annunziatellis, A.; Ciotoli, G.; Lombardi, S. & Nolasco, F. (2003). Short- and long-term gas
hazard: the release of toxic gases in the Albani Hills volcanic area (central Italy).
Journal of Geochemical Exploration 77, 93-108.
Ball, T.K.; Cameron, D.G.; Colman, T.B. & Roberts, P.D. (1991). Behavior of radon in the
geological environment: a review. Q. J. Eng. Geol., 24, 169-182.
Baubron, J.C.; Allard, P. & Toutain, J.P. (1990). Diffuse volcanic emissions of carbon dioxide
from Vulcano Island, Italy. Nature, 344, 51–53.
Baubron, J.C.; Allard, P.; Sabroux, J.C.; Tedesco, D. & Toutain, J.P. (1991). Soil gas
emanations as precursory indicators of volcanic eruptions. J. Geol. Soc. London, 148,
571–576.
Baubron, J. C.; Rigo, A. & Toutain, J. P. (2002). Soil gas profiles as a tool to characterize
active tectonic areas: the Jaut Pass example (Pyrenees, France). Earth and Planetary
Science Lett., 196, 69-81.
Beaubien; S.L.; Ciotoli, G. & Lombardi, S. (2002). Carbon dioxide and radon gas hazard in
the Alban Hills area (central Italy). Journal of Volcanology and Geothermal Research,
123, 63-80
Blumetti, A.M.; Michetti, A.M. & Serva, L. (1988). The ground effects of the Fucino
earthquake of Jan. 13
th
, 1915: an attempt for the understanding of recent geological
evolution of some tectonic structure. In: Historical Seismicity of Central Eastern
Mediterranean Region. C. Margottini and L. Serva Eds., 297-319. Nuove Tecnologie,
l’Energie e l’Ambiente, Rome.
Blumetti A, .M.; Dramisa, F. & Michetti, A.M. (1993). Fault-generated mountain fronts in the
Central Apennines (CentraI ltaly): Geomorphological features and seismotectonic
implication. Earth Surf. Processes Landforms, 18, 203-223.
Capaccioni, B.; Tassi, F.; Vaselli, O. & Tedesco, D. (2007). Submarine gas burst at Panarea
Island (southern Italy) on 3 November 2002: A magmatic versus hydrothermal
episode. J. Geophys. Res., 112, B05201. doi:10.1029/2006JB0044359.
Charlet, J.M.; Doremus, P. & Quinif, Y. (1995). Radon methods used to discover uranium
mineralizations in the lower Devonian of the Ardenne Massif (Belgium). In: Gas
Geochemistry, C. Dubois Ed., Science Reviews, Northwood, 1–18.
Cox, M.E. (1980). Ground radon survey of an hawaiian geothermal area. Geophys. Res. Lett.,
7, 283–286.
Caramanna, G.; Voltattorni, N.; Caramanna, L.; Cinti, D.; Galli, G.; Pizzino, L. & Quattrocchi,
F. (2005). Scientific diving techniques applied to the geomorphological and
geochemical study of some submarine volcanic gas vents (Aeolian Islands,
southern Tyrrhenian sea, Italy). Proc. 24
th
Diving for Science Symp. American Academy
of Underwater sciences 11-12 March 2005 – Mystic – Connecticut (USA).
Ciotoli, G.; Guerra, M.; Lombardi, S. & Vittori, E. (1998). Soil gas survey for tracing
seismogenic faults: a case-study the Fucino basin (central Italy). J. Geophys. Res.,
103B, 23781- 23794.
Ciotoli, G.; Etiope, G.; Guerra, M. & Lombardi, S. (1999). The detection of concealed faults in
the Ofanto basin using the correlation between soil gas fracture surveys.
Tectonophysics, 299 (3–4), 321–332.
Ciotoli, G.; Lombardi, S. & Annunziatellis, A. (2007). Geostatistical analysis of soil gas data
in a high seismic intermontane basin: Fucino Plain, central Italy. J. Geophys. Res.,
112, B05407, doi:10.1029/2005JB004044.
Cocco, M.; Nostro, C. & Ekström, G. (2000). Static stress changes and fault interaction
during the 1997 Umbria-Marche earthquake sequence. J. of Seism., 4, N. 4, 501-516.
Crenshaw, W.B. ; Williams, S.N. & Stoiber, R.E. (1982). Fault location by radon and mercury
detection at an active volcano in Nicaragua. Nature, 300, 345–346.
Dayal, R. & Wilke, R.J. (1982). Role of clay minerals as backfill in radioactive waste disposal.
Proc. Int. Clay Conf. Bologna/Pavia, 1981, pp. 771 787.
D’Amore, F. ; Sabroux, J.C. & Zettwoog, P. (1978). Determination of characteristics of steam
reservoirs by radon-222 measurements in geothermal fluids. Pure Appl. Geophys.,
117, 253–261.
Del Pezzo, E. ; Gasparini, P. ; Mantovani, M.M. ; Martini, M. ; Capaldi, G. ; Gomes, Y.T. &
Pece, R. (1981). A case of correlation between Rn-222 anomalies and seismic activity
on a volcano (Vulcano island, southern Thyrrenian Sea). Geophys. Res. Lett., 8, 962–
965.
De Gregorio, S.; Diliberto, I.S.; Giammanco, S.; Gurrieri, S. & Valenza, M. (2002). Tectonic
control over large-scale diffuse degassing in Eastern Sicily (Italy). Geofluids, 2, 273–
284.
Di Filippo, M. & Toro, B. (1995). Gravity features. In: The Volcano of the Alban Hills, R. Trigila
Ed. , 283 pp.
Dubois, C.; Alvarez Calleja, A.; Bassot, S. & Chambaudet, A. (1995). Modelling the 3-
dimensional microfissure network in quartz in a thin section of granite. In: Gas
Geochemistry, C. Dubois Ed., Science Reviews, Northwood, pp. 357-368.
Duddridge, G. A.; Grainger, P. & Durrance, E. M. (1991). Fault detection using soil gas
geochemistry, Q. J. Eng. Geol., 24, 427-435.
Durrance, E. M. & Gregory, R .G. (1988). Fracture mapping in clays: Soil gas surveys at
Down Ampney, Gloucestershire. DOE Report: DOE/RW/88081, Dep. Of Energy,
Washington D.C.
Eremeev, A. N.; Sokolov, V.A. & Solovov, A.P. (1973). Application of helium surveying to
structural mapping and ore deposit forecasting. In: Geochemical Exploration, 1972, M.
J. Jones Ed., pp.183– 192, Inst. of Min. and Metall., London.
Etiope, G. & Lombardi, S. (1995). Soil gases as fault tracers in clay basins: a case history in
the Siena Basin (Central Italy). In: Gas Geochemistry, C. Dubois Ed., 19–29, Science
Reviews, Northwood.
Fleischer, R.L. ; Alter, H.W. ; Furnam, S.C. ; Price, P.B. & Walker, R.M. (1972). Particle track
etching. Science, 178, 255–263.
Fleischer, R.L. & Magro-Campero, A. (1985). Association of subsurface radon changes in
Alaska and the northeastern United States with earthquakes. Geochim. Cosmochim.
Acta, 49, 1061–1071.
Galadini, F. & Messina, P. (1994). Plio-Quatenary tectonics of the Fucino basin and
surrounding areas (CentraI ltaly), J. Geol.,5, 6(2), 73-99.
Gascoyne, M. ; Wuschke, D.M. & Durrance, E.M. (1993). Fracture detection and
groundwater flow characterization using He and Rn in soil gases, Manitoba,
Canada. Appl. Geochem., 8, 223– 233.
Gavshin, V.M.; Melgunov, M.S.; Sukhorukov, F.V.; Bobrov, V.A.; Kalugin, I.A. & Klerkx, J.
(2002). Disequilibrium between uranium and its progeny in the Lake Issyk-Kul
system (Kyrgyzstan) under a combined effect of natural and manmade processes.
J.Env. Radioact., 83, 1, 61-84.
Soil gas geochemistry: signicance and application in geological prospectings 201
Annunziatellis, A.; Ciotoli, G.; Lombardi, S. & Nolasco, F. (2003). Short- and long-term gas
hazard: the release of toxic gases in the Albani Hills volcanic area (central Italy).
Journal of Geochemical Exploration 77, 93-108.
Ball, T.K.; Cameron, D.G.; Colman, T.B. & Roberts, P.D. (1991). Behavior of radon in the
geological environment: a review. Q. J. Eng. Geol., 24, 169-182.
Baubron, J.C.; Allard, P. & Toutain, J.P. (1990). Diffuse volcanic emissions of carbon dioxide
from Vulcano Island, Italy. Nature, 344, 51–53.
Baubron, J.C.; Allard, P.; Sabroux, J.C.; Tedesco, D. & Toutain, J.P. (1991). Soil gas
emanations as precursory indicators of volcanic eruptions. J. Geol. Soc. London, 148,
571–576.
Baubron, J. C.; Rigo, A. & Toutain, J. P. (2002). Soil gas profiles as a tool to characterize
active tectonic areas: the Jaut Pass example (Pyrenees, France). Earth and Planetary
Science Lett., 196, 69-81.
Beaubien; S.L.; Ciotoli, G. & Lombardi, S. (2002). Carbon dioxide and radon gas hazard in
the Alban Hills area (central Italy). Journal of Volcanology and Geothermal Research,
123, 63-80
Blumetti, A.M.; Michetti, A.M. & Serva, L. (1988). The ground effects of the Fucino
earthquake of Jan. 13
th
, 1915: an attempt for the understanding of recent geological
evolution of some tectonic structure. In: Historical Seismicity of Central Eastern
Mediterranean Region. C. Margottini and L. Serva Eds., 297-319. Nuove Tecnologie,
l’Energie e l’Ambiente, Rome.
Blumetti A, .M.; Dramisa, F. & Michetti, A.M. (1993). Fault-generated mountain fronts in the
Central Apennines (CentraI ltaly): Geomorphological features and seismotectonic
implication. Earth Surf. Processes Landforms, 18, 203-223.
Capaccioni, B.; Tassi, F.; Vaselli, O. & Tedesco, D. (2007). Submarine gas burst at Panarea
Island (southern Italy) on 3 November 2002: A magmatic versus hydrothermal
episode. J. Geophys. Res., 112, B05201. doi:10.1029/2006JB0044359.
Charlet, J.M.; Doremus, P. & Quinif, Y. (1995). Radon methods used to discover uranium
mineralizations in the lower Devonian of the Ardenne Massif (Belgium). In: Gas
Geochemistry, C. Dubois Ed., Science Reviews, Northwood, 1–18.
Cox, M.E. (1980). Ground radon survey of an hawaiian geothermal area. Geophys. Res. Lett.,
7, 283–286.
Caramanna, G.; Voltattorni, N.; Caramanna, L.; Cinti, D.; Galli, G.; Pizzino, L. & Quattrocchi,
F. (2005). Scientific diving techniques applied to the geomorphological and
geochemical study of some submarine volcanic gas vents (Aeolian Islands,
southern Tyrrhenian sea, Italy). Proc. 24
th
Diving for Science Symp. American Academy
of Underwater sciences 11-12 March 2005 – Mystic – Connecticut (USA).
Ciotoli, G.; Guerra, M.; Lombardi, S. & Vittori, E. (1998). Soil gas survey for tracing
seismogenic faults: a case-study the Fucino basin (central Italy). J. Geophys. Res.,
103B, 23781- 23794.
Ciotoli, G.; Etiope, G.; Guerra, M. & Lombardi, S. (1999). The detection of concealed faults in
the Ofanto basin using the correlation between soil gas fracture surveys.
Tectonophysics, 299 (3–4), 321–332.
Ciotoli, G.; Lombardi, S. & Annunziatellis, A. (2007). Geostatistical analysis of soil gas data
in a high seismic intermontane basin: Fucino Plain, central Italy. J. Geophys. Res.,
112, B05407, doi:10.1029/2005JB004044.
Cocco, M.; Nostro, C. & Ekström, G. (2000). Static stress changes and fault interaction
during the 1997 Umbria-Marche earthquake sequence. J. of Seism., 4, N. 4, 501-516.
Crenshaw, W.B. ; Williams, S.N. & Stoiber, R.E. (1982). Fault location by radon and mercury
detection at an active volcano in Nicaragua. Nature, 300, 345–346.
Dayal, R. & Wilke, R.J. (1982). Role of clay minerals as backfill in radioactive waste disposal.
Proc. Int. Clay Conf. Bologna/Pavia, 1981, pp. 771 787.
D’Amore, F. ; Sabroux, J.C. & Zettwoog, P. (1978). Determination of characteristics of steam
reservoirs by radon-222 measurements in geothermal fluids. Pure Appl. Geophys.,
117, 253–261.
Del Pezzo, E. ; Gasparini, P. ; Mantovani, M.M. ; Martini, M. ; Capaldi, G. ; Gomes, Y.T. &
Pece, R. (1981). A case of correlation between Rn-222 anomalies and seismic activity
on a volcano (Vulcano island, southern Thyrrenian Sea). Geophys. Res. Lett., 8, 962–
965.
De Gregorio, S.; Diliberto, I.S.; Giammanco, S.; Gurrieri, S. & Valenza, M. (2002). Tectonic
control over large-scale diffuse degassing in Eastern Sicily (Italy). Geofluids, 2, 273–
284.
Di Filippo, M. & Toro, B. (1995). Gravity features. In: The Volcano of the Alban Hills, R. Trigila
Ed. , 283 pp.
Dubois, C.; Alvarez Calleja, A.; Bassot, S. & Chambaudet, A. (1995). Modelling the 3-
dimensional microfissure network in quartz in a thin section of granite. In: Gas
Geochemistry, C. Dubois Ed., Science Reviews, Northwood, pp. 357-368.
Duddridge, G. A.; Grainger, P. & Durrance, E. M. (1991). Fault detection using soil gas
geochemistry, Q. J. Eng. Geol., 24, 427-435.
Durrance, E. M. & Gregory, R .G. (1988). Fracture mapping in clays: Soil gas surveys at
Down Ampney, Gloucestershire. DOE Report: DOE/RW/88081, Dep. Of Energy,
Washington D.C.
Eremeev, A. N.; Sokolov, V.A. & Solovov, A.P. (1973). Application of helium surveying to
structural mapping and ore deposit forecasting. In: Geochemical Exploration, 1972, M.
J. Jones Ed., pp.183– 192, Inst. of Min. and Metall., London.
Etiope, G. & Lombardi, S. (1995). Soil gases as fault tracers in clay basins: a case history in
the Siena Basin (Central Italy). In: Gas Geochemistry, C. Dubois Ed., 19–29, Science
Reviews, Northwood.
Fleischer, R.L. ; Alter, H.W. ; Furnam, S.C. ; Price, P.B. & Walker, R.M. (1972). Particle track
etching. Science, 178, 255–263.
Fleischer, R.L. & Magro-Campero, A. (1985). Association of subsurface radon changes in
Alaska and the northeastern United States with earthquakes. Geochim. Cosmochim.
Acta, 49, 1061–1071.
Galadini, F. & Messina, P. (1994). Plio-Quatenary tectonics of the Fucino basin and
surrounding areas (CentraI ltaly), J. Geol.,5, 6(2), 73-99.
Gascoyne, M. ; Wuschke, D.M. & Durrance, E.M. (1993). Fracture detection and
groundwater flow characterization using He and Rn in soil gases, Manitoba,
Canada. Appl. Geochem., 8, 223– 233.
Gavshin, V.M.; Melgunov, M.S.; Sukhorukov, F.V.; Bobrov, V.A.; Kalugin, I.A. & Klerkx, J.
(2002). Disequilibrium between uranium and its progeny in the Lake Issyk-Kul
system (Kyrgyzstan) under a combined effect of natural and manmade processes.
J.Env. Radioact., 83, 1, 61-84.
Natural Gas202
Giraudi, C. (1989). Lake levels and climate for the last 30,000 years in the Fucino area
(Abruzzo, CentraI ltaly): A review. Palaeogeogr. Palaeoclimatol. Palaeoecol., 70, 249-
260.
Giralt, S. ; Klerkx, J. ; De Batist, M. ; Beck, C. ; Bobrov, V. ; Gavshin, V. ; Julià, R. ; Kalugin, I. ;
Kipfer, R. ; Lignier, V. ; Lombardi, S. ; Matychenkov, V. ; Peeters, F. ; Podsetchine,
V. ; Riera, S. ; Romanovsky, V. ; Sukhorukov, F. & Voltattorni, N. (2003). Are
environmental changes affecting the natural state of Lake Issyk-Kul ? Proceedings of
NATO Advanced Research Workshop on “Dying and dead seas”, Liege, 5-10 May 2003.
Gregory, R.G. & Durrance, E.M. (1985). Helium, carbon dioxide and oxygen soil gases:
small-scale varations over fractured ground. J. Geochem. Expl., 24, (1), 29-49.
Hickman, S.; Sibson, R. & Bruhn, R. (1995). Introduction to special section: Mechanical
involvement of fluids in faulting. J. Geophys. Res., 100, 12,831–12,840.
Hinkle, M. (1994). Environmental conditions affecting concentrations of He, CO
2
, O
2
and N
2
in soil gases. Appl. Geochem., 9, 53– 63.
Holub, R. F. & Brady, B. T. (1981). The effect of stress on radon emanation from rock, J.
Geophys. Res., 86, 1776–1784.
Hueckel, T. & Pellegrini, R. (2002). Reactive plasticity for clays: application to a natural
analog of long-term geomechanical effects of nuclear waste disposal. Engineering
Geology, 64, 195-215.
Irwin, W.P. & Barnes, I. (1980). Tectonic relations of carbon dioxide discharges and
earthquakes. J. Geophys. Res., 85, 3115–3121.
Kerrick, D.M.; McKibben, M.A.; Seward, T.M. & Caldeira, K. (1995). Convective
hydrothermal CO
2
emission from high heat flow regions. Chem. Geol., 121, 285–293.
King, C.Y. (1978). Radon emanation on San Andreas fault. Nature, 271, 516–519.
King, C.Y.; King, B.S.; Evans, W.C. & Zang, W. (1996). Spatial radon anomalies on active
faults in California, Appl. Geochem., 11, 497-510.
Klusman, R.W. (1993). Soil Gas and Related Methods for Natural Resource Exploration.
Wiley, Chichester, 483 pp.
Leoni, L.; Polizzano, C.; Sartori F. & Sensi, L. (1984). Chemical and mineralogical
transformation induced in Pliocene clays by a small subvolcanic body and
consequence for the storage of radioactive wastes. N. Jb. Mineral. Mh., 155-168.
Lewicki, J.L.; Evans, W.C.; Hilley, G.E.; Sorey, M.L.; Rogie, J.D. & Brantley, S.L. (2003).
Shallow soil CO
2
flow along the San Andreas and Calaveras Faults, California.
Journal of Geophysical Research, 108, B4, 14 pp.
Lombardi., S.; Etiope, G.; Guerra, M.; Ciotoli, G.; Grainger, P.; Duddridge, G.A.; Gera, F.;
Chiantore, V.; Pensieri, R.; Grindrod, P. & Impey, M. (1996). The refinement of soil
gas analysis as a geological investigative technique. Final Report. Work carried out
under a cost sharing contract with the European Atomic Energy Community in the
framework of its 4th R&D program on Management and Storage of Radioactive
Waste (1990-1994), Part A, Task 4: Disposal of Radioactive Waste. EUR 16929 EN.
Lombardi, S. & Voltattorni, N. (2010). Rn, He and CO
2
soil gas geochemistry for the study of
active and inactive faults. Applied Geochemistry, 25, 1206-1220.
Manini, E., Luna, G., Corinaldesi, C., Zeppilli, D., Bortoluzzi, G., Caramanna, G., Raffa, F. &
Danovaro, R. (2008). Prokaryote diversity and virus abundance in shallow
hydrothermal vents of the Mediterranean Sea (Panarea Island) and the Pacific
Ocean ( North Sulawesi-Indonesia). Microbial Ecology, 55, 626-639.
Morawska, L. & Phillips, C.R. (1993). Dependance of the radon emanation coefficient on
radium distribution and internal structure of the material. Geochim. Cosmochim.
Acta, 57, 1783-1797.
Nijman, W. (1971). Tectonics of the Velino-Sirente area, Abruzzi, Central Italy, Proc. K,: Ned.
Akad. Wet., Ser. B, 74(2), 156-184.
Pinault, J. L. & Baubron, J. C. (1996). Signal processing of soil gas radon, atmospheric
pressure, moisture, and soil temperature data: a new approach for radon
concentration modeling, J. Geophys. Res., 101, B2, 3157-3171.
Rahn, T.A.; Fessenden, J.E. & Wahlen, M. (1996). Flux chamber measurements of anomalous
CO
2
emission from the flanks of Mammoth Mountain, California. Geophys. Res.
Lett., 23, 1861–1864.
Reimer, G.M. & Gundersen, L.C.S. (1989). A direct correlation among indoor Rn, soil gas Rn
and geology in the Reading Prong near Boyertown, Pennsylvania. Health Phys., 57,
155-160.
Reimer, G.M. (1990). Reconnaissance techniques for determining soil gas radon
concentrations: an example from Prince Geoges County, Maryland. Geophys. Res.
Lett., 17, 809– 8012.
Segovia, N. ; De la Cruz Reyna, S. ; Mena, M. ; Ramos, E. ; Monnin, M. & Seidel, J.L. (1989).
Radon in soil anomaly observed at Los Azufres Geothermal field, Michoacan: a
possible precursor of the 1985 Mexico earthquake (Ms D 8.1). Natural Hazards, 1,
319–329.
Shapiro, M.H. ; Melvin, J.D. ; Tombrello, T.A. ; Fong-Liang, J. ; Gui-Ru, L. ; Mendenhall,
M.H. & Rice, A. (1982). Correlated radon and CO
2
variations near the San-Andreas
fault. Geophys. Res. Lett., 9, 503–506.
Shapiro, M.H. ; Melvin, J.D. ; Copping, N.A. ; Tombrello, T.A. & Whitcombe, J.H. (1989).
Automated radon–thoron monitoring for earthquake prediction research. In: Radon
Monitoring in Radioprotection, Environmental Radio-Activity and Earth Sciences. ICTP,
Trieste, pp. 137–153.
Sugisaki, R.; Anno, H.; Aedachi, M. & Ui, H. (1980). Geochemical features of gases and rocks
along active faults. Geochem. J., 14, 101–112.
Sugisaki, R. (1983). Origin of hydrogen and carbon dioxide in fault gases and its relation to
fault activity. J. Geol., 91, 239-258.
Tanner, A.B. (1964). Radon migration in the ground: A supplementary review. In: The
Natural Radiation Environment, vol. I, T.F. Gesell and W.M. Lowder Eds., pp. 5-56,
Univ. of Tex., Austin.
Thomas, D.M. ; Cox, M.E. & Cuff, K.E. (1986). The association between ground gas radon
variations and geologic activity in Hawaii. J. Geophys. Res., 91, 12186–12198.
Thomas, D. (1988). Geochemical precursors to seismic activity. Pure Appl. Geophys., 126, 241–
265.
Toutain, J.P. ; Baubron, J.C. ; Le Bronec, J. ; Allard, P. ; Briole, P. ; Marty, B. ; Miele, G. ;
Tedesco, D. & Luongo, G. (1992). Continuous monitoring of distal gas emanations
at Vulcano, southern Italy. Bull. Volcanol., 54, 147–155.
Voltattorni, N.; Lombardi, S. & Beaubien, S.E. (2004). Evaluation of radioactive elements
migration from uranium mines in Kyrghystan (Central Asia). Proceeding oft he 32
nd
International Geological Congress, Firenze, Fortezza da Basso, 20-28 Agosto 2004.
Soil gas geochemistry: signicance and application in geological prospectings 203
Giraudi, C. (1989). Lake levels and climate for the last 30,000 years in the Fucino area
(Abruzzo, CentraI ltaly): A review. Palaeogeogr. Palaeoclimatol. Palaeoecol., 70, 249-
260.
Giralt, S. ; Klerkx, J. ; De Batist, M. ; Beck, C. ; Bobrov, V. ; Gavshin, V. ; Julià, R. ; Kalugin, I. ;
Kipfer, R. ; Lignier, V. ; Lombardi, S. ; Matychenkov, V. ; Peeters, F. ; Podsetchine,
V. ; Riera, S. ; Romanovsky, V. ; Sukhorukov, F. & Voltattorni, N. (2003). Are
environmental changes affecting the natural state of Lake Issyk-Kul ? Proceedings of
NATO Advanced Research Workshop on “Dying and dead seas”, Liege, 5-10 May 2003.
Gregory, R.G. & Durrance, E.M. (1985). Helium, carbon dioxide and oxygen soil gases:
small-scale varations over fractured ground. J. Geochem. Expl., 24, (1), 29-49.
Hickman, S.; Sibson, R. & Bruhn, R. (1995). Introduction to special section: Mechanical
involvement of fluids in faulting. J. Geophys. Res., 100, 12,831–12,840.
Hinkle, M. (1994). Environmental conditions affecting concentrations of He, CO
2
, O
2
and N
2
in soil gases. Appl. Geochem., 9, 53– 63.
Holub, R. F. & Brady, B. T. (1981). The effect of stress on radon emanation from rock, J.
Geophys. Res., 86, 1776–1784.
Hueckel, T. & Pellegrini, R. (2002). Reactive plasticity for clays: application to a natural
analog of long-term geomechanical effects of nuclear waste disposal. Engineering
Geology, 64, 195-215.
Irwin, W.P. & Barnes, I. (1980). Tectonic relations of carbon dioxide discharges and
earthquakes. J. Geophys. Res., 85, 3115–3121.
Kerrick, D.M.; McKibben, M.A.; Seward, T.M. & Caldeira, K. (1995). Convective
hydrothermal CO
2
emission from high heat flow regions. Chem. Geol., 121, 285–293.
King, C.Y. (1978). Radon emanation on San Andreas fault. Nature, 271, 516–519.
King, C.Y.; King, B.S.; Evans, W.C. & Zang, W. (1996). Spatial radon anomalies on active
faults in California, Appl. Geochem., 11, 497-510.
Klusman, R.W. (1993). Soil Gas and Related Methods for Natural Resource Exploration.
Wiley, Chichester, 483 pp.
Leoni, L.; Polizzano, C.; Sartori F. & Sensi, L. (1984). Chemical and mineralogical
transformation induced in Pliocene clays by a small subvolcanic body and
consequence for the storage of radioactive wastes. N. Jb. Mineral. Mh., 155-168.
Lewicki, J.L.; Evans, W.C.; Hilley, G.E.; Sorey, M.L.; Rogie, J.D. & Brantley, S.L. (2003).
Shallow soil CO
2
flow along the San Andreas and Calaveras Faults, California.
Journal of Geophysical Research, 108, B4, 14 pp.
Lombardi., S.; Etiope, G.; Guerra, M.; Ciotoli, G.; Grainger, P.; Duddridge, G.A.; Gera, F.;
Chiantore, V.; Pensieri, R.; Grindrod, P. & Impey, M. (1996). The refinement of soil
gas analysis as a geological investigative technique. Final Report. Work carried out
under a cost sharing contract with the European Atomic Energy Community in the
framework of its 4th R&D program on Management and Storage of Radioactive
Waste (1990-1994), Part A, Task 4: Disposal of Radioactive Waste. EUR 16929 EN.
Lombardi, S. & Voltattorni, N. (2010). Rn, He and CO
2
soil gas geochemistry for the study of
active and inactive faults. Applied Geochemistry, 25, 1206-1220.
Manini, E., Luna, G., Corinaldesi, C., Zeppilli, D., Bortoluzzi, G., Caramanna, G., Raffa, F. &
Danovaro, R. (2008). Prokaryote diversity and virus abundance in shallow
hydrothermal vents of the Mediterranean Sea (Panarea Island) and the Pacific
Ocean ( North Sulawesi-Indonesia). Microbial Ecology, 55, 626-639.
Morawska, L. & Phillips, C.R. (1993). Dependance of the radon emanation coefficient on
radium distribution and internal structure of the material. Geochim. Cosmochim.
Acta, 57, 1783-1797.
Nijman, W. (1971). Tectonics of the Velino-Sirente area, Abruzzi, Central Italy, Proc. K,: Ned.
Akad. Wet., Ser. B, 74(2), 156-184.
Pinault, J. L. & Baubron, J. C. (1996). Signal processing of soil gas radon, atmospheric
pressure, moisture, and soil temperature data: a new approach for radon
concentration modeling, J. Geophys. Res., 101, B2, 3157-3171.
Rahn, T.A.; Fessenden, J.E. & Wahlen, M. (1996). Flux chamber measurements of anomalous
CO
2
emission from the flanks of Mammoth Mountain, California. Geophys. Res.
Lett., 23, 1861–1864.
Reimer, G.M. & Gundersen, L.C.S. (1989). A direct correlation among indoor Rn, soil gas Rn
and geology in the Reading Prong near Boyertown, Pennsylvania. Health Phys., 57,
155-160.
Reimer, G.M. (1990). Reconnaissance techniques for determining soil gas radon
concentrations: an example from Prince Geoges County, Maryland. Geophys. Res.
Lett., 17, 809– 8012.
Segovia, N. ; De la Cruz Reyna, S. ; Mena, M. ; Ramos, E. ; Monnin, M. & Seidel, J.L. (1989).
Radon in soil anomaly observed at Los Azufres Geothermal field, Michoacan: a
possible precursor of the 1985 Mexico earthquake (Ms D 8.1). Natural Hazards, 1,
319–329.
Shapiro, M.H. ; Melvin, J.D. ; Tombrello, T.A. ; Fong-Liang, J. ; Gui-Ru, L. ; Mendenhall,
M.H. & Rice, A. (1982). Correlated radon and CO
2
variations near the San-Andreas
fault. Geophys. Res. Lett., 9, 503–506.
Shapiro, M.H. ; Melvin, J.D. ; Copping, N.A. ; Tombrello, T.A. & Whitcombe, J.H. (1989).
Automated radon–thoron monitoring for earthquake prediction research. In: Radon
Monitoring in Radioprotection, Environmental Radio-Activity and Earth Sciences. ICTP,
Trieste, pp. 137–153.
Sugisaki, R.; Anno, H.; Aedachi, M. & Ui, H. (1980). Geochemical features of gases and rocks
along active faults. Geochem. J., 14, 101–112.
Sugisaki, R. (1983). Origin of hydrogen and carbon dioxide in fault gases and its relation to
fault activity. J. Geol., 91, 239-258.
Tanner, A.B. (1964). Radon migration in the ground: A supplementary review. In: The
Natural Radiation Environment, vol. I, T.F. Gesell and W.M. Lowder Eds., pp. 5-56,
Univ. of Tex., Austin.
Thomas, D.M. ; Cox, M.E. & Cuff, K.E. (1986). The association between ground gas radon
variations and geologic activity in Hawaii. J. Geophys. Res., 91, 12186–12198.
Thomas, D. (1988). Geochemical precursors to seismic activity. Pure Appl. Geophys., 126, 241–
265.
Toutain, J.P. ; Baubron, J.C. ; Le Bronec, J. ; Allard, P. ; Briole, P. ; Marty, B. ; Miele, G. ;
Tedesco, D. & Luongo, G. (1992). Continuous monitoring of distal gas emanations
at Vulcano, southern Italy. Bull. Volcanol., 54, 147–155.
Voltattorni, N.; Lombardi, S. & Beaubien, S.E. (2004). Evaluation of radioactive elements
migration from uranium mines in Kyrghystan (Central Asia). Proceeding oft he 32
nd
International Geological Congress, Firenze, Fortezza da Basso, 20-28 Agosto 2004.
Natural Gas204
Voltattorni, N. ; Sciarra, A. ; Caramanna, G. ; Cinti, D. ; Pizzino, L. & Quattrocchi, F. (2009).
Gas geochemistry of natural analogues for the studies of geological CO
2
sequestration. Applied Geochemistry, 24, 1339–1346.
Voltattorni, N.; Lombardi, S. & Rizzo, S. (2010).
222
Rn and CO
2
soil- gas geochemical
characterization of thermally altered clays at Orciatico (Tuscany, Central Italy).
Applied Geochemistry, 25, 1248-1256.
Wattananikorn, K. ; Techakosit, S. & Jitaree, N. (1995). A combination of soil gas radon
measurements in uranium exploration. Nucl. Geophys.,9, 643–652.
Woith, H. ; Pekdeger, A. & Zschau, J. (1991). Ground water radon anomalies in space and
time: a contribution to the joint Turkish–German earthquake prediction project. In:
Earthquake Prediction: State of the Art. EUG, Strasbourg.
Adsorption of methane in porous materials as the basis for the storage of natural gas 205
Adsorption of methane in porous materials as the basis for the storage
of natural gas
Cecilia Solar, Andrés García Blanco, Andrea Vallone and Karim Sapag
X
Adsorption of methane in porous materials
as the basis for the storage of natural gas
Cecilia Solar, Andrés García Blanco, Andrea Vallone and Karim Sapag
Laboratorio de Sólidos Porosos-Instituto de Física Aplicada-CONICET, Dpto. de Física-
Universidad Nacional de San Luis
San Luis, Argentina
1. Introduction
It is well known that the natural gas (NG) is a substance of fossil origin from the decomposition
of organic matter. It is found trapped under the terrestrial surface in stratus that avoid the natural
release to atmosphere. These underground deposits can be oceanic or terrestrial.
The NG is a homogeneous mixture, having variable proportions of hydrocarbons, being the
main constitute the methane (CH
4
), which content generally ranges from 55 to 98 % in
volume. Also, it contains ethane (C
2
H
6
), propane (C
3
H
8
) and heavier constitutes. Although it
can be found in gas phase or in solution with oil, under normal atmospheric conditions,
remains in gas phase. It may have some impurities or substances that are not hydrocarbons,
such as Hydrogen Sulfide, Nitrogen and Carbon Dioxide (Figure 1). According to its origin,
natural gas is classified in associated and non-associated, being the first, the one which remains
in contact and/or dissolved with the oil from the deposit. The non-associated gas can be
found in deposits lacking oil crude at the initial conditions of pressure and temperature.
Fig. 1. Principal constitutes of Natural Gas (in percentage).
10
Natural Gas206
From the fossil fuels, the cleanest is the natural gas. Its combustion, similarly to other fuels,
produces mainly CO
2
and water vapor. The emissions of CO
2
are 25-30% lower than the
generated by the fuel-oil and a 40-50% lower than charcoal (Figure 2) per unit of produced
energy (Natural Gas and Climate Change Policy, 1998; Comisión Nacional de Energía, 1999).
0
20
40
60
80
100
120
55,9
91,3
78,573,3
102
kg CO2/GJ
Lignite Antracite Fuel Oil Diesel Natural Gas
Fig. 2. CO
2
Emissions in the combustion (Kg per GJ).
At worldwide scale, the resources of natural gas are abundant. However, as oil, they are
highly concentrated in a reduced number of countries and deposits. Some data reported in
the BP Statistical Review of World Energy, 2009, revealed interesting information: three
countries (Russia, Iran and Qatar), hold the 56% of the world reserves (WR). Almost the 50%
of the WR are distributed in 25 deposits around the world and the countries that are
members of the OPEC (Organization of the Petroleum Exporting Countries), control the 50%
of the WR. The percentage distribution of the WR by the end of 2008 is shown in Figure 3.
Fig. 3. The percentage distribution of the world reserves of natural gas by the end of 2008
according to the Statistical Review of World Energy, 2009.
As it may be seen from Figure 3, the world reserves of natural gas, although
heterogeneously, are distributed throughout the world, constituting an advantage to be able
to supply the local requirements. During the last few decades, the volume of discovered gas
has been decreasing but it still keeps the necessary volume to ensure their existence for
many years. Additionally, the estimations of these reserves are progressing as new
techniques of exploitation, exploration and extraction, are discovered. It is estimated that a
substantial quantity of natural gas remains undiscovered (World Energy Outlook, 2009).
The NG has vast diversity of applications: in industry, trade, energy generation, residential
sector and terrestrial transport, and its use have shown an important growth over the last
few years (MacDonald & Quinn, 1998; Inomata et al., 2002; Prauchner & Rodríguez-Reinoso,
2008).
Regarding the particular use as fuel for transport units, such as cars, autobuses and trucks,
the natural gas vehicle (NGV) shows diverse environmental benefits. One of them is the
reduction of post combustion contaminants, lowering the maintenance costs compared to
traditional fuels (Cook et al., 1999; Lozano-Castelló et al., 2002a; Alcañiz-Monge et al., 1997).
The environmental advantages at using the NGV are numerous. However, from the point of
view of the combustion products, it can be remarked: i) it does not contain lead or heavy
metals traces, avoiding their emission to the atmosphere, ii) lack of suspended solid particles
that are present when using gasoline affecting health (increase of respiratory and
cardiovascular diseases), iii) absence of sulfur and subsequently no sulfur dioxide (SO
2
)
emissions, typical contaminant from transport. Compared to liquid fuels, the emissions of
the NGV combustion produce up to 76% less CO, 75% less NOx, 88% less hydrocarbons and
30% less CO
2
. Furthermore, the physicochemical properties of the natural gas enable the use
of catalysts for the combustion of gases, obtaining excellent results and minimizing even
more the emissions (Sun et al., 1997).
The advantages of NG have promoted its use in the automotive fleet of many countries,
which exceeds six millions of vehicles at present. The advance in the technology for the
NGV use has not been standardized throughout the world. This is due to differences
regarding the availability of energy resources, contamination levels, fuel pricing policies,
applied auditing and, definitely, the set of government actions able to generate expectative
among the potential users.
Country Vehicles
Pakista
n
2,000.000
Ar
g
entine
1,678.000
Brazil
1,467.000
Ital
y
433,000
Colombia
251,000
India
225,000
EE.UU
130,200
German
y
54,200
Ja
p
a
n
24,700
France
8,400
Table 1. Estimated Natural Gas Vehicles in different countries.
Adsorption of methane in porous materials as the basis for the storage of natural gas 207
From the fossil fuels, the cleanest is the natural gas. Its combustion, similarly to other fuels,
produces mainly CO
2
and water vapor. The emissions of CO
2
are 25-30% lower than the
generated by the fuel-oil and a 40-50% lower than charcoal (Figure 2) per unit of produced
energy (Natural Gas and Climate Change Policy, 1998; Comisión Nacional de Energía, 1999).
0
20
40
60
80
100
120
55,9
91,3
78,573,3
102
kg CO2/GJ
Lignite Antracite Fuel Oil Diesel Natural Gas
Fig. 2. CO
2
Emissions in the combustion (Kg per GJ).
At worldwide scale, the resources of natural gas are abundant. However, as oil, they are
highly concentrated in a reduced number of countries and deposits. Some data reported in
the BP Statistical Review of World Energy, 2009, revealed interesting information: three
countries (Russia, Iran and Qatar), hold the 56% of the world reserves (WR). Almost the 50%
of the WR are distributed in 25 deposits around the world and the countries that are
members of the OPEC (Organization of the Petroleum Exporting Countries), control the 50%
of the WR. The percentage distribution of the WR by the end of 2008 is shown in Figure 3.
Fig. 3. The percentage distribution of the world reserves of natural gas by the end of 2008
according to the Statistical Review of World Energy, 2009.
As it may be seen from Figure 3, the world reserves of natural gas, although
heterogeneously, are distributed throughout the world, constituting an advantage to be able
to supply the local requirements. During the last few decades, the volume of discovered gas
has been decreasing but it still keeps the necessary volume to ensure their existence for
many years. Additionally, the estimations of these reserves are progressing as new
techniques of exploitation, exploration and extraction, are discovered. It is estimated that a
substantial quantity of natural gas remains undiscovered (World Energy Outlook, 2009).
The NG has vast diversity of applications: in industry, trade, energy generation, residential
sector and terrestrial transport, and its use have shown an important growth over the last
few years (MacDonald & Quinn, 1998; Inomata et al., 2002; Prauchner & Rodríguez-Reinoso,
2008).
Regarding the particular use as fuel for transport units, such as cars, autobuses and trucks,
the natural gas vehicle (NGV) shows diverse environmental benefits. One of them is the
reduction of post combustion contaminants, lowering the maintenance costs compared to
traditional fuels (Cook et al., 1999; Lozano-Castelló et al., 2002a; Alcañiz-Monge et al., 1997).
The environmental advantages at using the NGV are numerous. However, from the point of
view of the combustion products, it can be remarked: i) it does not contain lead or heavy
metals traces, avoiding their emission to the atmosphere, ii) lack of suspended solid particles
that are present when using gasoline affecting health (increase of respiratory and
cardiovascular diseases), iii) absence of sulfur and subsequently no sulfur dioxide (SO
2
)
emissions, typical contaminant from transport. Compared to liquid fuels, the emissions of
the NGV combustion produce up to 76% less CO, 75% less NOx, 88% less hydrocarbons and
30% less CO
2
. Furthermore, the physicochemical properties of the natural gas enable the use
of catalysts for the combustion of gases, obtaining excellent results and minimizing even
more the emissions (Sun et al., 1997).
The advantages of NG have promoted its use in the automotive fleet of many countries,
which exceeds six millions of vehicles at present. The advance in the technology for the
NGV use has not been standardized throughout the world. This is due to differences
regarding the availability of energy resources, contamination levels, fuel pricing policies,
applied auditing and, definitely, the set of government actions able to generate expectative
among the potential users.
Country Vehicles
Pakista
n
2,000.000
Ar
g
entine
1,678.000
Brazil
1,467.000
Ital
y
433,000
Colombia
251,000
India
225,000
EE.UU
130,200
German
y
54,200
Ja
p
a
n
24,700
France
8,400
Table 1. Estimated Natural Gas Vehicles in different countries.
Natural Gas208
Table 1 summarizes the number of natural gas vehicles in some representative countries
according to the Dirección de Tecnología, Seguridad y Eficiencia Energética, 2006.
In spite of the advantages showed by the NG in comparison to liquid fuels, there is an
important disadvantage: its low-energy density (heat of combustion/volume), which
constitutes a limitation for some applications. Therefore, under standard conditions of
pressure and temperature, the distance traveled by a vehicle per unit of fuel volume, using
NG, corresponds to the 0.12% of the trajectory with gasoline. Consequently, the storage of
this fuel, whether in quantity or density, plays an important role for its use in diverse kinds
of transport.
An alternative is to increase the density, for example, liquefying the NG. The liquefied
natural gas (LNG) is stored at the boiling point, 112K (-161ºC) in a cryogenic tank at a
pressure of 0.1MPa, where the energy density is approximately a 72% of the total gasoline.
This means that 1 volume of LNG corresponds to 600 volumes of natural gas under STP (600
v/v) conditions (Cracknell et al., 1993; Menon & Komarneni, 1998). However, this storage
method shows multiple inconveniences, mainly because the LNG increases inevitably the
temperature within the tank. Thus, the pressure rises and could result in a dangerous
situation. Moreover, the filling of the tank must be performed by an expert on cryogenic
liquids handling.
A widely used commercial method considered to increase the energy density of the natural
gas is to compress and store it as compressed natural gas (CNG). For this case, the NG can
be found as a supercritical fluid at room temperature and it becomes compressed at a
maximum pressure around 20-25 MPa, reaching a density 230 times higher (230 v/v) than
the one obtained for the natural gas under STP conditions (Menon & Komarneni, 1998;
Lozano-Castelló et al., 2002b). In this case, the energy density is approximately 25% of the
one from gasoline. A disadvantage is the risk of carrying highly compressed gas (20MPa)
within the vehicle. Modifications such as thick-walled tanks and complex safety valves
would be required.
The use of adsorbent materials, such as activated carbons and zeolites, among others
(Rodriguez-Reinoso & Molina-Sabio, 1992; Parkyns & Quinn, 1995; Sircar et al., 1996;
Alcañiz-Monge et al., 1997; Lozano-Castello et al., 2002c; Almansa et al., 2004; Marsh &
Rodriguez-Reinoso, 2006; Mentasty et al., 1991; Triebe et al., 1996), for the storage of natural
gas at low pressures, is known as adsorbed natural gas (ANG). Pressures are relatively low,
of the order of 2 to 4 MPa at room temperature, which represents an interesting alternative
for the transport and applications at large scale. The technology, in contrast with the other
two, is not well developed and is still at scientific level. At this stage, the studies on storage
by the ANG method are carried out using the methane, major constituent of the NG. It has
been found that the density of the compressed methane at 3.4MPa can be increased in a
factor higher than 4 by the use of adsorbents, reaching a relation of methane storage of 180
v/v, which is equivalent to compressed gas at more than 16MPa (Cook et al., 1999; Alcañiz-
Monge et al., 1997).
Through this chapter, basic concepts regarding adsorption and adsorbents are reviewed as
well as their application for the particular study of methane storage, starting point of the
ANG process. In addition, the methodology for the study is described and shows the
scientific advance in this field, reporting results from our research group and from other
laboratories.
2. Adsorption basics and methodology of study
Adsorption is a phenomenon in which surface plays an important role, unlike absorption
where molecules can penetrate the solid structure. The occurrence of this phenomenon in
gas-solid interactions is our major focus of interest.
The surfaces of solids, even those homogeneous, have imperfections. These defects are the
result of many circumstances, mainly its composition and the interaction that takes place
among the molecules that constitute their atmosphere. Figure 4 shows a classical schema of
this situation, according to the description made by Somorjai, 1994.
Fig. 4. Scheme of common defects on the apparently homogeneous solid surfaces.
Generally, the properties of the surfaces of the solids differ from their bulk for many
reasons. Some of which are enlisted below:
The perturbation of the superficial electron density is different to the one from the
bulk. This is caused by the loss of structural periodicity in the perpendicular
direction of the surface.
The presence of decompensated forces on the surface due to the lack of neighbor
atoms (producing potential wells, nearby molecules are attracted).
Vibrational properties on the surface are different (geometrical and energetic
effects, producing curvatures) from the ones on the rest of the solid.
Some phenomena can occur: Relaxation or Superficial Reconstruction, which means
that the superficial atoms show geometrical and energetic differences to the atoms
from the bulk.
These reasons promote the presence of attractive potentials, which are able to attract
molecules from the surrounding leaded by thermodynamic parameters, particularly,
pressure P and temperature T of the gas-solid system. Moreover, superficial centers can take
place showing additional electrostatic effects and creating new attractive or repulsive
“sites”. Therefore, when one or more molecules from a fluid approach the surface, they
could be trapped and nucleation, motion and the formation of layers in the interface, would
take place. This process is named Adsorption.
“Adsorption of a gas onto a solid surface” can be defined as the gain of one or more
constituents of the gas in the region of the gas-solid interface. Figure 5 shows a schema that
represents the process.
The adsorption phenomenon involves an increment of the gas density in the neighborhood
of the contact surface and since the process is spontaneous, the change in the free energy of
Gibbs is smaller than zero. Given that the entropy change is also below zero (a decrease in
Adsorption of methane in porous materials as the basis for the storage of natural gas 209
Table 1 summarizes the number of natural gas vehicles in some representative countries
according to the Dirección de Tecnología, Seguridad y Eficiencia Energética, 2006.
In spite of the advantages showed by the NG in comparison to liquid fuels, there is an
important disadvantage: its low-energy density (heat of combustion/volume), which
constitutes a limitation for some applications. Therefore, under standard conditions of
pressure and temperature, the distance traveled by a vehicle per unit of fuel volume, using
NG, corresponds to the 0.12% of the trajectory with gasoline. Consequently, the storage of
this fuel, whether in quantity or density, plays an important role for its use in diverse kinds
of transport.
An alternative is to increase the density, for example, liquefying the NG. The liquefied
natural gas (LNG) is stored at the boiling point, 112K (-161ºC) in a cryogenic tank at a
pressure of 0.1MPa, where the energy density is approximately a 72% of the total gasoline.
This means that 1 volume of LNG corresponds to 600 volumes of natural gas under STP (600
v/v) conditions (Cracknell et al., 1993; Menon & Komarneni, 1998). However, this storage
method shows multiple inconveniences, mainly because the LNG increases inevitably the
temperature within the tank. Thus, the pressure rises and could result in a dangerous
situation. Moreover, the filling of the tank must be performed by an expert on cryogenic
liquids handling.
A widely used commercial method considered to increase the energy density of the natural
gas is to compress and store it as compressed natural gas (CNG). For this case, the NG can
be found as a supercritical fluid at room temperature and it becomes compressed at a
maximum pressure around 20-25 MPa, reaching a density 230 times higher (230 v/v) than
the one obtained for the natural gas under STP conditions (Menon & Komarneni, 1998;
Lozano-Castelló et al., 2002b). In this case, the energy density is approximately 25% of the
one from gasoline. A disadvantage is the risk of carrying highly compressed gas (20MPa)
within the vehicle. Modifications such as thick-walled tanks and complex safety valves
would be required.
The use of adsorbent materials, such as activated carbons and zeolites, among others
(Rodriguez-Reinoso & Molina-Sabio, 1992; Parkyns & Quinn, 1995; Sircar et al., 1996;
Alcañiz-Monge et al., 1997; Lozano-Castello et al., 2002c; Almansa et al., 2004; Marsh &
Rodriguez-Reinoso, 2006; Mentasty et al., 1991; Triebe et al., 1996), for the storage of natural
gas at low pressures, is known as adsorbed natural gas (ANG). Pressures are relatively low,
of the order of 2 to 4 MPa at room temperature, which represents an interesting alternative
for the transport and applications at large scale. The technology, in contrast with the other
two, is not well developed and is still at scientific level. At this stage, the studies on storage
by the ANG method are carried out using the methane, major constituent of the NG. It has
been found that the density of the compressed methane at 3.4MPa can be increased in a
factor higher than 4 by the use of adsorbents, reaching a relation of methane storage of 180
v/v, which is equivalent to compressed gas at more than 16MPa (Cook et al., 1999; Alcañiz-
Monge et al., 1997).
Through this chapter, basic concepts regarding adsorption and adsorbents are reviewed as
well as their application for the particular study of methane storage, starting point of the
ANG process. In addition, the methodology for the study is described and shows the
scientific advance in this field, reporting results from our research group and from other
laboratories.
2. Adsorption basics and methodology of study
Adsorption is a phenomenon in which surface plays an important role, unlike absorption
where molecules can penetrate the solid structure. The occurrence of this phenomenon in
gas-solid interactions is our major focus of interest.
The surfaces of solids, even those homogeneous, have imperfections. These defects are the
result of many circumstances, mainly its composition and the interaction that takes place
among the molecules that constitute their atmosphere. Figure 4 shows a classical schema of
this situation, according to the description made by Somorjai, 1994.
Fig. 4. Scheme of common defects on the apparently homogeneous solid surfaces.
Generally, the properties of the surfaces of the solids differ from their bulk for many
reasons. Some of which are enlisted below:
The perturbation of the superficial electron density is different to the one from the
bulk. This is caused by the loss of structural periodicity in the perpendicular
direction of the surface.
The presence of decompensated forces on the surface due to the lack of neighbor
atoms (producing potential wells, nearby molecules are attracted).
Vibrational properties on the surface are different (geometrical and energetic
effects, producing curvatures) from the ones on the rest of the solid.
Some phenomena can occur: Relaxation or Superficial Reconstruction, which means
that the superficial atoms show geometrical and energetic differences to the atoms
from the bulk.
These reasons promote the presence of attractive potentials, which are able to attract
molecules from the surrounding leaded by thermodynamic parameters, particularly,
pressure P and temperature T of the gas-solid system. Moreover, superficial centers can take
place showing additional electrostatic effects and creating new attractive or repulsive
“sites”. Therefore, when one or more molecules from a fluid approach the surface, they
could be trapped and nucleation, motion and the formation of layers in the interface, would
take place. This process is named Adsorption.
“Adsorption of a gas onto a solid surface” can be defined as the gain of one or more
constituents of the gas in the region of the gas-solid interface. Figure 5 shows a schema that
represents the process.
The adsorption phenomenon involves an increment of the gas density in the neighborhood
of the contact surface and since the process is spontaneous, the change in the free energy of
Gibbs is smaller than zero. Given that the entropy change is also below zero (a decrease in
Natural Gas210
the freedom degree of the gas molecules during the process), the enthalpy change is lower
than zero. Thus, the process is exothermic (Rouquerol et al., 1999).
Fig. 5. Representation of the adsorption process of a gas on a solid surface for a given
pressure, P and temperature, T.
When the adsorption process is reversible it means physical adsorption or physisorption,
our major focus of interest for the study of natural gas storage. In this case, the result of the
adsorption heats or enthalpy changes in the process are not elevated values, being for the
methane about 16 KJoule/mol (Cook et al., 1999). The interaction forces occurring between
the solid surface (adsorbent) and the adsorbed gas (adsorbate) are Van der Waals type,
where prior to adsorption, the gas is called adsorbable. Moreover, adsorbate-adsorbate
interaction may take place and is neglected in some studies when compared to the
adsorbate-adsorbent interaction. It can also be considered that in average, these interactions
do not impact the whole process.
The net interaction potential that the molecules surrounding the surface may experience, can
be represented as seen in Figure 6, where the energy of interaction of one particle at a
distance z of the surface, is the sum of the interaction of each molecule(i) with each atom (j)
of the solid, given by equation 1.
j
ij
zE
)(
(1)
Figure 6 represents a particle with a kinetic energy E
k
approaching to the solid surface.
Fig. 6. Representation of the interaction potential that molecules nearby to the surface may
sense.
The particle may detect the phonons excitation and subsequently, the potential attraction of
the solid, which has a minimum (value) at a distance Z
0
, representing the minimal distance
of approaching to the solid.
The energy of the adsorbate-adsorbent interaction can be expressed using several terms.
Some of them are described in the following equation:
QdipPRD
EEEEEzE
)(
(2)
where E
D
represents the dispersive potential (attractive); E
R
, the repulsive; E
P
, the one
caused by the polarizability; E
dip
, the dipolar and E
Q,
the quadrupolar interactions
(Rouquerol et al., 1999).
Considering only the first two terms, a Lennard-Jones (L-J) potential would take place,
which involve the Van der Waals attractive forces and the Pauli repulsive forces.
2.1 Quantification of the Adsorption
Assuming a system set at a given temperature where a gas becomes into contact with a solid
surface occupying a volume V at a pressure P
i
prior to the adsorption, while a part of the
adsorbable gas passes to the adsorbed state, keeping V and T unchanged, it should be noted
a pressure decrease, followed by a stabilization of the system to a final equilibrium at
pressure P
eq
. Figure 7 represents the adsorption process at constant V and T.
Fig. 7. Scheme of the Adsorption process.
Once the pressure change (P
i
-P
eq
) is determined by an equation of state that represents the
gases under study, it is possible to calculate the quantity of moles that are no longer in gas
phase but in the adsorbed phase at that pressure. The same can also be expressed in terms of
adsorbed volume or grams of adsorbate, which is usually reported in standard conditions of
temperature and pressure. Whether P
i
is increased, a new P
eq
is obtained as well as a new
adsorbed quantity, maintaining unchanged the temperature and volume of the system.
Thereby, the relation between the adsorbed amount and the pressure may be graphically
found at constant temperature, reported as adsorption isotherm. This method, called
volumetric or manometric, is the most widely used to measure the adsorption of gases and
was selected for our laboratory to study adsorption processes. By the gravimetric method,
the adsorbed quantity is measured from the mass gain during the process.
Adsorption of methane in porous materials as the basis for the storage of natural gas 211
the freedom degree of the gas molecules during the process), the enthalpy change is lower
than zero. Thus, the process is exothermic (Rouquerol et al., 1999).
Fig. 5. Representation of the adsorption process of a gas on a solid surface for a given
pressure, P and temperature, T.
When the adsorption process is reversible it means physical adsorption or physisorption,
our major focus of interest for the study of natural gas storage. In this case, the result of the
adsorption heats or enthalpy changes in the process are not elevated values, being for the
methane about 16 KJoule/mol (Cook et al., 1999). The interaction forces occurring between
the solid surface (adsorbent) and the adsorbed gas (adsorbate) are Van der Waals type,
where prior to adsorption, the gas is called adsorbable. Moreover, adsorbate-adsorbate
interaction may take place and is neglected in some studies when compared to the
adsorbate-adsorbent interaction. It can also be considered that in average, these interactions
do not impact the whole process.
The net interaction potential that the molecules surrounding the surface may experience, can
be represented as seen in Figure 6, where the energy of interaction of one particle at a
distance z of the surface, is the sum of the interaction of each molecule(i) with each atom (j)
of the solid, given by equation 1.
j
ij
zE
)(
(1)
Figure 6 represents a particle with a kinetic energy E
k
approaching to the solid surface.
Fig. 6. Representation of the interaction potential that molecules nearby to the surface may
sense.
The particle may detect the phonons excitation and subsequently, the potential attraction of
the solid, which has a minimum (value) at a distance Z
0
, representing the minimal distance
of approaching to the solid.
The energy of the adsorbate-adsorbent interaction can be expressed using several terms.
Some of them are described in the following equation:
QdipPRD
EEEEEzE )(
(2)
where E
D
represents the dispersive potential (attractive); E
R
, the repulsive; E
P
, the one
caused by the polarizability; E
dip
, the dipolar and E
Q,
the quadrupolar interactions
(Rouquerol et al., 1999).
Considering only the first two terms, a Lennard-Jones (L-J) potential would take place,
which involve the Van der Waals attractive forces and the Pauli repulsive forces.
2.1 Quantification of the Adsorption
Assuming a system set at a given temperature where a gas becomes into contact with a solid
surface occupying a volume V at a pressure P
i
prior to the adsorption, while a part of the
adsorbable gas passes to the adsorbed state, keeping V and T unchanged, it should be noted
a pressure decrease, followed by a stabilization of the system to a final equilibrium at
pressure P
eq
. Figure 7 represents the adsorption process at constant V and T.
Fig. 7. Scheme of the Adsorption process.
Once the pressure change (P
i
-P
eq
) is determined by an equation of state that represents the
gases under study, it is possible to calculate the quantity of moles that are no longer in gas
phase but in the adsorbed phase at that pressure. The same can also be expressed in terms of
adsorbed volume or grams of adsorbate, which is usually reported in standard conditions of
temperature and pressure. Whether P
i
is increased, a new P
eq
is obtained as well as a new
adsorbed quantity, maintaining unchanged the temperature and volume of the system.
Thereby, the relation between the adsorbed amount and the pressure may be graphically
found at constant temperature, reported as adsorption isotherm. This method, called
volumetric or manometric, is the most widely used to measure the adsorption of gases and
was selected for our laboratory to study adsorption processes. By the gravimetric method,
the adsorbed quantity is measured from the mass gain during the process.
Natural Gas212
There is a detail that must be appointed because it would be helpful when interpreting what
it is being actually measured. Assuming than n moles of an adsorbable are put into contact
with a solid (adsorbent) at a certain volume V and pressure P where the adsorption occurs,
once the equilibrium is reached, it is possible to identify three zones with different
concentrations c =dn/dV, as shown in Figure 8a. Zone I corresponds to the region where the
adsorbent is located and none molecule of adsorbable is expected (c
s
=0). Zone II corresponds
to the adsorbed layer, focus of our interest, where the concentration is c
a
, which decreases as
z increases (c
a
=c(z)) until z=t. The zone III is at c
g
concentration, which is the concentration of
the adsorbable in absence of the adsorbent and depends only on P and T.
Knowing the area A, where the adsorbed layer is on the surface, as well as the thickness of
the adsorbed layer t, the volume of the adsorbed layer can be calculated as V
a
=A.t, from
where the adsorbed quantity in moles, can be deduced.
a
V t
aaa
dzcAdVcn
0 0
(3)
Fig. 8. Variation of the concentration, c, with the distance from the surface, z. a) Adsorbed
layer; b) Gibbs representation (from Rouquerol et al., 1999).
The total quantity of moles for the considered volume is:
gga
Vcnn
(4)
where V
g
is the gas volume that remains at zone III (f region indicated in Fig 8a) after the
adsorption process.
Therefore, in order to calculate n
a
it must be known the c
a
as z function (eq. 3) or V
g
and n
from eq. 4. However, the concentration profile of the adsorbed zone cannot be determined
through an assay, and a measure of the volume V
g
is complicated to obtain. This is because
when adsorption occurs, the decrease in the system pressure is due to the increase in the
molecules concentration (zone d of Figure 8a) at concentrations higher than c
g
. On the other
hand, the molecules of the zone e are at the same concentration than the adsorbable and do
not causes a pressure decrease. This would complicate the identification of the molecules
that are in the zone e and f, occupying these latter the volume V
g
.
To overcome this inconvenient, the Gibbs representation (Figure 8b) can be used. In this
case, the system of reference occupies the same volume than the actual but, at present, it is
only divided in two regions: I, the solid and II, the zone where the adsorbable is located. The
status of the adsorbable remains unknown (adsorbed or not), while it is separated by a
surface that is parallel to the adsorbent, called Gibbs dividing surface (GDS). The actual
volume occupies the same volume than the representation, V, which is the volume that the
molecules (n) occupy when put into contact with the solid at an initial pressure P
i
.
Afterwards, when the equilibrium is reached, a P
eq
value arises. The entire process follows
Figure 7.
Zone II of Figure 8b is the resulting scenario when P
eq
is reached. Then, the gas molecules
can be taken as part of one of two groups: the molecules that maintain the concentration of
the gas, c
g
, simulating that the adsorption phenomenon does not occur (zones e and f of
Figure 8b), and another group that includes the molecules showing a concentration higher
than c
g
, that are basically, “excess” molecules (zone e) called n
σ
. These are responsible for the
decrease of P
i
and the unique measurable molecules in an assay.
In conclusion, the number of “excess” molecules is the difference between the total number
of molecules and the number of molecules remaining at the same concentration of the gas
prior to be adsorbed:
Vcnn
g
(5)
Combining both schematic representations shown in Figure 8, it can be seen that the total
volume is the sum of the volume V
g
(zone III, Figure 8a) and V
a
(zone II Figure 8a). This
could be summarized as follows:
aggg
VcVcnn
(6)
From equation 4, it can be obtained the number of molecules from the adsorbed layer (n
a
) as
a function of the number of total molecules of the studied gas (n). Correlating eq. 4 and 6,
we obtain:
aga
Vcnn
(7)
At a low pressure assay, c
g
corresponds to a small value and V
a
<< V
g
.
Hence, from
equations 6 and 7, we find that:
nn
a
(8)
This does not occur at high pressures (pressures higher than the atmospheric), where eq. 7
remains valid.
It can be concluded that the measures that actually can be performed in an assay, are the
molecules present in the “excess” zone, shown in the Gibbs schema. Therefore, the
experimental data that can be graphed correspond to an excess isotherm, given by the n
σ
molecules. Sometimes the interest is focused on the absolute isotherm, particularly for
Adsorption of methane in porous materials as the basis for the storage of natural gas 213
There is a detail that must be appointed because it would be helpful when interpreting what
it is being actually measured. Assuming than n moles of an adsorbable are put into contact
with a solid (adsorbent) at a certain volume V and pressure P where the adsorption occurs,
once the equilibrium is reached, it is possible to identify three zones with different
concentrations c =dn/dV, as shown in Figure 8a. Zone I corresponds to the region where the
adsorbent is located and none molecule of adsorbable is expected (c
s
=0). Zone II corresponds
to the adsorbed layer, focus of our interest, where the concentration is c
a
, which decreases as
z increases (c
a
=c(z)) until z=t. The zone III is at c
g
concentration, which is the concentration of
the adsorbable in absence of the adsorbent and depends only on P and T.
Knowing the area A, where the adsorbed layer is on the surface, as well as the thickness of
the adsorbed layer t, the volume of the adsorbed layer can be calculated as V
a
=A.t, from
where the adsorbed quantity in moles, can be deduced.
a
V t
aaa
dzcAdVcn
0 0
(3)
Fig. 8. Variation of the concentration, c, with the distance from the surface, z. a) Adsorbed
layer; b) Gibbs representation (from Rouquerol et al., 1999).
The total quantity of moles for the considered volume is:
gga
Vcnn
(4)
where V
g
is the gas volume that remains at zone III (f region indicated in Fig 8a) after the
adsorption process.
Therefore, in order to calculate n
a
it must be known the c
a
as z function (eq. 3) or V
g
and n
from eq. 4. However, the concentration profile of the adsorbed zone cannot be determined
through an assay, and a measure of the volume V
g
is complicated to obtain. This is because
when adsorption occurs, the decrease in the system pressure is due to the increase in the
molecules concentration (zone d of Figure 8a) at concentrations higher than c
g
. On the other
hand, the molecules of the zone e are at the same concentration than the adsorbable and do
not causes a pressure decrease. This would complicate the identification of the molecules
that are in the zone e and f, occupying these latter the volume V
g
.
To overcome this inconvenient, the Gibbs representation (Figure 8b) can be used. In this
case, the system of reference occupies the same volume than the actual but, at present, it is
only divided in two regions: I, the solid and II, the zone where the adsorbable is located. The
status of the adsorbable remains unknown (adsorbed or not), while it is separated by a
surface that is parallel to the adsorbent, called Gibbs dividing surface (GDS). The actual
volume occupies the same volume than the representation, V, which is the volume that the
molecules (n) occupy when put into contact with the solid at an initial pressure P
i
.
Afterwards, when the equilibrium is reached, a P
eq
value arises. The entire process follows
Figure 7.
Zone II of Figure 8b is the resulting scenario when P
eq
is reached. Then, the gas molecules
can be taken as part of one of two groups: the molecules that maintain the concentration of
the gas, c
g
, simulating that the adsorption phenomenon does not occur (zones e and f of
Figure 8b), and another group that includes the molecules showing a concentration higher
than c
g
, that are basically, “excess” molecules (zone e) called n
σ
. These are responsible for the
decrease of P
i
and the unique measurable molecules in an assay.
In conclusion, the number of “excess” molecules is the difference between the total number
of molecules and the number of molecules remaining at the same concentration of the gas
prior to be adsorbed:
Vcnn
g
(5)
Combining both schematic representations shown in Figure 8, it can be seen that the total
volume is the sum of the volume V
g
(zone III, Figure 8a) and V
a
(zone II Figure 8a). This
could be summarized as follows:
aggg
VcVcnn
(6)
From equation 4, it can be obtained the number of molecules from the adsorbed layer (n
a
) as
a function of the number of total molecules of the studied gas (n). Correlating eq. 4 and 6,
we obtain:
aga
Vcnn
(7)
At a low pressure assay, c
g
corresponds to a small value and V
a
<< V
g
.
Hence, from
equations 6 and 7, we find that:
nn
a
(8)
This does not occur at high pressures (pressures higher than the atmospheric), where eq. 7
remains valid.
It can be concluded that the measures that actually can be performed in an assay, are the
molecules present in the “excess” zone, shown in the Gibbs schema. Therefore, the
experimental data that can be graphed correspond to an excess isotherm, given by the n
σ
molecules. Sometimes the interest is focused on the absolute isotherm, particularly for
Natural Gas214
comparison with theoretical calculations and it is obtained by counting n
a
. To conduct
assays at subatmospherical pressure, these two isotherms are coincident, but it is not valid
for high pressures.
The major interest in this chapter is to use these concepts to achieve adsorption isotherms of
methane at low and high pressures. Afterwards, it is possible to obtain information
regarding the possibilities of natural gas storage with the adsorbents under study.
2.2 Porous materials
Adsorption is a superficial process and a crucial characteristic for the adsorbents is their
high adsorption capacities. Then, the adsorbents require an elevated exposed surface per
gram of material, which is called specific surface area (S
esp
) and is expressed in cubical
centimeters of adsorbate per gram of adsorbent.
The smaller the elemental constituents of the solid are, the greater the specific surface area
is. This characteristic may be shown in fine particles, e.g. powders, as well as solids with
small holes, which sizes can range from a few Angstroms to nanometers. These are named
porous solids.
The IUPAC (Sing et al., 1985), depending on the transversal dimension of the pores in these
solids (d), present the following classification:
500
50020
20
dmacropores
dmesopores
dmicropores
solids
A solid may exhibit different kinds of pores. Rouquerol et al., 1994 reports diverse
possibilities (Figure 9) where the contribution to the specific surface area is variable. The
more rough the surface is or the smaller the pores are the greater is the contribution to the
S
esp
.
Fig. 9. Types of pores that a solid may exhibit Rouquerol et al., 1994.
Up to present, the adsorption phenomenon has only been studied from the perspective of a
plane solid surface and a gas. However, for porous solids the gas molecules are “surrounded”
by the walls of the pores, being considerably higher the interaction forces. In order to model
this interaction, it must be supposed that the potential of the walls has an attractive and a
repulsive term, similar to the aforementioned potential style described by Lennard Jones
(Figure 6). As the pore becomes smaller, the potentials of the gas-solid interaction of each
wall overlap. This, results in further potentiation of the adsorption phenomenon, which
turns porous materials into excellent adsorbents. Figure 10 shows a schema of the variation
of the potential of the solid-gas interaction for a plane surface and a porous solid while the
separation among layers, decreases.
Fig. 10. Potential configuration according to the surface.
Therefore, besides the specific surface, it becomes necessary to study the porosity of the
sample to provide comprehensive information related to the adsorption capacity.
2.3 Gas adsorption for the characterization of materials
The textural characteristics of the solids can be studied by gas adsorption, usually with
gaseous nitrogen at 77K, at pressures between 10
-4
Torr to pressures near to the atmospheric.
As a result, adsorption isotherms may be obtained and reflect the quantity of adsorbed gas
(cm
3
/g) as a function of the relative pressure (P/P
0
) at constant temperature, where P
0
is the
saturation pressure. The appearance of the isotherm is directly related to the characteristics
of the solid. An extensive work conducted by Brunauer, Deming, Deming and Teller
(Brunauer et al., 1940), reported that a isotherm can be described by one or a combination of
the basic shapes illustrated in Figure 11.
Adsorption of methane in porous materials as the basis for the storage of natural gas 215
comparison with theoretical calculations and it is obtained by counting n
a
. To conduct
assays at subatmospherical pressure, these two isotherms are coincident, but it is not valid
for high pressures.
The major interest in this chapter is to use these concepts to achieve adsorption isotherms of
methane at low and high pressures. Afterwards, it is possible to obtain information
regarding the possibilities of natural gas storage with the adsorbents under study.
2.2 Porous materials
Adsorption is a superficial process and a crucial characteristic for the adsorbents is their
high adsorption capacities. Then, the adsorbents require an elevated exposed surface per
gram of material, which is called specific surface area (S
esp
) and is expressed in cubical
centimeters of adsorbate per gram of adsorbent.
The smaller the elemental constituents of the solid are, the greater the specific surface area
is. This characteristic may be shown in fine particles, e.g. powders, as well as solids with
small holes, which sizes can range from a few Angstroms to nanometers. These are named
porous solids.
The IUPAC (Sing et al., 1985), depending on the transversal dimension of the pores in these
solids (d), present the following classification:
500
50020
20
dmacropores
dmesopores
dmicropores
solids
A solid may exhibit different kinds of pores. Rouquerol et al., 1994 reports diverse
possibilities (Figure 9) where the contribution to the specific surface area is variable. The
more rough the surface is or the smaller the pores are the greater is the contribution to the
S
esp
.
Fig. 9. Types of pores that a solid may exhibit Rouquerol et al., 1994.
Up to present, the adsorption phenomenon has only been studied from the perspective of a
plane solid surface and a gas. However, for porous solids the gas molecules are “surrounded”
by the walls of the pores, being considerably higher the interaction forces. In order to model
this interaction, it must be supposed that the potential of the walls has an attractive and a
repulsive term, similar to the aforementioned potential style described by Lennard Jones
(Figure 6). As the pore becomes smaller, the potentials of the gas-solid interaction of each
wall overlap. This, results in further potentiation of the adsorption phenomenon, which
turns porous materials into excellent adsorbents. Figure 10 shows a schema of the variation
of the potential of the solid-gas interaction for a plane surface and a porous solid while the
separation among layers, decreases.
Fig. 10. Potential configuration according to the surface.
Therefore, besides the specific surface, it becomes necessary to study the porosity of the
sample to provide comprehensive information related to the adsorption capacity.
2.3 Gas adsorption for the characterization of materials
The textural characteristics of the solids can be studied by gas adsorption, usually with
gaseous nitrogen at 77K, at pressures between 10
-4
Torr to pressures near to the atmospheric.
As a result, adsorption isotherms may be obtained and reflect the quantity of adsorbed gas
(cm
3
/g) as a function of the relative pressure (P/P
0
) at constant temperature, where P
0
is the
saturation pressure. The appearance of the isotherm is directly related to the characteristics
of the solid. An extensive work conducted by Brunauer, Deming, Deming and Teller
(Brunauer et al., 1940), reported that a isotherm can be described by one or a combination of
the basic shapes illustrated in Figure 11.