Advances in Lasers and Electro Optics Part 8 doc
Bạn đang xem bản rút gọn của tài liệu. Xem và tải ngay bản đầy đủ của tài liệu tại đây (8.19 MB, 50 trang )
NIR Single Photon Detectors with Up-conversion Technology
and its Applications in Quantum Communication Systems
335
Korneev, A.; Kouminov, P.; Matvienko, V.; Chulkova, G.; Smirnov, K.; Voronov, B.;
Gol’tsman, G. N.; Currie, M.; Lo, W.; Wilsher, K.; Zhang, J.; Słysz, W.; Pearlman, A.;
Verevkin, A. & Sobolewski, R. (2004). Sensitivity and gigahertz counting
performance of NbN superconducting single-photon detectors. Appl. Phys. Lett.
Vol. 84, pp 5338-5340
Langrock, C.; Diamanti, E.; Roussev, R. V.; Yamamoto, Y.; Fejer, M. M. & Takesue, H. (2005).
Highly efficient single-photon detection at communication wavelengths by use of
upconversion in reverse-proton-exchanged periodically poled LiNbO3
waveguides. Opt. Lett. Vol. 30, pp. 1725-1727
Lacaita, A.; Zappa, F.; Cova, S. & Lovati, P. (1996) Single-photon detection beyond 1 μm:
performance of commercially available InGaAs/InP detectors. Appl. Opt., Vol. 35,
pp 2986-2996
Lita, A. E.; Miller, A. J. & Nam, S. W. (2008). Counting near-infrared single-photons with
95% efficiency,” Opt. Express, Vol. 16, pp3032-3040
Ma, L.; Nam, S.; Xu, H.; Baek, B.; Chang, T.; Slattery, O.; Mink, A. & Tang, X. (2009). 1310 nm
differential phase shift QKD system using superconducting single photon
detectors. New Journal of Physics, Vol. 11, pp 054020
Martin, J. & Hink P. (2003) Single-Photon Detection with MicroChannel Plate Based Photo
Multiplier Tubes. Workshop on Single-Photon: Detectors, Applications and Measurement
Methods, NIST.
Micheli, M. P. (1997) χ
2
effects in waveguides. Quantum Semiclassic. Opt, Vol. 9, pp 155–164.
Midwinter, J. & Warner, J. (1967). Up-conversion of near infrared to visible radiation in
lithium-meta-niobate. J. Appl. Phys. Vol 38, pp 519-523
Mink, A.; Tang, X.; Ma, L.; Nakassis, T.; Hershman, B.; Bienfang, J. C.; Su, D.; Boisvert, R.;
Clark, C. W. & Williams, C. J. (2006). High speed quantum key distribution system
supports one-time pad encryption of real-time video. Proc. of SPIE, Vol. 6244,
62440M,
Nakassis, A., Bienfang, J. & Williams, C. (2004). Expeditious reconciliation for practical
quantum key distribution. Proc. of SPIE, Vol. 5436, pp. 28-35.
Takesue, H.; Nam, S.; Zhang, Q.; Hadfield, R. H.; Honjo, T.; Tamaki, K. & Yamamoto, Y.
(2007). Quantum key distribution over a 40-dB channel loss using superconducting
single-photon detectors. Nature Photonics, Vol. 1, pp 343-348
Tang, X.; Ma, L.; Mink, A.; Nakassis, A.; Xu, H.; Hershman, B.; Bienfang, J.; Su, D.; Boisvert,
R.; Clark, C. & C. Williams. (2006). Experimental study of high speed
polarizationcoding quantum key distribution with sifted-key rates over Mbit/s.
Optics Express, Vol. 14, No.6, pp 2062-2070
Tanzilli, S.; Tittel, W.; Halder, M.; Alibart, O.; Baldi, P.; Gisin, N. & Zbinden, H. (2005). A
photonic quantum information interface. Nature, Vol 437, pp 116-120
Thew, R. T.; Tanzilli, S.;, Krainer, L.; Zeller, S. C.; Rochas, A.; Rech, I.; Cova, S.; Zbinden, H.
& Gisin, N. (2006). Low jitter up-conversion detectors for telecom wavelength GHz
QKD. New J. Phys. Vol. 8, pp 32.
Vandevender, A. P. & Kwiat, P. G. (2004). High efficiency single photon detection via
frequency up-conversion. J. Mod. Opt., Vol. 51, 1433-1445
Wiesner, S. (1983). Conjugate coding. Sigact News, Vol. 15, pp 78-88
Advances in Lasers and Electro Optics
336
Wiza, J. (1979). Microchannel plate detectors. Nuclear Instruments and Methods Vol. 162: pp
587-601
Xu, H.; Ma, L.; Mink, A.; Hershman, B. & Tang, X. (2007). 1310-nm quantum key distribution
system with up-conversion pump wavelength at 1550 nm. Optics Express, Vol 15,
No.12, pp 7247- 7260
Yuan, Z. L.; Dixon, A. R.; Dynes, J. F.; Sharpe, A. W. & Shields, A. J. (2008). Gigahertz
quantum key distribution with InGaAs avalanche photodiodes. Appl. Phys. Lett.
Vol. 92, 201104.
16
All-Optical Signal Processing with
Semiconductor Optical Amplifiers
and Tunable Filters
Xinliang Zhang, Xi Huang, Jianji Dong, Yu Yu, Jing Xu and Dexiu Huang
Wuhan National Laboratory for Optoelectronics,
Huazhong University of Science and Technology
P.R.China
1. Introduction
All-optical signal processing has been and is receiving more and more attention all over the
world because it can increase the capacity of the optical networks greatly in avoiding of the
Optical-Electrical-Optical (O/E/O) conversion process, and it can also reduce the system
power consumption to a great extend and then increase the system stability. All-optical
signal processing can be widely used in optical signal regeneration and switching in next-
generation optical networks (Yoo 1996; Danielsen et al. 1998; Saruwatari 2000), such as
Optical Time Division Multiplexing (OTDM), Optical Orthogonal Frequency Division
Multiplexing (OOFDM), Optical Code Division Multiplexing Accessing (OCDMA), Optical
Packet Switching (OPS) and so on. There are many different elemental functions in all-
optical signal processing: all-optical wavelength conversion, all-optical logic operation, all-
optical 3R regeneration, all-optical format conversion, all-optical sampling, all-optical time
demultiplexing, all-optical buffering, etc. It should be mentioned that all-optical wavelength
conversion is one of the most important technologies, and it is the basis of other functions.
In past two decades, many schemes have been proposed to demonstrate all-optical signal
processing functions, and nonlinearities in passive and active waveguides, such as high
nonlinear fiber (Olsson et al., 2001), periodic-poled LiNbO
3
(Langrock et al., 2006), silicon-
based waveguides (Haché & Bourgeois 2000), chalcogenide-based waveguides (Ta'eed et al.,
2006) and semiconductor optical amplifiers (SOAs) (Liu et al., 2006; Stubkjaer 2000) , are
elemental mechanisms for these schemes. SOA is one of powerful candidates for all-optical
signal processing because of its various nonlinear effects, low power consumption, small
footprint and possibility to be integrated, therefore, SOAs have been receiving the most
widely attention and have been exploited to realize nearly all functions for all-optical signal
processing.
In SOAs, nonlinear effects such as cross-gain modulation (XGM), cross-phase modulation
(XPM), four-wave mixing and transient cross-phase modulation can all be exploited to
demonstrate all-optical signal processing functions (Durhuus et al., 1996; Stubkjaer 2000).
Taking all-optical wavelength conversion as an example, XGM wavelength conversion has
some advantages such as simple structure, large dynamic optical power range, high
conversion efficiency and large operation wavelength range, but it also has some problems
Advances in Lasers and Electro Optics
338
such as extinction ratio degradation and chirp (Durhuus et al., 1996); XPM wavelength
conversion has some characteristics such as good output performance but small dynamic
range and difficult to control and fabricate (Durhuus et al., 1996); FWM wavelength
conversion (Kelly et al., 1998) is bitrate and format transparent but low conversion efficiency
and narrow operation wavelength range; transient XPM conversion is inherent high
operation speed but low conversion efficiency.
While used in all-optical signal processing, the input probe signals of SOAs will experience
amplitude and phase variations which are induced by carrier density or distribution
variations taken by other input pump signals. The optical spectra of the input signals will
experience broadening and shifting processes in which the information to be processed is
included. Therefore, the SOA can be regarded as spectrum transformer. Combing with
appropriate filtering process, all-optical signal processing function can be realized
correspondingly. For different filtering processes, we can demonstrate different signal
processing functions.
Regarding filtering processes, there are many schemes to realize and demonstrate, such as
BPF filters, microring resonators, delay interferometers (fiber-based, silicon waveguide
based, LiNbO
3
waveguide based, PMF loop mirror, etc.), FP etalons, dispersive fibers,
arrayed waveguide grating (AWG) and so on. Usually we should cascade two or more
different kinds of filters to get better output results. It is very important to choose and
optimize the filtering processes to realize desired functions and improve the output
performance.
In this chapter, we theoretical and experimental analyzed all-optical signal processing with
SOAs and tunable filters where SOAs were regarded as spectrum transformers and tunable
filters were used to realize different filtering processes and then different signal processing
functions. In section 2, complicated theoretical model for SOA is presented, and many
nonlinear effects are taken into consideration, such as carrier heating, spectral hole burning,
etc. On the other hand, a theoretical model for optimizing the filtering process is also
presented. These two theoretical models are value for any different signal processing
functions. In section 3, experimental research on all-optical wavelength conversion is
discussed and analyzed. In section 4, experimental results for all-optical logic operation are
presented. Finally, multi-channel all-optical regenerative format conversion is experimental
investigated in section 5. Some remarks are also given in final conclusions.
2. Theoretical model
In order to represent the generality for different kinds of signal processing functions, we
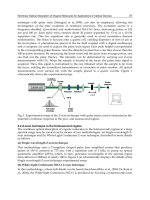
establish a general theoretical model based on SOA’s model and filter’s model. As shown in
Fig.1, a SOA is cascaded with two basic filters: an optical bandpass filter (OBF) and a delay
Fig. 1. Schematic diagram for signal processing with SOA and filters
SO
A
pump
probe
λ
1
λ
2
DI
O
BF
All-Optical Signal Processing with Semiconductor Optical Amplifiers and Tunable Filters
339
interferometer (DI). These two filters are the most possible to be used to realize signal
processing functions. The theoretical model corresponding to Fig. 1 can be exploited to
analyze any kinds of signal processing functions. The key point of this model is calculating
out the output signal spectrum after the SOA based on a complicated SOA model. Only all
kinds of nonlinear effects are taken into account, the accuracy of the output spectrum can be
believed. The final output signal spectrum can be analyzed with the help of transmission
functions of the cascaded two filters. With iFFT tool, we can get output signal waveform in
time domain.
2.1 Theoretical model of SOAs
Based on theoretical models in literatures (Mork & Mark 1995; Mork, et al., 1994; Mork &
Mark 1992; Agrawal & Olsson 1989; Mork & Mecozzi 1996), we can derive theoretical model
for SOAs in which ultrafast nonlinear effects are taken into account. Firstly, the propagation
equation for the input signal in the SOA can be derived as the following equation:
{
2
22 2 int
A(z, )
11 1 1 1
(,) (1 ) (,) (,) (,)
22 2 2 2
vv
gz i Az n z n z
cc
z
τ
τ
β
ατ
β
τ
β
τα
∂
=Γ −Γ + −Γ −Γ −
∂
[ (,) (,) (,)] (,)
2
NCHCHSHBSHB
i
g
zgz gzAz
ατα τα τ τ
⎫
⎬
⎭
++Δ+Δ (1)
In Eq.(1), the first to fifth terms on the right hand side represent the linear gain, two-photon
absorption (TPA), FCA in conduction band, FCA in valence band and linear absorption loss
respectively. The last three terms represent phase modulation process accompanied with
linear gain variation, carrier heating and spectral hole burning, which are corresponding to
parameters α, α
CH
and α
SHB
respectively.
In order to calculate the gain coefficient, the local carrier densities should be calculated
out firstly. The local carrier densities satisfy the following two equations (Mork, et al.,
1994):
1
(,) (,) (,)
(,) (,)
c
cc
gccg
c
nnz nz z
vgz S n z vS
τττ
ττβ
ττ
∂−
=− − −
∂
(2)
1
(,) (,) (,)
(,) (,)
v
vv
gvvg
v
nnz nz z
vgz S n z vS
τττ
ττβ
ττ
∂−
=− − −
∂
(3)
The first terms on the right hand sides of Eq. (2)and (3) describe the relaxation process of the
electrons and holes to their quasi-equilibrium values (,)
c
n z
τ
and (,)
v
n z
τ
, respectively.
These relaxation processes are driven by the electron-electron and hole-hole interaction with
time constant of τ
1c
, τ
1v
. The second terms describe carrier consumption due to stimulated
emission, and the last terms corresponding to carrier consumption due to two photon
absorption.
In this theoretical model, the gain can be expressed as the following equations:
Advances in Lasers and Electro Optics
340
00
**
00
**
0
0
1
(,) ( )[ (,) (,) ]
1
(,) ( )[ (,) (,) ]
1
(,) ( )[ (,) (,)]
1
(,) ( )[ ]
cv
g
Ncv
g
CH c c v v
g
SHB c c v v
g
a
a
a
a
gz n z n z N
v
gz nz nz N
v
gz nnz nnz
v
gz nnnn
v
τωτ τ
τωτ τ
τω τ τ
τω
⎧
⎪
⎪
⎪
⎪
⎪
⎪
⎨
⎪
⎪
⎪
⎪
⎪
⎪
⎩
=+−
= + −
Δ= −+−
Δ = − + −
(4)
where a(ω
0
) is the differential gain coefficient, and N
0
is the transition density of states in
optically coupled region. g is total gain dynamics, g
N
the gain changes accompanied with
carrier density variation due to interband recombination, Δg
CH
the gain changes due to CH,
Δg
SHB
the gain changes due to SHB.
In order to solve Eqs. (2) ~ (4), (,)
R
nz
τ
,
*
(,)
R
nz
τ
, [, ]Rcv∈ should be got firstly, and they can
be defined as:
0
(,) ( , (,), )
R
f
RR R
nz NFE Tz E
ττ
= (5)
*
0
(,) ( , , )
R
f
RL R
nz NFE TE
τ
= (6)
where E
fc
and E
fv
are the quasi-Fermi level in the conduction band and the valence band,
respectively. T
C
and T
V
are the temperature of the carriers in the conduction band and the
valence band. T
L
is the lattice temperature. E
C
and E
V
are the corresponding transition
energies in the conduction band and the valence band. F is the Fermi-Dirac distribution
function shown as follows:
1
(,,)
1exp( )
b
FTE
E
kT
μ
μ
=
−
+
(7)
To calculate instantaneous carrier temperature (T
R
) and quasi-Fermi level (E
fR
), we need
calculate the total electron-hole pair density N and the energy state densities U. The total
electron-hole pair density satisfies the following equation:
2
2
(,)
(,)
g
s
Nz
IN
vgz S v S
g
eV
τ
τ
β
ττ
∂
=−− +
∂
(8)
It should be noted that, N(z,
τ
) counts all the electron-hole pairs, including those that are not
directly available for the stimulated emission.
The energy state densities satisfy the following two questions:
2
022
(,) (,) (,)
(,)
c
c c
c c cg cg
hc
UUz Uz z
nS Evgz S E v S
τττ
βω τ β
ττ
∂−
=− + −
∂
(9)
2
022
(,) (,) (,)
(,)
c
v c
vvvg vg
hv
UUz Uz z
nS Ev gz S E v S
τττ
βω τ β
ττ
∂−
=− +−
∂
(10)
All-Optical Signal Processing with Semiconductor Optical Amplifiers and Tunable Filters
341
In these equations, the first terms describe the change in energy density due to the stimulated
emission. The second terms depict the changes due to FCA and the third terms account for the
TPA. The last terms represent the relaxation to equilibrium due to carrier-phonon interactions
with time constant of τ
hc
and τ
hv
. The equilibrium energy densities are defined as:
22
1
((,),(,), )
22
cc
kk
UFEzTz
c
fc L
Vm m
k
ττ
∗∗
=
∑
(11)
22
1
( (,), (,), )
22
kk
UFEzTz
v
fv L
V
mm
k
vv
ττ
=
∑
∗∗
(12)
The total carrier density and total energy density need to be self consistently calculated in
each time step. We can calculate the quasi-Fermi level and instantaneous temperature of the
electrons in conduction band based on self consistently theory.
2
1
(,) ( (,), (,), )
2
22
1
(,) ( (,), (,), )
22
k
Nz FE z T z
fc c
V
m
k
c
kk
Uz FE z Tz
cfcc
V
mm
k
cc
τττ
τττ
⎧
⎪
=
∑
∗
⎪
⎪
⎨
⎪
=
∑
⎪
∗∗
⎪
⎩
(13)
Similarly, we can also obtain the instantaneous Fermi levels and temperatures in the valence
band.
2
2
(,) ( (,), (,), )
2
22
2
(,) ( (,), (,), )
22
v
vv
k
Nz FE z T z
fv v
Vm
k
kk
Uz FE z Tz
vfvv
Vm m
k
τττ
τττ
∗
∗∗
⎧
⎪
=
∑
⎪
⎪
⎨
⎪
=
∑
⎪
⎪
⎩
=
==
(14)
It should be noted that, the factor of 2 on the right hand of Eq.(14) is observed, because we
consider two sub-bands in valence band including heavy hole band and light hole band.
Using Eqs(1-14),we can numerically simulate the dynamics characterization in SOA active
region and the signal propagation.
2.2 Theoretical model for filtering
OBFs and DIs are typical filters for all-optical signal processing, especially in ultrahigh
speed operation scheme. The transmission function of the BPF and the DI can be described
as the following two expressions.
1
2
0
1
() [exp()exp(2 )]
2
2
() exp[2ln2( )]
Fii
f
F
B
ω
φ
πτω
ωω
ω
⎧
=+
⎪
⎪
⎨
−
⎪
=−
⎪
⎩
i
(15)
Advances in Lasers and Electro Optics
342
where F
1
and F
2
are the transmission function of DI and band-pass filters, respectively.
φ
is
the phase difference between two arms of the DI,
τ
is the time delay of two arms of the DI.
ω
f
is the central angle frequency of the BPF, B
0
is 3 dB bandwidth of the BPF.
The optical field after SOA can be described as:
0
() exp[( ())]
out out NL
Et P i t t
ω
=+Φ (16)
Based on Fast Fourier Transformer (FFT), the optical spectrum of the output signal after the
SOA can be obtained as
() [ ()]
out out
E FFT E t
ω
= (17)
After optical filtering process, the optical spectrum of the output signals after the two
cascaded filters can be described as:
12
() () () ()
opt o
EEFF
ωωωω
= ii (18)
Then, based on inverse Fast Fourier Transformer (iFFT), the output signal waveform in time
domain can be calculated out.
2
1
() [ ( )]
opt opt
Pt FE
ω
−
= (19)
It should be noted that sometimes we should exploit more filters to optimize the output
performance, but, the analytical process is identical, adding the transmission function of the
new filter in Eq. 17 can get the correct output results.
2.3 Applications in all-optical signal processing
For some applications, the configuration and mechanism are fixed and known to us, we can
analyze the output performance based on above theoretical model. The analytical process
based on the above SOA model and filter model can be illustrated as the following flow
diagram.
As shown in Fig.2, based on above SOA theoretical model, we can get output signal
waveforms in time domain from SOA and phase variation information is also included in
the output signal filed. Using FFT tool, we can calculate out the signal spectra. Combing
with the filter model iFFT tool, we can simulate out the output signal field. We can optimize
the SOA parameters or filter parameters to improve the output performance. This process
can be used to optimize the SOA structure and filter shape for special applications.
On the other hand, we can also use the above theoretical model to explore some novel
schemes for special signal processing functions. The analytical process can be illustrated as
following flow diagram. As shown in Fig.3, for special signal processing functions, input
signal and output signal are fixed and known to us, their spectra can be calculated out based
on FFT tool, so the transmission functions of the potential schemes can be determined by
input spectra and output spectra. Usually, the spectrum transformation process of the SOA
is fixed and can be determined by the above SOA model. Using some iteration algorithms,
the filtering process and related filters can be optimized.
All-Optical Signal Processing with Semiconductor Optical Amplifiers and Tunable Filters
343
Fig. 2. Analytical process for all-optical signal processing schemes with fixed configurations
Fig. 3. Analytical process diagram for exploring novel schemes
FFT tool, Input signal
spectrum
FFT tool, output signal
spectrum
Transmission function =
out
p
ut
/
in
p
ut
SOA and filter
transmission process
Scheme
p
ro
p
osal
Scheme
o
p
timization
Input signals and
operational
d
SOA model , ouput
signal waveform
FFT tool, Signal
S
p
ectrum after SOA
Filter Model, signal
spectrum after filter
iFFT tool, output
signal
Parameters
optimization
SOA Parameters
Optimization
Advances in Lasers and Electro Optics
344
3. All-optical wavelength conversion with SOAs and filters
All-optical wavelength conversion can be regarded as the most important signal processing
function because it is the basis of other signal processing functions. In this section, inverted
and non-inverted wavelength conversion at 40Gb/s based on different filter detuning were
investigated firstly (Dong et al., 2008), then, experimental results on 80Gb/s wavelength
conversion and related filtering optimization process are discussed (Huang et al., 2009).
3.1 Bi-polarity wavelength conversion for RZ format at 40Gb/s
Fig. 4 shows the schematic diagram of both inverted and non-inverted wavelength
conversion (Dong et al., 2008). A CW probe signal and a data signal with RZ format are
launched into an SOA. The following OBF has some detuning to the probe signal with the
central wavelength
detc
λλ
+Δ
, where
det
λ
Δ
is the detuning value from probe wavelength at
c
λ
. The input 40Gb/s RZ signal will induce transient nonlinear phase shifts and intensity
modulation to the probe signal via cross phase modulation (XPM) and cross gain
modulation (XGM) in the SOA. The nonlinear phase shifts will result in a chirped converted
signal with the broadened spectrum. The leading edges of the converted probe light are red-
shifted, whereas the trailing edges are blue-shifted. Whether the output converted signal is
inverted or non-inverted depends on the detuning value.
Fig. 4. (a) Operation principle of the bi-polarity wavelength conversion, (b) variation of
probe spectrum in the non-inverted wavelength conversion
On the one hand, the wavelength shift of the chirped probe occurs only in the
leading/trailing edges of input RZ signals. When the data signal is mark, the probe
spectrum will be broadened with sideband energy. If the OBF is detuned far away from the
probe wavelength so as to select the sideband energy at
detc
λλ
+Δ
, the OBF output will be
mark. When the data signal is space, there is no instantaneous frequency shift, and then the
OBF output is space, as shown in Fig. 4(b). Therefore, the converted signal will keep in-
phase to the input RZ signal. That is non-inverted wavelength conversion.
On the other hand, the XGM will result in the inverted wavelength conversion with
relatively slow recovery without the OBF detuning. However, the amplitude recovery can
be accelerated and the pattern effects can be eliminated if the OBF is slightly blue shifted.
The reason can be explained in Fig. 5. The dotted and dashed lines are the SOA gain and
chirp, respectively. When the pulse starts at point A, the SOA carrier depletes and the gain
reaches the pit at point B. In time slot from A to B, the probe experiences red chirp and the
blue shifted OBF attenuates the probe power. After the pulse duration stops, the gain starts
All-Optical Signal Processing with Semiconductor Optical Amplifiers and Tunable Filters
345
to recover slowly. Assume that the probe signal gets its maximum blue chirp at point C.
After point C, the chirp decreases toward zero, then the blue shifted OBF decreases the
transmittance. But the gain recovery is going on. Therefore, the blue shifted OBF can balance
the power of blue chirped component and the probe power during gain recovery. As a
result, the net power at the OBF output is approximately constant (see time slot from C to
D). If the SOA and the OBF are treated as a whole system, the amplitude recovery of the
system is much faster than the SOA gain. The fast amplitude recovery technique is also
suitable for NRZ format. The detail explanation can be found in reference (Liu et al., 2006).
Fig. 5. Principle of accelerating the amplitude recovery.
The experimental setup for bi-polarity wavelength conversion is shown in Fig. 6. Tunable
laser diode (LD1) generates a CW probe light at 1557.32nm with the power of 0dBm.
Tunable LD2 generates another light source at 1563.5nm, which is modulated by two
LiNbO
3
Modulators at 40Gb/s to form a 2
31
-1 RZ pseudo random binary sequence (PRBS)
signal, then an erbium-doped fiber amplifier (EDFA) and an attenuator (ATT) are used to fix
the RZ output average power at -1.8dBm. The 40Gb/s RZ signal with 8ps-wide pulses is
combined with the probe light, and launched into the SOA. The SOA (Kamelian NL-SOA) is
biased at 200mA, and its 90%~10% recovery time, defined as the time needed for the gain
compression to recover from 90% to 10% of the initial compression, is about 60ps, which is
longer than one bit period. The small signal gain@1550nm is 22dB. A tunable OBF1 with
bandwidth of 0.32nm follows the SOA. The OBF1 has somewhat detuning to the probe
signal to obtain high speed wavelength conversion. Another EDFA and an OBF with 1nm
Fig. 6. Experimental setup for bi-polarity wavelength converters at 40Gb/s. BPG: bit pattern
generator; ATT: attenuator; OC: optical coupler; OSA: optical spectrum analyzer; CSA:
communication signal analyzer.
Advances in Lasers and Electro Optics
346
bandwidth are used to amplify the converted signal power and eliminate the crosstalk.
Finally, the optical spectrum analyzer (OSA) and communication signal analyzer (CSA) are
used to observe the optical spectrum and waveform of the converted signal.
Fig. 7 shows the experimental results of both inverted and non-inverted wavelength
conversion. The left column is the captured waveforms whose time scale is 52ps/div, and
the right column is the corresponding eye diagrams whose time scale is 20ps/div. Fig. 7(i)
shows the waveform of input 40Gb/s RZ signal. When the OBF1 detuning is -0.3nm (blue
shifted) and +0.4nm (red shifted) respectively, the non-inverted wavelength conversion is
observed in Fig. 7(ii) and (iv). Good eye diagram is shown in Fig. 7(ii) while some pattern
effects occur in Fig. 7(iv). We can see the consecutive marks
1, 2, 3 show a decreasing
amplitude. When the OBF1 is slightly blue shifted by 0.1nm, the output waveform becomes
inverted and no pattern effects occur, shown in Fig. 7(iii). When the OBF1 has the same
central wavelength to the probe carrier, the output waveform has very serious pattern
effects, shown in Fig. 7(v). Therefore a slightly blue shifted OBF can accelerate the amplitude
recovery in the inverted wavelength conversion.
Fig. 7. Waveforms of converted signal with different detuning, (i) the input RZ waveform,
(ii)-(v) are the output waveforms of converted signal when the OBF1detuning is -0.3nm, -
0.1nm, +0.4nm, and 0nm, respectively. The left column and right column are the captured
waveforms and eye diagrams.
The experimental results can be explained from the spectrum. Fig. 8 shows the spectra of
converted signal when the OBF1 is detuned. The probe spectra before and after the SOA are
shown in Fig. 8(a). At the SOA output, the probe spectrum is broadened asymmetrically due
to the XPM. The output spectra of converted signals are shown in Fig. 8(b)-(e)
corresponding to the OBF1 detuning -0.3nm, -0.1nm, +0.4nm, and 0nm, respectively. In Fig.
8(b), the blue sideband of converted signal becomes dominant with the assistance of the blue
shifted OBF1, therefore good eye diagram could be observed. While in Fig. 8(d), the OBF1
cannot suppress the probe carrier. The crosstalk between red sideband peak and probe
carrier will result in the pattern effects in time domain. In Fig. 8(b) and (d), the OBF1
detuning is different for achieving the best non-inverted wavelength conversion because of
the asymmetric probe spectrum at the SOA output. Besides, the negative slope of OBF1 is
All-Optical Signal Processing with Semiconductor Optical Amplifiers and Tunable Filters
347
larger than the positive slope, so the blue shifted OBF is easy to suppress the probe carrier,
but red shifted OBF is not. In Fig. 8(c), the probe carrier keeps dominant, so the output
waveform becomes inverted.
The non-inverted wavelength conversion with blue shifted OBF shows better performance
than red shifted OBF. This can be explained with the chirp characteristics. Fig. 9(a) shows
the input RZ signal with four consecutive bits “1”, and Fig. 9(b) shows the probe phase
variation at the SOA output. One can see that the phase increases fast in the leading edge,
which corresponds to carrier depletion. However the phase decreases slowly in the trailing
edge, which results from the carrier recovery. Fig. 9(c) shows the probe chirp, which is the
first order derivative of the phase variation by contrariety. With consecutive “1” pulses
injection, the carrier depletion decreases, then the red peak chirp decreases as well. This
leads to the decreasing amplitude of the converted pluses by means of the red OBF transfer
function (see
1, 2, 3 of the red OBF), and the converted pulses show serious pattern
effects. On the other hand, one notices that the blue peak chirp increases very slowly, and
remains constant approximately. This results from the similar carrier recovery under
consecutive “1” pulses injection. By means of the blue OBF transfer function, the amplitude
of converted pulses remains constant (see
1, 2, 3 of the blue OBF). Therefore, the non-
inverted wavelength conversion performance is better with blue shifted OBF than with red
shifted OBF.
Fig. 8. Spectra of converted signal with different detuning, (a) the probe spectrum before
and after SOA, (b)-(e) are the output spectra of converted signal when the OBF1 detuning is
-0.3nm, -0.1nm, +0.4nm, and 0nm, respectively.
Advances in Lasers and Electro Optics
348
Fig. 9. Comparison of blue shifted OBF and red shifted OBF by frequency-amplitude
conversion at the OBF slopes, (a) consecutive “1” pulses, (b) phase evolution, (c) chirp
evolution, (d) frequency-amplitude conversion.
The wavelength tunability is further investigated in our experiment. For ease of discussion,
we only adjust the wavelength of tunable LD2. We investigate the output extinction ratio
(ER) under the optimal OBF1 detuning, as shown in Fig. 10. The output ER fluctuates
around 7dB in the whole C-band (1528-1563nm), except the near region of RZ wavelength.
The inset of Fig. 10 shows the SOA amplified spontaneous emission (ASE) spectrum, which
reveals that the SOA gain is low at the shorter wavelength. Therefore the ER decreases at
shorter wavelength. Our experiment scheme cannot complete the wavelength conversion of
the same wavelength since the OBF cannot separate the probe and signal channels at the
same wavelength.
Fig. 10. Output ER as a function of the input signal wavelength when the OBF1 detuning is -
0.3nm, -0.1nm, and +0.4nm, respectively. The inset is the SOA ASE spectra at different bias
currents.
All-Optical Signal Processing with Semiconductor Optical Amplifiers and Tunable Filters
349
From Fig. 10, we can see that the output ER is not very high in the three kinds of wavelength
converters. The reasons resulting in low ER are quite different between inverted wavelength
conversion and non-inverted wavelength conversion. For non-inverted wavelength
conversion, the OBF1 does not have a sharp slope, which could not separate the sideband
signal from the probe spectrum completely, as shown in Fig. 8(b) and (d). Therefore, the
crosstalk between the sideband signal and the probe carrier will degrade the output ER. For
inverted wavelength conversion, we need ultrashort pulse injection to enhance the T-XPM
effect and to generate large chirp of the probe signal. However, the 8ps-wide input pulses
are not narrow enough to obtain inverted wavelength conversion with large ER. We believe
the output ER could be improved if the OBF slope is optimized and the input RZ pulses are
compressed as narrow as possible.
3.2 80Gb/s wavelength conversion with SOA and cascaded filters
1ps
40Gbit/s
High speed
Fiber Laser
MO D
40Gbit/s PRBS 2
7
-1
40Gà 80G
MUX
Laser
Diode
SOA
LiNbO
3
Delay interferometer
PC
Filt er 1 F ilter 2 OSA
CSA
80Gbit/s Transmitter
Optical Filter
EDFA
PC
PC
EDFA
τ
Ф
0
Pump
@1552 nm
CW
@1559 nm
A-3
A-2
A-4
A-1
•
•
•
•
Fig. 11. Experimental setup for 80Gb/s wavelength conversion with SOA and cascaded
filters: PC: Polarization controller, EDFA: Erbium-doped fiber amplifier, OSA: optical
spectrum analyzer; CSA: communication signal analyzer.
The experimental setup is shown in Fig.11 (Huang et al., 2009). A 40GHZ 1.0-ps wide
(FWHM) optical pulse is modulated by an external amplitude modulator (MOD) at
40Gbit/s to generate a 2
7
-1 RZ-PRBS signal. This data stream is then optical time
multiplexed (MUX) to 80Gbit/s. After amplification, the average optical power of the
80Gbit/s data stream is 4.8mW and the continuous wave (CW) probe signal is 3mW. After
the polarization controller, the 80Gbit/s signal is combined with the CW probe and fed into
an SOA via 3 dB coupler. As shown in Fig.12, the cascaded filtering model is consisted of a
3.125 ps delay LiNbO
3
-DI, an optical band-pass filter 1 with bandwidth of 3 nm and the
tunable optical band-pass filter 2 with bandwidth of 1 nm which is detuned 1.2 nm to the
blue side of the probe carrier wavelength. An inverted 80Gbit/s signal can be obtain at the
output of the SOA. The converted signal is subsequently injected into the LiNbO
3
DI, where
Advances in Lasers and Electro Optics
350
the inverted signal is converted into a non-inverted signal. At the output of the tunable
optical band pass filter 2, the non-inverted probe signal is monitored by using an optical
sampling scope; the optical spectrum is analyzed by using an optical spectrum analyzer
(OSA) with a resolution of 0.050 nm, simultaneously. In our experimental setup, the SOA is
biased at 250mA.
It should be noted that, the sampling frequency of the OSA used in our experiment is
40GHz, while the data stream is modulated at 80 Gb/s. Thus the short pulse monitored by
the OSA is broadened. However, we are still able to distinguish the eye opening and ER of
the output waveform which are shown in Fig.13 (b), (c), (d).
1554 1555 1556 1557 1558 1559 1560 1561 1562 1563 1564
-85
-80
-75
-70
-65
-60
-55
-50
-45
-40
-35
Wavelength (nm)
Transmission(dBm)
λ
cw
(a)
(c)
(b)
Fig. 12. Transmission spectra the DI (a-1), the band pass filter 1(a-2), the band pass filter2 (a-3).
The operation principle for optical spectrum filtering base on SOA is described as follows.
An ultra-fast pulse-stream is combined with a CW probe light and launched into the SOA.
The pump signal will induce nonlinear phase shift to the probe signal via T-XPM in the
SOA, As a result, the spectrum of the probe signal is broadened. To obtain the high output
quality, we optimize the spectrum filter using the LiNbO
3
DI and band-pass filters. As seen
curve (a) in Fig.12, the “notch” characteristic of LiNbO
3
DI is clearly visible. An important
feature to be noted is that for the non-inverted output, the wavelength of the notch is set to
be the center wavelength of the converted probe signal, ensuring a high attenuation of DC
component corresponding to the “1”level in the inverted signal and a larger transmittance of
the “0”level.On the other hand, the LiNbO
3
DI modifies the spectrum of the output probe of
SOA. The central wavelength of the filter 1 is fixed at carrier wavelength of the probe signal
.Thus, the pump signal is suppressed and the power ratio of the probe and pump signal is
about 30dB (seen in Fig.13 (A-3)).Another low-noise EDFA 2 is applied to amplify the
output signal. Then, we use the filter 2 to extract out the component at the central
wavelength λ
C
+Δλ, where λ
C
is the central wavelength of the probe signal, Δλ is the
detuning value from λ
C
. In this experiment, probe wavelength λ
C
is 1559.89nm, and the
wavelength detuning Δλ is -1.2nm.
Fig.13 (a) depicts the optical spectrum measurement at the different position of the
experimental setup.Fig.13 (b-d) shows the measured eye diagrams. Fig.13 (b) is the input
pump signal at 1541nm, Fig.13(c) shows the eye diagram of the output signal after the OBF1,
and Fig.13 (d) depicts output signal after OBF2. They all show good eye-opening
All-Optical Signal Processing with Semiconductor Optical Amplifiers and Tunable Filters
351
performance, the ER of input pump signal is 13.529dB, while the ER of output signal after
the BPF 1 is only 3.291dB, and the ER of output signal after the OBF 2 is as high as 20.00dB.
Fig. 13. Experimental results for 80Gb/s wavelength conversion (a) the optical spectrum
measurement at different position corresponding to Fig.11; Eye diagram for (b) input pump
signal at 1552nm, (c) output probe signal after OBF 1, (d) output probe signal after OBF 2
For wavelength conversion with SOAs, XGM, XPM, FWM and Transient XPM effects can all
be exploited. However, for different operation conditions, one main effect dominates over
other effects which maybe improve or degrade the output signal performance. Therefore,
optimization of SOA parameters, filtering parameters and operational conditions is very
important to get better output performance, and this optimization process can be achieved
based on theoretical model presented in section 2.
4. All-Optical logic operation with SOAs and filters
In this section, we will focus on experimental study for all-optical logic operation based on
SOAs and filters. Three schemes for all-optical logic operation were introduced. Firstly, All-
optical logic AND gate at 40Gb/s based on XGM in cascaded SOAs was presented (Xu et al.,
2007), and operation condition and output performance were analyzed. Secondly, based on
single SOA and different filtering processing, five different logic gates were demonstrated
(Dong(b) et al., 2007; Dong et al., 2008; Wang et al., 2007), different nonlinear effects such as
XGM, FWM, Transient XPM are exploited in different logic gates respectively. Thirdly, a
flexible scheme for all-optical minterms generation was proposed and demonstrated (Xu(a)
et al., 2008; Xu(b) et al., 2008). Based on DI and XGM of SOAs, all-optical minterms for two
input signals and three input signals were realized respectively.
4.1 All-optical logic AND gate based on cascaded SOAs
It is known that the logic function of inverted wavelength conversion can be written as AB⋅
given that data signal A and B are used as pump and probe light respectively. Particularly, it
degenerates into a NOT gate when a continuous-wave (CW) serves as the probe light.
Therefore, AND gate can be realized by cascading two sets of SOA and filter and
configuring the first one as a NOT gate, i.e.
()
AB A B⋅= ⋅(Zhang et al., 2004).
Advances in Lasers and Electro Optics
352
Fig. 14. Schematic diagram for all-optical logic AND gate with cascaded SOAs
As shown in Fig. 14 (Xu et al., 2007), a continuous wave (CW) beam is used as an
intermediate wavelength connecting two stages. As probe light at the first stage, it is
converted into the negated signal of data A at the output of first stage and serves as pump
light at the second stage. Note that the optical filter mentioned above particularly refers to
the one who effectively reshapes the spectrum of the modulated probe light. If pump
wavelength can not be blocked by such OF, additional optical filter should be used to set the
pump and probe wavelength apart.
The experimental setup for the ultrafast AND gate is shown in Fig. 15. In this experiment,
three wavelengths generated by LD1, LD2, LD3 are 1560nm(
λ
1
), 1549.32nm(λ
2
) and
1555.75nm(
λ
C
) respectively. λ
1
, λ
2
are modulated by Transmitter simultaneously with 2
7
-1
pseudo-random binary sequence (PRBS) RZ data streams at 40Gb/s. The duty cycle of these
RZ pulses is 33%. Two wavelengths are separated by a demultiplexer (DMUX) and the
optical delay line (ODL) is used to synchronize the input data sequences at the second stage.
Thus, two quasi-independent data signals at
λ
1
and λ
2
are obtained at the input of SOAs. λ
C
is
used as intermediate wavelength. The time delay of DI is 25ps which equals to the single bit
period of 40Gb/s data rate. The optical BPF following the DI is used to extract the probe
light. The filtered probe light is amplified before coupled into the second SOA. The 3dB
bandwidth of the Tunable BPF is 0.32nm. The average optical power measured at the input
of SOA1 are 7.93dBm(
λ
1
) and 5.92dBm(λ
2
), while 3.10dBm(λ
2
) and -17.92dBm (λ
C
) at the
Fig. 15. Experimental setup for all-optical logic AND gate at 40Gb/s with cascaded SOAs
All-Optical Signal Processing with Semiconductor Optical Amplifiers and Tunable Filters
353
input of SOA2. AND logic results can be achieved through properly tuning the notches of
DI and the center wavelength of tunable BPF. In our experiment, the transmission spectrum
of the DI can be tuned by adjusting the operational temperature of DI.
Fig. 16 shows the AND logic results (R6) of data signal R7 and R5. R3 is the negated signal
of R7, which is NRZ format due to the equivalency between the time delay of DI and the
single bit period. The ER of measure AND results is 8.8dB. The bottom trace shows the eye
diagram of derived AND results which display open and clear eyes. The QF of the
measured eyes is 6.3.
Fig. 16. Output experimental results for all-optical logic AND gate
It should be noted the the SOA1 is a slow recovery bulk material SOA which carrier
recovery time is about 500ps. In this SOA, XPM effect is very strong which dominate the
output performance. The DI is used to demodulate the phase modulation process, the time
delay equals to the bit period, therefore, RZ input signal is wavelength converted to a NRZ
signal. The SOA2 is a fast recovery ultrafast SOA which carrier recovery time is about 60ps.
The followed the narrow bandpass filter is detuning from the signal B, the detuning process
can be optimized to get the best output performance according to the theoretical model in
section 2 and analysis of accelarating mechanism in section 3. On the other hand, the most
important factor for good AND results is the extinction ratio of the converted signal from
stage 1. If we want to improve the output performance or increase the operation speed, the
parameters of SOAs and filtering processes should be optimized.
4.2 Configurable all-optical logic gates based on single SOA and tunable filter
In this subsection, we propose and experimentally demonstrate reconfigurable all-optical
logic gates based on various nonlinearities in single SOA (Dong(b) et al., 2007; Dong et al.,
2008). The operation principle of the configurable logic gates is described in Fig. 17. Data
A
and
B are the data signals to be processed, whose wavelengths are λ
A
and λ
B
, respectively.
The probe signal is a CW at wavelength
λ
C
, which will be gain- and phase-modulated by the
data signals through the SOA. Thus the output optical spectrum of the probe signal will be
broadened. Different logic gates can be realized at different OBF setting.
When both data signals are presented in the SOA, the conjugated light is generated due to
FWM effect. The converted signal can be optically filtered out to implement AND logic.
When either data
A or B, or both are presented, the probe signal is gain-modulated with
polarity-inverted output, which is logic NOR gate. Whereas, the slow gain recovery of SOA
Advances in Lasers and Electro Optics
354
Fig. 17. Illustration of operational principle of the configurable logic gates
degrades the output logic with serious pattern effects. In order to accelerate the SOA gain
recovery, the blue shifted OBF with small detuning to the probe carrier is necessary. On the
other hand, when the OBF is blue shifted by properly large detuning (i.e.,
1c
λλ
+Δ ), the OBF
is used to reject the probe carrier and select the blue-shifted spectrum. Either data
A or B or
both launched into the SOA will induce blue shifted spectrum, which fits in the OBF
passband. If both data signals are absent, the OBF will block the probe carrier. Therefore the
output is logic OR gate, which is based on the principle of SOA T-XPM. The XNOR can be
obtained by coupling the AND output and NOR output with proper power equalization.
The NOR logic gate can be simply changed to NOT logic, merely turning off one data signal.
Fig. 18. Experimental setup of the configurable logic gates
The experimental setup for configurable logic gates are described in Fig. 18. The
wavelengths of three CW beams generated by LD1, LD2, and LD3 are 1549.3nm (
λ
A
),
1550.7nm (
λ
B
), and 1557.3nm (λ
C
), respectively. The data signals (λ
A
and λ
B
) are modulated
by two Mach-Zehnder Modulators (MZMs) at 40Gb/s to form 2
31
-1 return-to-zero (RZ)
pseudo random binary sequence (PRBS) signals. The duty cycle of these RZ pulses is 33%.
Two data signals will be separated by the wavelength division multiplexer (WDM) and one
of them is delayed for several bits by an optical delay line (ODL), therefore, two data signals
with different data pattern are obtained. The employed SOA is the same to that of Fig. 6. A
All-Optical Signal Processing with Semiconductor Optical Amplifiers and Tunable Filters
355
tunable narrow OBF1 with 0.32nm bandwidth is used to filter the OR logic and AND logic.
Another 1nm-bandwidth tunable OBF2 is used to filter the probe signal with NOR/NOT
output, or filter the data
A with AB output, or filter data B with AB output. Both AB and
AB should be obtained with large power contrast between data A and B. EDFA2 is used to
amplify the AND power, and the coupler (OC5) can combine it with NOR power to realize
XNOR logic. Finally, the optical spectrum analyzer (OSA) and communication signal
analyzer (CSA) are used to observe the optical spectrum and waveform of the converted
signal.
Fig. 19. Output waveforms for different logic gates, (i) and (ii) are input data signals, (iii)-(ix)
are logic AND, NOR, XNOR, NOT,
AB , AB , and OR, respectively.
The input data
A and B before entering the SOA are shown in Fig. 19(i) and (ii), respectively.
Both waveforms have a peak power of 2.6mW with extinction ratio (ER) over 13dB. The
probe signal has a power of 0.6mW. The conjugated light appears at 1548nm at the SOA
output. The conjugated light is filtered out by OBF1 and amplified by EDFA2, then the
output signal is the logic AND with good eye pattern, as shown in Fig. 19(iii). The output ER
is 8.04. In fact, the input probe signal has additional function to accelerate gain recovery
speed of SOA and eliminate pattern dependent distortions. When the central wavelength of
OBF2 is blue-shifted by 0.1nm with respect to the probe wavelength, the output signal is
NOR logic, as shown in Fig. 19(iv). The ER of NOR logic operation is 10dB. The AND output
has a low power level due to low conversion efficiency of FWM, while the NOR output has
a high power level. With the assistance of EDFA2, the AND output and NOR output have
an equal power level with peak power of 1.7mW, which are combined by optical coupler
(OC5), thus the mixed signal is XNOR logic, shown in Fig. 19(v). We can observe much
noise appears in level “one”, which is caused by different modulation intensity in the NOR
and AND outputs. As a result, there is a small eye opening ratio with ER of 6dB. When LD2
Advances in Lasers and Electro Optics
356
is turned off, the NOR gate can be simply changed to the NOT gate, as shown in Fig. 19(vi).
Good eye pattern can be observed and the ER reaches 11.5dB.
Based on these five logic gates, all-optical digital encoder and comparator could be
demonstrated (Wang et al., 2007). As shown in Fig. 20(a) and Fig. 20(c), digital encoder
consists of four logic outputs Y0, Y1, Y2, Y3, which are corresponding to four different input
conditions. These four different outputs are achieved by four different logic gates:
AB⋅ ,
AB , AB and AB, respectively. For input signal A and B with bits “00”, “01”, “10” and “11”,
output bit “1” appears only at port Y0, Y1, Y2 and Y3, respectively.
For digital comparator, three logic outputs are needed to represent three results after
comparing the two digital signals. When A is bit “0” and B is bit “1”, only the A<B output
port is bit “1”, and this operation can be represented by
A
B
logic. When A and B are both bit
“0” or bit “1”, only A=B output port is bit “1”, and this operation can be represented by
AB or XNOR logic. When A is bit “1” and B is bit “0”, only the output A>B port is bit “1”,
this operation can be represented by
A
B
logic. From above discussions, we can find that Y1
output in digital encoder is identical with A<B output in comparator and Y2 output is
identical with A>B output. In other words, all-optical digital encoder and comparator can be
achieved by five different logic functions:
A
B⋅
,
A
B
,
A
B
, AB and AB .
Fig. 20(b) shows the principle diagram of proposed scheme for all-optical digital encoder
and comparator. Three SOAs are exploited in this scheme. Signal A and B are input signals
with wavelength
λ
A
and λ
B
, respectively. SOA1 is used to achieve AB logic function at
wavelength
λ
B
based on XGM effect while the optical power of signal A is much larger than
signal B. Contrarily, SOA2 is used to achieve
AB logic function at wavelength λ
A
while
signal B is much stronger than signal A. Signal A and B are injected into SOA3 together with
a continuous wave
λ
cw
. FWM and XGM effects occur simultaneously in SOA3. Based on
XGM effect, we can get NOR logic at wavelength
λ
cw
. On the other hand, we can achieve
Fig. 20. Concept and operation principle of digital encoder and comparator, (a) digital gate-
level diagram of encoder/comparator; (b) optical implementation of encoder/comparator;
(c) logical truth table for the encoder/comparator
All-Optical Signal Processing with Semiconductor Optical Amplifiers and Tunable Filters
357
logic AND at the new generated channel based on FWM effect while the optical power of
two data signals is nearly equal. Based on the output AND and NOR gates, we can get the
XNOR gate by coupling the two outputs together with proper power equalization.
Therefore, we can obtain five different logic gates based on XGM or FWM effects in three
SOAs, which can be exploited to achieve all-optical digital encoder and comparator
simultaneously.
4.3 All-optical minterms generation based on delay interferometer and SOAs
In this sub-section, a general scheme for reconfigurable logic gates for multi-input DPSK
signals with integration possibility is proposed (Xu(a) et al., 2008; Xu(b) et al., 2008).
Benefiting from the optical logic minterms developed by two kinds of optical devices, i.e.,
optical delay interferometers and SOAs, target logic functions can be realized by combining
specific minterms together. The scheme is reconfigured by changing the phase control of the
delay interferometers or the input wavelengths.
In our scheme, DIs and SOAs are used to develop NOT gates and NOR gates, respectively.
A DI is a Mach-Zehnder interferometer which has a differential delay
τ in one arm and a
tunable phase controller Φ
0
in the other, as shown in Fig. 21. τ must equal the bit interval of
the given bitrate in order to correctly demodulate DPSK signals while Φ
0
must be tunable to
ensure accurate demodulation.
Ф
0
τ
π
π
0
π
0
0
0
1
0
DI1
π
π
0
π
0
0
1
1
1
00
1
0
00
1
0
DPSK
modultaion
π
π
0
π
0
π
π
0
π
0
A
B
(II)
(II)
(I)
(III)
(III)
Ф
0
τ
DI2
0
1
1
1
00
1
0
SOA
0
1
1
2
0
1
0
0
AB
0
1 1
1
00
1
0
(IV)
0
1 1
1
00
1
0
1
2
1
0
0
1
0
0
AB
(IV)
XOR
1
0
0
1
(V)
A
A
B
B
B
B
A
A
SOA
transmission span
(minterm: )
(minterm: )
2
2
m
2
1
m
Fig. 21. Logic evolution of two DPSK signals in the generation of optical logic gates from
optical minterms based on DIs and SOAs.
Advances in Lasers and Electro Optics
358
In order to explain the operation principle of the scheme, the logic evolutions of DPSK
signals through the entire system is briefly described, as shown in Fig. 21. In the first stage
(I), two DPSK signals are generated from two absolute binary data
A and B respectively. The
coding rule is assumed that ‘1’ is encoded as no phase shift between adjacent bits while ‘0’ is
encoded as
π shift. After transmission, as shown in the second stage (II), DIs are used to
demodulate DPSK signals and recover the original binary data (i.e.,
A or B in this case). Note
that either the original data or its inversion can be obtained at a certain output of the DI,
depending on whether the interference at that port is constructive or destructive. This can be
seen from the frequency domain by checking whether the signal wavelength is located on
the transmission peak or notch of the spectrum of the concerned output. If the signal
wavelength is located on the transmission notch, the spectrum will features as two main
peaks with a noticeable notch at its central wavelength. On the other hand, only one main
peaks is observed. Based on the illustrated locations of the signal wavelengths on the
transmission spectra of the DI (as shown in Fig. 21),
A (orignial data) shows up in the upper
output port of DI1 and
A (inverted data) in the lower output. Oppositely, B is obtained in
the lower output of DI2 and
B
in the upper output. In fact, DIs offer a large degree of
flexibility of the scheme besides carrying out NOT operation, as will be shown later.
The demodulated signals are combined by optical couplers before launching into the SOAs.
It is well known that the cross-gain modulation (XGM) of SOA can be used to carry out
NOR operation of nonreturn-to-zero (NRZ) OOK signals. Fig. 22 shows the output probe
(
λ
2
) power of the SOA versus the input pump (λ
1
) power. Due to the gain-saturation
characteristics of the SOA, the CW probe light will be switched off at the output of the SOA
if the input signal power is larger than
P
in, H
, corresponding to ‘0’ in the output. On the other
hand, CW probe light is switched on at the output of the SOA if the input pump power is
smaller than P
in, L
, corresponding to ‘1’ in the output. For input power between P
in, L
and P
in,
H
, error logic results will occur. Note that SOA can carry out multi-input NOR operation as
well. This is because when one tributary is at ON-state, no matter what states other
tributaries are, the total input power during that bit period will exceed P
in, H
and saturate the
gain of the SOA to generate ‘0’ at the output. The case that the input DPSK signals are
return-to-zero (RZ) format needs to be mentioned. Although the logic integrity is kept, the
NOR logic results given by the SOAs will be in dark-RZ pulses due to the characteristics of
XGM. To avoid this, other kinds of NOR gates that can process RZ signals can be utilized
instead, such as logic gates based on SOAs and optical filtering. In the third stage (III), an
SOA can carry out NOR operation of data
A and B , creating logic result
A
B . Similarly, the
other SOA generates
A
B by executing NOR operation of
A
and B in stage (IV). In stage (V),
final logic
A
BAB+
is derived by combining the output of stage (III) and (IV) through an
optical coupler which functions as an OR gate due to the fact that the probability of
concurrence of ‘1’ in different minterms is zero. Therefore, an exclusive-OR (XOR) logic
result has been derived. If we change the connection of the optical couplers before stage (III)
and (IV) so that the low output port of DI1 is connected to the upper output port of DI2, an
XNOR logic (
AB AB+ ) can be obtained. However, the same result can be achieved without
changing any physical connections. This is because the DIs can provide a way to exchange
the output signals between its two output ports. That is, we can adjust the location of the
signal wavelength on the transmission spectra of the DIs to exchange the interference
conditions of their two output ports. This can be achieved by tuning Φ
0
of the DIs or
All-Optical Signal Processing with Semiconductor Optical Amplifiers and Tunable Filters
359
adjusting the wavelengths of the input signals. Note that unlike doing proof-of-concept
experiments as what we have done, it is difficult to change the input signals in practical
situations. In that case, tuning Φ
0
is the only choice.
P
in, L
P
in, H
P
out
P
in
()
1
λ
()
2
λ
Fig. 22. Output probe power of the SOA versus the input pump power.
Simplified setups are adopted in the experimental trials. That is, a single DI can perform
NOT operation for several DPSK signals simultaneously if the input wavelengths can be
adjusted. Fig. 23 shows the experimental setup for realizing two-input minterms. Fig. 24
shows the setup for realizing three-input minterms. To facilitate description, important
measuring points, i.e.,
D
o1
, D
o2,
S
i1
, S
i2,
S
o1
, S
o2
and S
o3
, are marked on Fig. 23 and Fig. 24.
Fig. 23. Experimental setup for two-input NRZ-DPSK logic minterms or logic gates
Fig. 24. Experimental setup for three-input NRZ-DPSK logic minterms.
Two-Input Minterms
Due to energy conservation,
2
1
m and
2
2
m appear simultaneously and so does
2
0
m and
2
3
m . The
signal spectra STO2 shown in Fig. 25(a) are measured at
S
i1
when two-input minterms
2
2
m
are derived at
S
o1
. Simultaneously,
2
1
m are obtained at S
o2
and the spectrum measured at S
i2
are shown by STO1. In this case, signal at λ
A
and λ
B
are destructively and constructively
demodulated at
S
i1
, respectively. Using the same setup but shifting λ
A
downwards by 0.4nm,