Advances in Lasers and Electro Optics Part 2 docx
Bạn đang xem bản rút gọn của tài liệu. Xem và tải ngay bản đầy đủ của tài liệu tại đây (4 MB, 50 trang )
Nonlinear Optical Absorption of Organic Molecules for Applications in Optical Devices
37
technique with pulse train (Misoguti et al.,1999), can also be employed, allowing the
investigation of the time evolution of nonlinear processes. The excitation source is a
frequency-doubled, Q-switched and mode-locked Nd:YAG laser, delivering pulses at 532
nm and 100 ps. Each pulse train contains about 20 pulses separated by 13 ns at a 10 Hz
repetition rate. This low repetition rate is generally used to avoid cumulative thermal
nonlinearities. The beam is focused onto a quartz cell, yielding diameters of tens of µm at
the focal plane. A photodetector placed in the far field coupled with a digital oscilloscope
and a computer are used to acquire the pulse train signal. Each peak height is proportional
to the corresponding pulse fluence, once the detection system has a rise time slower than the
100 ps pulse duration. By measuring the beam waist and the pulse train average power, one
can find out the pulse fluency. The intensity can be determined by carrying out Z-scan
measurements with CS
2
. When the sample is located at the focus, the pulse train signal is
acquired. Then, this signal is normalized to the one obtained when the sample is far from
the focus, yielding the normalized transmittance as a function of pulse number. All optical
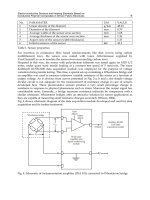
measurements were carried out with the sample placed in a quartz cuvette. Figure 1
schematically shows the experimental setup.
Laser ps
Polarizer
Pockel
cell
λ=532nm
sample
Polarizer
z = 0
ON OFF
Full pulse
envelope
single
pulse
Photo-
detector
Laser psLaser ps
Polarizer
Pockel
cell
λ=532nm
sample
Polarizer
z = 0
ON OFF
Full pulse
envelope
single
pulse
Photo-
detector
Fig. 1. Experimental setup of the Z-scan technique with pulse trains, used to characterize the
material’s nonlinear response in the pico- and nanosecond regime.
4.2 Z-scan technique in the femtosecond regime
The nonlinear optical absorption of organic molecules in the femtoseconds regime in a large
spectral range may be carried out by means of two methodologies: (a) Single wavelength Z-
scan technique and (b) White-Light Continuum Z-scan technique, described in more details
as follows.
(a) Single wavelength Z-scan technique
This methodology uses a Ti:sapphire chirped pulse laser amplified system that produces
pulses of 150 fs centered in 775 nm, with a repetition rate of 1 kHz, to pump an optical
parametric amplifier (OPA), which, in turn, generates wavelengths in the spectral region
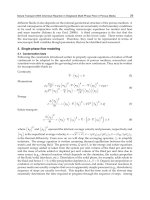
from 460 nm to 2200nm of nearly 100 fs. Figure 2 (a) schematically displays the details of the
Single wavelength Z-scan technique experimental setup.
(b) White-Light Continuum (WLC) Z-scan technique
In this methodology, whose full details can be found elsewhere,(Balu et al., 2004, De Boni et
al., 2004), the White-light Continuum (WLC) is produced by focusing a femtoseconds laser
Advances in Lasers and Electro Optics
38
beam (Ti:sapphire chirped pulse laser amplified system that produces 150 fs centred in 775
nm, with a repetition rate of 1 kHz,) with a lens onto a quartz cell containing distilled water.
A low-pass filter is used to remove the strong pump pulse and the infrared part of the WLC
spectrum. The use of typically 0.3 mJ laser pulses generates about 10 μJ of WLC, spanning
from 420 up to 750 nm. After re-collimation, the WLC beam is focused onto the sample,
which is scanned along the beam propagation z-direction, as usually done in the traditional
Z-scan method. The WLC transmitted through the sample is completely focused onto a
portable spectrometer with a resolution of ~1 nm. The spectra are acquired for each z
position as the sample is scanned along the z-direction and then normalized to the one
obtained far from the focal plane. By selecting a particular wavelength from the complete set
of measured spectra, a Z-scan signature is obtained according to the nonlinear response at
that wavelength. Figure 2 (b) schematically shows the experimental apparatus of the WLC
Z-scan technique. When using this technique under resonant conditions, the white-light
continuum pulse chirp must be considered, since distinct spectral components will reach the
sample at distinct times. Consequently, cumulative effects can occur as result of absorption
by excited molecules, which are then promoted to a higher excited state.
Laser fsLaser fs
filter
sample
Photo-
detector
Lock-in
z = 0
λ=775 nm
λ=460-2600nm
OPA
(a)
water
sample
spectrometer
z = 0
λ=775 nm
Laser fsLaser fs
filter
filter (775 nm)
iris
(b)
Optical fiber
Fig. 2. Experimental setup of the (a) Single wavelength and (b) WLC Z-scan techniques,
used to characterize the material’s nonlinear response in the femtosecond regime.
5. Nonlinear optical absorption (NLOA) of organic molecules
In this section, the results of the nonlinear optical absorption (NLOA) of the molecules
Chlorophyll A, Indocyanine Green, Ytterbium Bisphthalocyanine and Cytochrome C are
presented. The molecules are characterized in the nano, pico and femtoseconds regimes and
present Reverse Saturable Absorption (RSA) and Saturable Absorption (SA), with potential
applications in nonlinear optical devices.
Nonlinear Optical Absorption of Organic Molecules for Applications in Optical Devices
39
5.1 Chlorophyll A
5.1 (a) NLOA in the nano and picosecond regimes
Chlorophyll A, belonging to the class of porphyrins, is a biomolecule of prime importance in
the photophysical processes of plants, acting in the conversion of light into chemical energy
in several biological systems (Michel-Beyerle, 1985, Scheidt & Reed, 1981) by taking part in
the light absorption and electron transfer in the photosynthetic reaction center (Baker &
Rosenqvist, 2004, Carter & Spiering, 2002, Michel-Beyerle, 1985). Due to its relevance in
biological processes, Chlorophyll A has been the subject of extensive theoretical and
experimental studies (Gouterman, 1961, Hasegawa et al., 1998, Parusel & Grimme, 2000,
Sundholm, 1999). Furthermore, porphyrins have been proposed for medical and photonics
applications such as optical limiters (Calvete et al., 2004, Neto et al., 2003, Neto et al., 2006,
O'Flaherty et al., 2003), optical switches (Loppacher et al.,2003), and sensitizers for
photodynamic therapy (Fisher et al.,1995). Hence, studying Chlorophyll A excited states
properties is essential to understand biological processes aiming at possible applications in
photonics and medicine.
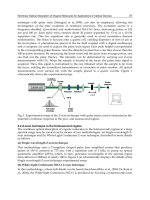
The electronic transitions of Chlorophyll A are usually characterized by two regions: the Q-
band, which is relatively weak and occurs in the visible region; and the intense Soret or B-
band, which appears in the near UV region and is often accompanied by an N-band of lower
intensity (see Figure 3). The linear absorption spectrum of Chlorophyll A has been
understood in terms of the four-orbital model applied by Gouterman (Gouterman, 1961),
which although very simple reproduces all the major features of this system. There are
several theoretical studies carried out using distinct methods to further understand the
electronic excited states of Chlorophyll A (Hasegawa et al., 1998, Parusel & Grimme, 2000,
Sundholm, 1999). In general, these works assign more than one electronic excited state to
describe the experimentally observed features of Chlorophyll A spectrum (Q and B-band).
In this book chapter, the choice was based on the electronic states reported by Parusel et al.
(Parusel & Grimme,2000) obtained through the DFT/MRCI method (density functional
theory and multireference configuration interaction), which gives the best interpretation for
the linear absorption spectrum of Chlorophyll A, as the basis for the energy diagram
employed here to understand the results. The Q-band at 670 nm is the main transition
350 450 550 650 750
0,0
0,2
0,4
0,6
0,8
1,0
Q
normalized absorbance
wavelength (nm)
B (Soret)
Fig. 3. Absorption spectrum of Chlorophyll A/chloroform solution.
Advances in Lasers and Electro Optics
40
excited by the 532 nm light used in this investigation. This molecule has considerable
absorption in the 600-700 nm region, in which human tissues are more transparent. In terms
of medical therapy, for instance, light can reach the dye molecule adsorbed in the cells and
undergo a photoreaction, i.e. Chlorophyll A satisfies an important requirement for possible
use as a sensitizer in PDT.
The emission spectrum at room temperature for excitation at the Q-band presents a strong
fluorescence peak at 669 nm, which means that the Q-band is the predominant excitation
path. The fluorescence lifetime (
f
τ
) reported in the literature is 4 ns (Vernon & Seely, 1996).
Based on the absorption and emission spectra and on models traditionally used for other
porphyrins, a simplified five-level energy diagram can be sufficient to describe the
dynamics of the nonlinear absorption in the picosecond regime, as illustrated in Figure 4.
0
1
2
τ
isc
W
01
3
4
τ
10
singlet
triplet
0
1
2
τ
isc
W
01
3
4
τ
10
singlet
triplet
Fig. 4. Five-level energy diagram used to simulate the experimental results.
Figure 5 shows experimental results (open circles) for the nonlinear absorption obtained
with the Z-scan technique with pulse train at 532 nm (Correa et al., 2002) and theoretical
fitting (solid line) using the five-level energy diagram depicted in Figure 4. The strongest
peak in the pulse train was arbitrarily labeled “0.” The irradiance is
(0)
I = 0.35 GW/cm
2
.
-10 -5 0 5 10
0.3
0.5
0.7
0.9
1.1
normalized transmittance
pulse number
Fig. 5. Normalized transmittance of Chlorophyll A/chloroform solution along the pulse
train for a I
(0)
=0.35 GW/cm
2
. Solid line is the theoretical curve obtained by using the five-
level energy diagram.
Nonlinear Optical Absorption of Organic Molecules for Applications in Optical Devices
41
To understand the changes in the nonlinear effect during the train of pulses, basically, one
needs to comprehend how the population dynamic is produced by the pulse train. When the
first pulse of the pulse train is absorbed by the sample, it will promote molecules from the
ground state
0
to the excited singlet state
1
. The fraction of population on the singlet
excited state
1
may decay radiatively to level
0
, with the characteristic lifetime of the
state (
10
τ
), or relax to an excited triplet state
3
, with the lifetime
isc
τ
, known as
intersystem-crossing time. Also, because the lifetimes involved in this nonlinear process
have the same order of the time between two consecutives pulses (13 ns), molecules already
in
1
and
3
do not have enough time to completely relax back to the ground singlet state.
Based on this fact, the next pulse of the pulse train will probe a different population in the
electronic states than the first pulse did. If the absorption cross-sections are different, the
transmittance of such pulse will be proportional to the new absorption coefficient. This
mechanism will be present to the other pulses, as an accumulative effect. In addition,
because the higher excited states,
2
and
4
, are short-lived, their populations can be
neglected. On the basis of this energy diagram, the set of rate equations that describe the
fraction of molecules (n
i
) at each level is:
⎟
⎟
⎠
⎞
⎜
⎜
⎝
⎛
−+−=
iscf
nWn
dt
dn
ττ
11
1010
0
(6)
f
n
Wn
dt
dn
τ
1
010
1
−=
(7)
isc
n
dt
dn
τ
1
3
= (8)
where
ν
σ
hIW
0101
= is the transition rate. This set of equations was numerically solved
using the actual temporal intensity pattern of the Q-switched/mode-locked pulse train of
our experiment, yielding the population dynamics, n
i
(t). The time evolution of the nonlinear
absorption can be calculated according to:
}{)(
343121010
σ
σ
σ
α
nnnNt ++= (9)
where N is the sample concentration, and
12
σ
and
34
σ
are the excited state cross-sections.
The ground state cross-section,
01
σ
,
was determined by measuring the linear absorption at
532 nm (
01
σ
α
N= ). This procedure resulted in
01
σ
= 3.1 x 10
-18
cm
2
. The numerical
calculation was carried out with
f
τ
= 4 ns. In Figure 5, the solid line represents the
theoretical fittings obtained with
12
σ
= 4 x 10
-18
cm
2
,
34
σ
= 8 x 10
-18
cm
2
, and
isc
τ
= 1.5 ns. The
absorption cross-section of the triplet state is higher than that of the singlet, although with a
low ratio (only 2 times). On the other hand, the intersystem-crossing lifetime (1.5 ns) is
shorter than the typical values reported for porphyrins and phthalocyanines.(Frackowiak et
al., 2001, Shirk et al., 1992). This short intersystem-crossing lifetime indicates an efficient
singlet-triplet conversion, which makes Chlorophyll A suitable for applications as a PDT
sensitizer. This efficient intersystem-crossing (singlet-triplet) conversion is consistent with
Advances in Lasers and Electro Optics
42
those found for Mg phthalocyanine, which has a yield of triplet formation higher than for
most phthalocyanines.(Frackowiak et al., 2001)
5.1 (b) NLOA in the femtosecond regime
This section presents the study of the excited state absorption of Chlorophyll A in the
femtosecond regime by measuring its nonlinear absorption spectrum from 460 nm to 700
nm using the WLC Z-scan technique. Its resonant nonlinear absorption spectrum presents
saturable absorption (SA) and reverse saturable absorption (RSA) depending on the
excitation wavelength (De Boni et al., 2007). Figure 6 displays Z-scan curves of Chlorophyll
A for some pump wavelengths of the WLC spectrum. An inversion of the normalized
transmittance is observed as the nonlinear process changes from RSA (shorter wavelengths)
to SA (longer wavelengths).
-0.4 -0.2 0.0 0.2 0.4
0.7
1.0
1.3
1.6
656 nm
650 nm
640 nm
500 nm
normalized transmittance
z (cm)
Fig. 6. Experimental Z-scan curves for Chlorophyll A obtained with the WLC Z-scan
technique. An inversion of the normalized transmittance is observed according to the
dominant nonlinear process (SA or RSA).
Because the white-light continuum pulse temporal width is around 5 ps, only the singlet
levels of Figure 4 were used to establish the population dynamics of Chlorophyll A. In this
case, molecules in the ground state
0
can be promoted to the first excited state
1
(Q-
band) by one-photon absorption, being subsequently excited to a higher excited level. This
level does not correspond to the B-band (Linnanto & Korppi-Tommola, 2000, Rivadossi et
al., 2004, Wehling & Walla, 2005, Zigmantas et al., 2002) but to a distinct electronic state in
the UV region, since the photons used to transition an electron from
1
to a higher excited
state belong to the blue spectral region of the WLC pulse and, therefore, are more energetic
than those required to promote a transition from
1
to the B-band. The relaxation from level
1
to the ground state can be neglected because of the short pulse temporal width of the
WLC pulse. The upper energy levels (located above
1
) are assumed to be too short-lived
and, therefore, present no appreciable population (Shank et al.,1977). As a consequence,
molecules are accumulated only in the first excited state and the absorption cross-section
between states
1
and upper energy levels (located in the UV region) can be determined. In
Nonlinear Optical Absorption of Organic Molecules for Applications in Optical Devices
43
this case, no triplet state was considered, since the intersystem-crossing time of Chlorophyll
A is in the order of nanoseconds (Correa et al.,2002), which is much longer than the duration
of the WLC pulse used. Based on these considerations, the rate equation used to describe the
dynamic change of absorption, in accordance with the energy-level diagram, is:
()
()
()
10
0
010
0
1
)(
τ
λ
tn
Wtn
dt
tdn −
+−=
(10),
in which
() ()
tntn
01
1 −=
and
() ()
νλσλ
hIW
0101
=
is the transition rate, where
()
λσ
01
is the
ground state cross-section. I is the excitation intensity, n
i
(t) is the population fraction in each
state, h is the Planck constant, and
ν is the photon frequency. Due to the WLC pulse chirp,
its red portion (resonant with the Q-band) promotes part of the population to the first
excited state
1
and consequently the other spectral components of the WLC pulse probe
the excited state absorption (ESA), once the first excite state has a lifetime longer than the
pulse duration. The time evolution of the nonlinear absorption,
α
(λ,t), was calculated
according to:
( ) () ( ) () ( )
[]
λσλσλα
e
tntnNt
1010
, += (11),
where N is the number of molecules/cm
3
and
()
λ
σ
e
is the excited state cross-section
correspondent to the transition
1
to a higher excited state. The first and the second terms in
Eq. (11) provide the absorption coefficient of the ground and excited states respectively.
Since the ground state absorption cross-section for every spectral component is determined
through the linear absorption spectrum, the only adjustable parameters are the excited state
cross-sections. By fitting the normalized transmittance spectrum, it is possible to determine
the excited state cross-sections of Chlorophyll A for each wavelength within the WLC
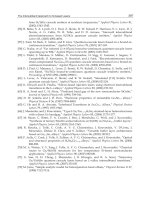
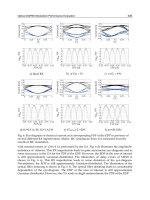
spectrum. These values are displayed in Figure 7 (closed triangles). The region below 450
nm was omitted because the white-light spectrum generated in the experiment starts around
this wavelength. The difference between the values of ground and excited state cross-
sections (
e
σ
σ
−
01
) is also displayed in Figure 7 (open triangles). From these data, one can
observe the singlet excited state processes of Chlorophyll A. When
0
01
>−
e
σ
σ
, there is a
decrease in the total absorption coefficient,
α
, characterizing SA. For Chlorophyll A, this
process was observed from 700 nm up to 640 nm. Around 635 nm, the values of
01
σ
and
e
σ
are the same, giving rise to no appreciable change in the normalized transmittance at this
wavelength.
It can be observed that σ
e
values (closed triangles) are zero from 700 nm up to 665 nm,
indicating that, for this range, there is no transition to a higher excited state. The red portion
of the WLC, which is resonant with the Q-band, causes ground state depletion, responsible
for the SA. Therefore, up to 665 nm, the WLC is populating state
1
, which is then probed
by the remaining components of WLC pulse. Consequently, for wavelengths shorter than
665 nm, the values of
σ
e
are not zero, due to the transition from
1
to the higher excited
state, which is allowed according to DFT/MRCI calculations presented in the literature
(Parusel & Grimme, 2000). If
σ
01
−
σ
e
<
0, the material has its absorption coefficient increased
with the intensity (RSA process), as shown by open triangles in Figure 7 for wavelengths
below 640 nm. The excited state population build-up generated with the WLC Z-scan
Advances in Lasers and Electro Optics
44
technique can be advantageously used to shape the pulse intensity spectrum in order to
match the most intense linear absorption band of the material. As a consequence, it is
possible to obtain an enhancement of the nonlinear absorption in a transparent region
through excited state absorption. In practical terms, WLC pulses could be used in
applications where a high RSA process is needed in the blue region of the spectrum.
460 530 600 670 740
0
2
4
absorption cross-section (x10
-17
cm
2
)
wavelength (nm)
Fig. 7. Excited state (
σ
e
: closed triangles) cross-sections as a function of the excitation
wavelength for Chlorophyll A obtained with the WLC Z-scan technique. The difference
between the excited and ground state cross-section (
σ
01
−
σ
e
: open triangles) is also
displayed.
5.2 Ytterbium Bisphytallocyanine
5.2 (a) NLOA in the nano and picosecond regimes
Phthalocyanines are planar organic molecules that can exhibit large third-order
susceptibilities due to their high
π-conjugation. To further increase the conjugation, and
consequently enhance the nonlinear optical properties, one can augment the molecular size
by adding peripheral rings or constructing sandwich compounds, known as
Bisphthalocyanines (YbPc
2
), where two phthalocyanine rings are coordinated to a central
metal ion. Owing to their excellent environmental stability and optical properties, that can
be tuned by varying the central metal ion, or a peripheral side-group, phthalocyanines and
bisphthalocyanines are promising for manufacturing optical devices, such as optical-
limiting devices. The basic principle of optical-limiting devices is the reverse saturable
absorption (RSA), which is normally caused by an efficient intersystem-crossing process
from a higher excited singlet state to an excited triplet state, competing with direct radiative
decay to the singlet ground-state. This section reports on the dynamic optical nonlinearities
of Ytterbium Bisphthalocyanine (YbPc
2
)/chloroform solution obtained with the Z-scan
technique with pulse trains. The dependence of the nonlinear absorption on the pulse
fluence presents first SA, and subsequently RSA behavior. A six-energy-level diagram is
used to establish the population dynamics and the mechanisms that contribute to the
nonlinear refraction and absorption. (Mendonça et al., 2000)
Nonlinear Optical Absorption of Organic Molecules for Applications in Optical Devices
45
Figure 8 shows that the absorption spectrum of YbPc
2
in chloroform solution is similar to
those reported in the literature for other phytallocyanines containing metal-ions, and agrees
with the energy-level diagram, shown in the inset, obtained from the valence-effective
Hamiltonian (VEH) calculation.
250 375 500 625 750
0.0
0.2
0.4
0.6
0.8
1.0
B
Q
e
g
→ a
2u
π (b
2u
)
π (e
g
)
π (a
2u
)
π
*
(e
g
*
)
e
g
→ a
2u
Q
B (Soret)
normalized absorbance
wavelength (nm)
Fig. 8. Absorbance spectrum of YbPc
2
/chloroform solution. The inset depicts VEH one-
electron energies of the molecular p-orbitals.
The structure around 650 nm, known as Q-band, is attributed to transitions from the split
π
(
u
a
2
) orbital to the upper
*
π
(
*
g
e
) orbital. The band around 460 nm corresponds to
transitions from the deeper
π
(
g
e
) level to the half occupied
π
(
u
a
2
) orbital, while the B
(Soret) band, which appears in the ultraviolet region (320 nm), is attributed to the transitions
between
π
(
u
b
2
) and
*
π
(
*
g
e
) levels. According to the absorption spectrum, both the Q-band
and the
ug
ae
2
→
transition can, at first, be excited when 532 nm is employed. However,
time-resolved fluorescence measurements for a pump at this wavelength resulted mostly in
an emission centered on 550 nm, with a 4 ns lifetime, indicating that the
ug
ae
2
→
transition
is the main excitation path. A weaker 5 ns lifetime fluorescence (about 15% of the total)
centered around 692 nm (Q-band) was also observed, indicating a secondary path for the
excitation mechanism.
Figure 9 shows experimental results for the nonlinear absorption obtained with pulse trains
Z-scan technique. To explain these results, the six-energy-level diagram depicted in Figure
10 is considered, which is a simplification of the one shown in the inset of Figure 8. Two
possible ground state levels can be considered,
0 and 1 , because two distinct bands
(
*
2
gu
ea → and
ug
ae
2
→ ) can absorb photons of the excitation employed. According to the
present model, molecules in state
0 can be promoted to level 1 , when pumped by
excitation at 532 nm, while molecules at level
1 can be excited to level 2 . A two-photon
absorption process (
*
gg
ee → ) could also be considered, but it was found to have little
influence on the theoretical fitting. On the other hand, molecules excited to level
1
can
decay radiatively to level
0 , and those excited to level 2 can either decay radiatively to
level
1 or undergo an intersystem-crossing to the triplet state 4 . The upper excited singlet
Advances in Lasers and Electro Optics
46
and triplet levels,
3 and 5 respectively, are assumed to be too short-lived to present any
significant population build up.
-10 -5 0 5 10
0.0
0.5
1.0
normailzed transmittance
pulse number
Fig. 9. Nonlinear absorption of YbPc
2
along the pulse train. Solid line is the theoretical curve
obtained by using the six-energy-level diagram.
0
1
2
τ
isc
τ
21
3
W
01
4
5
W
12
τ
10
e
g
e
g
*
a
2u
0
1
2
τ
isc
τ
21
3
W
01
4
5
W
12
τ
10
e
g
e
g
*
a
2u
singlet
triplet
Fig. 10. Six-energy-level diagram used to simulate the experimental result of Ytterbium
Bisphytallocyanine.
The rate equations used to describe the fractions of molecules,
i
n
, at each energy level are:
10
1
010
0
τ
n
Wn
dt
dn
+−= (12)
10
1
21
2
121010
1
ττ
nn
WnWn
dt
dn
−+−= (13)
isc
nn
Wn
dt
dn
ττ
2
21
2
121
2
−−= (14)
Nonlinear Optical Absorption of Organic Molecules for Applications in Optical Devices
47
isc
n
dt
dn
τ
24
= (15)
where
υ
σ
hIW
0101
= and
υ
σ
hIW
1212
=
are the transition rates, with
01
σ
and
12
σ
being the
ground and excited state cross-sections, respectively.
10
τ
and
21
τ
are the lifetimes of levels
1 and 2 , and
isc
τ
is the intersystem-crossing time. This set of equations was numerically
solved using the actual temporal intensity pattern of the Q-switched and mode-lock pulse
train of the experiment, yielding the population dynamics,
)(tn
i
. The time evolution of the
nonlinear absorption can be calculated according to:
{}
454232121010
)(
σσσσα
nnnnNt +++=
(16)
where N is the concentration, and
23
σ
and
45
σ
are the excited state cross-sections. The
excited state cross-sections,
01
σ
, determined by measuring the linear absorption at 532 nm ,
resulted in
218
01
104.2 cm
−
×=
σ
. The numerical calculation was carried out with 4
10
=
τ
ns
and
5
21
=
τ
ns, values obtained through time-resolved fluorescence measurements. The solid
line in Figure 9 represents the theoretical fitting obtained with
217
23
100.1 cm
−
×=
σ
,
217
45
104 cm
−
×=
σ
and ns
isc
25=
τ
. A very small saturation for the first few pulses can be
observed, which is related to the population buildup in level
1
. After this initial step, level
2
starts to be populated, allowing a population transfer to the triplet state. Since this state
has an absorption cross-section higher than that of level
2 , a reverse saturation occurs. If
the transition
ug
ae
2
→ is not taken into account in the model, the plateau observed for the
first few pulses does not appear.
5.2 (b) NLOA in the femtosecond regime
This section reports the resonant nonlinear absorption spectrum of Ytterbium
Bisphthalocyanine (YbPc2) from 500 up to 675 nm in the femtoseconds regime determined
through the WLC Z-scan. The results indicate the presence of SA, at the Q-band region, and
a RSA, around 530 nm (De Boni et al., 2006). The line with circles in Figure 11 shows the
nonlinear spectrum (transmittance change (
T
Δ ) spectrum) of YbPc
2
obtained through the
WLC Z-scan technique. Three distinct behaviors can clearly be observed: (i) a strong SA
process that follows the Q-band, indicated by the positive
ΔT values, (ii) an excited state
absorption which gives an effective SA process below the Q-band and (iii) the negative
ΔT
values due to a RSA mechanism.
Due to the WLC-pulse chirp, the red portion of the pulse, which is resonant with the Q-
band, promotes the population to the first excited state. In this case, a simplification of the
diagram showed in Figure 10 can be used, which consists in considering only the first three
levels (0, 1 and 2). From this assumption, the population dynamics is established to
understand the experimental results. According to this consideration, molecules at the
ground state
0 (
u
a
2
) can be promoted to the first excite state 1 (
*
g
e ) by one-photon
absorption (Q-Band;
*
2
gu
ea → ), being subsequently excited to level 2 . Molecules at level
1
decay radiatively to the ground state with a relaxation time
τ
10
= 4 ns, which is much
longer than the WLC-pulse duration. The upper excited singlet level,
2 , is assumed to be
too short-lived to present any significant population buildup. In this case, molecules are
accumulated in the first excited state and the absorption cross-section between the states
1
Advances in Lasers and Electro Optics
48
and
2
can be determined. As the intersystem-crossing time for this molecule is around 25
ns, no triplet states need to be considered for the temporal regime of the pulses employed.
The rate equations used to describe the fraction of molecules, n
i
, at each level are obtained
from Eq. (12-15) but considering only terms related to levels 0, 1 and 2. The time evolution of
the nonlinear absorption can be calculated according to:
() ()
[]
λσλσλα
121010
)()(),( tntnNt +=
(17)
where N is the sample concentration. When
1201
σ
σ
> , the sample presents a decrease in the
effective absorption as the excited state is populated (SA). On the other hand, if
1201
σ
σ
< ,
the sample becomes more opaque, characterizing a RSA process. The occurrence of SA or
RSA depends on the contribution of different electronic states, excitation wavelength and
pulse width. For the Q-band region (660 nm for instance), the model gives a
12
σ
of
approximately zero, which leads to a SA that follows the absorption band, due to the
population accumulated in the first excited state. Right below the Q-band (600 nm), SA does
not follow the linear absorption. At 600 nm, for example, the theoretical fitting was obtained
with
12
σ
= 0.5x10
-18
cm
2
, which is smaller than
01
σ
(SA). Around 530 nm, RSA was observed
with
12
σ
= 10x10
-18
cm
2
, which is about four times higher than
01
σ
. A similar behavior in six
distinct wavelengths was observed by Unnikrishnan et al. (Unnikrishnan et al., 2002), even
though they used much longer pulses (nanoseconds). Furthermore, due to the ultrashort
pulses regime employed here, no triplet state is being populated and only the singlet state
contributes to the observed RSA. The excited state absorption cross-section at 530 nm
determined here (
σ
12
/
σ
01
≈ 4) is in agreement with a previous one obtained at 532 nm using
the Z-scan technique with picosecond pulses (Mendonça et al., 2000,Mendonça et al., 2001,
Misoguti et al., 1999). In that work, RSA was found to be related to singlet and triplet
Fig. 11. Normalized transmittance change of YbPc
2
solution obtained with WLC Z-scan.
Nonlinear Optical Absorption of Organic Molecules for Applications in Optical Devices
49
states, being mainly due to the last one, whose cross-section was found to be sixteen times
higher than that of the ground state. The smaller singlet state contribution to RSA was
comparable to the one presented here.
5.3 Indocyanine Green
5.3.1 NLOA in the nano and picosecond regime
The organic dye Indocyanine Green (ICG) presents high nonlinear optical properties, such
as an efficient RSA (O'Flaherty et al., 2003), which makes it an interesting candidate for
optics-related applications, such as optical limiting devices. Indocyanine Green can also be
used as laser dye and saturable absorber. In medicine, ICG has been used for diagnosis and
photo-dynamic therapy (PDT) of cancer. The intersystem-crossing time and quantum yield
of triplet formation of ICG in different solvents have already been investigated (Reindl et al.,
1997). These results revealed that the conversion efficiency to the triplet state is diminished
by increasing the solvent polarity. The same behavior was observed for
τ
01
. For instance, in
DMSO (apolar solvent),
τ
01
is 30 times greater than that observed in polar solvents. This
section presents the nonlinear absorption of ICG obtained using single pulse and pulse train
Z-scan techniques, both at 532 nm. Using the single pulse Z-scan and a theoretical analysis
employing a three-energy level diagram, the excited singlet absorption cross-section was
determined. Additionally, with the PTZ-scan technique and a five-energy level diagram, the
intersystem-crossing time and the triplet absorption cross-section were obtained (De Boni et
al.,2007).
Figure 12 shows the linear absorption spectrum of ICG diluted in DMSO. It has a strong
band around 800 nm, related to the
∗→
π
π
transition. At 532 nm, wavelength employed
in the nonlinear optical measurements, only a small absorption was measured.
600 700 800 900
0.0
0.2
0.4
0.6
0.8
1.0
normalized absorbance
wavelength (nm)
Fig. 12. Absorption spectrum of Indocyanine Green in DMSO.
Figure 13 (a) shows the decrease of the normalized transmittance (NT) for ICG as a function
of the pulse irradiance, characterizing a RSA process. From this figure, it is possible to see
saturation of the NT due to the accumulation of molecules in the first singlet excited state
(
1 ) and to the depletion of the ground state ( 0 ).
Advances in Lasers and Electro Optics
50
0123
0.6
0.7
0.8
0.9
1.0
1.1
0 5 10 15 20
normalized transmittance
irradiance (GW/cm
2
)
(a)
pulse number
(b)
Fig. 13. (a) Normalized transmittance as a function of pulse irradiance for ICG in DMSO.
The solid line represents the fitting obtained with three-energy-level diagram.
(b) Normalized transmittance along of the Q-switch envelope (pulse number) for the same
sample. The solid line represents the theoretical curve obtained with parameters given in the
text, using the five-energy-level diagram.
As seen in Figure 13 (a), the saturation for ICG in DMSO occurs at
∼ 2 GW/cm
2
, a relatively
low intensity for this type of nonlinear process. This low saturation intensity for ICG is
related to its
01 →
transition lifetime (
10
τ
~ 700 ps)(Reindl et al., 1997), which allows a
considerable accumulation of ICG molecules in the singlet excited state
1
. With more
molecules in the first excited state, more transitions occur to the second excited state
2
,
which presents an absorption cross-section approximately null. This process can be
visualized by the increase in the NT curve fitting that occurs after 3 GW/cm
2
. In order to fit
the experimental data obtained with the single pulse Z-scan technique (Figure 13 (a)), the
three-energy-level diagram shown in Figure 14 (a), representing only the singlet states of the
molecule, was employed. As the band gap of ICG is around 1.5 eV, the internal conversion
(IC) process must be taken into account in the rate equations used to describe the population
dynamics. The triplet states were neglected because the duration of each single pulse is
shorter than the intersystem-crossing time. In this case, only the singlet states contribute to
the nonlinear absorption process. The transition lifetime (
10
τ
) can be described by
ICr
τ
τ
τ
/1/1/1
10
+=
, where
5≈
r
τ
ns and
840≈
ic
τ
ps (Reindl et al., 1997) are singlet radiative
lifetime and internal conversion time respectively.
It was also assumed that the lifetime of the second excited singlet state,
21
τ
, is in the order of
a few femtoseconds; therefore, the population of this state is small at low irradiances. Hence,
to describe the fraction of molecules in each state, the rate equations used are given by:
10
1
001
0
τ
n
nw
dt
dn
+−= (18)
21
2
10
1
112001
1
ττ
nn
nwnw
dt
dn
+−−+= (19)
Nonlinear Optical Absorption of Organic Molecules for Applications in Optical Devices
51
21
2
112
2
τ
n
nw
dt
dn
−+= (20)
τ
isc
τ
10
τ
21
σ
01
σ
12
σ
T
τ
10
τ
21
σ
01
σ
12
(a) (b)
0
1
2
0
1
2
4
5
Fig. 14. Three- (a) and five- (b) energy-level diagrams used to model the single pulse and
pulse train Z-scan results for ICG.
where
i
n ’s are the population fractions of the singlet states with 1
210
=++ nnn . The terms
in these equations have already been described in the previous sections. The time
dependence of absorption coefficient during the excitation is given by:
}{
021010
)()()(
σ
σ
α
tntnNt += (21)
As mentioned in the previous sections,
01
α
is obtained from the linear absorption spectrum
(
N
0101
α
σ
=
) and, therefore, the only adjustable parameter in this fitting procedure is
12
σ
.
The value determined from the fitting was
()
217
12
10112 cm
−
×±=
σ
, which is 75 times higher
than the ground state cross-section (
217
01
1016.0 cm
−
×=
σ
).
Figure 13 (b) displays the accumulative nonlinearity for ICG obtained with pulse trains Z-
scan technique. As seen, NT decreases with the pulse number up to about pulse 10, after
which a small increase can be observed. This behavior could be understood by using a five-
energy-level diagram, shown in Figure 14 (b). When excited by a pulse of the train to level
1
, the molecule can undergo an intersystem-crossing to the triplet state
4
, return to the
ground state
0
, or be promoted to a second excited state
2
. With the arrival of the next
pulse of the envelope, accumulative contributions to the optical nonlinearity, due to
population built up in the long-lived (~
μs)
4
state, start to appear. The molecules in this
state can be promoted to a second triplet state,
5
, resulting in a change in the molecule
absorption. Given the low irradiance of each individual pulse of the train and the short
lifetime of levels
2
and
5
, their population can be neglected. Considering this model, the
fractions of molecules in each state are given by:
10
1
001
0
τ
n
nw
dt
dn
+−= (22)
f
n
nw
dt
dn
τ
1
1
001
1
−+= (23)
Advances in Lasers and Electro Optics
52
isc
n
dt
dn
τ
14
= (24)
in which
4
n is the population fraction of the first triplet state. The
01 →
transition
lifetime is given by
iscf
τ
τ
τ
111
01
−= , where
f
τ
and
isc
τ
are the fluorescence lifetime and
the intersystem-crossing time respectively. This set of equations was numerically solved,
yielding the time evolution of the absorption as:
}{
T
tntntnNt
σσσα
)()()()(
4121010
++=
(25)
where
T
σ
is the triplet state transition absorption cross-section. The only adjustable
parameters are
T
σ
and
isc
τ
, once
01
σ
and
12
σ
are already known from the single pulse Z-
scan analysis. The solid line in Figure 13(b) represents the best fitting obtained.
The intersystem-crossing time obtained through the fitting was
ns
isc
)14( ±≈
τ
, which is in
good agreement with the one reported in the literature (Reindl et al., 1997). The quantum
yield of triplet formation,
T
φ
, was calculated using
iscfT
τ
τ
φ
/= and
isc
τ
values, providing
%15≈
T
φ
. The absorption cross-section of the triplet state found through the fitting
procedure was
217
10)15( cm
T
−
×±=
σ
. This value is 31 times higher than that of the ground
state cross-section (
217
1016.0 cm
T
−
×=
σ
). It was observed that
12
σ
is higher than
T
σ
(
4.2/
12
≈
T
σ
σ
), indicating that the excited singlet state gives a higher contribution to the
RSA process for ICG. In table 1 are the spectroscopic parameters obtained by fitting single
and pulse train Z-scan data. This table also shows other ICG spectroscopic parameters
obtained from the literature.
01
σ
12
σ
T
σ
f
τ
fl
φ
T
φ
ic
φ
isc
k
r
k
ic
k
16.0
112 ±
5.05 ±
40580 ± 106.0 04.015.0 ± 05.074.0 ± 6.05.2 ± 07.082.1 ±
111±
Table 1. Cross-section values (x10
-17
cm
2
) for ground
)(
01
σ
, excited singlet
)(
12
σ
and excited
triplet )(
T
σ
states at 532 nm. Fluorescence lifetime (
f
τ
) (ps) (Reindl et al., 1997),
fluorescence (
ft
φ
) (Reindl et al., 1997), triplet )(
T
φ
and internal conversion )(
ic
φ
quantum
yields and rates constants (x10
8
s
-1
) of intersystem-crossing )(
isc
k , radiative )(
r
k (Reindl et
al., 1997) and internal conversion
)(
ic
k
of ICG/DMSO solution.
5.4 Cytochrome C
5.4.1 NLOA in the nano and picosecond regime
Cytochrome C (cyt c) is one of the most intensively investigated redox proteins, which act as
electron carriers in the respiratory chain. It contains a covalent heme group linked to
polypeptide chains, which prevent aggregation, feature desirable, for instance, in
Photodynamic therapy (PDT). The heme group is an iron porphyrin, the same that is found
in hematoporphyrins, with peripheral groups bonded to pyrrole rings, while the
polypeptide chains are polymers made by amino acid residues linked by peptide bonds.
This section presents some results of Z-scan technique employed to characterize the
spectroscopic parameters and the dynamics of excited states of Fe
3+
cyt c molecules,
combined to pump-probe (Shapiro, 1977) measurements at 532 nm. The results clearly show
that the nonlinearity origin can be ascribed to population effects of the Q-band followed by
Nonlinear Optical Absorption of Organic Molecules for Applications in Optical Devices
53
a fast relaxation back to the singlet ground state. The saturable absorption process observed
has an intensity dependence and time evolution that can be described with a three-energy-
level diagram, yielding the excited state parameters of cyt c (Neto et al., 2004).
Figure 15 shows the UV-Vis absorption spectrum for oxidized cyt c water solution. The
strong band at 400 nm corresponds to the B (Soret) band, while the transition around 530 nm
is attributed to the Q-band of the metalloporphyrin complex. The origin of these bands is
related to
π-π* and charge transfer transitions. According to the absorption spectrum, only
the Q-band is excited when light at 532 nm is used.
300 400 500 600
0.0
0.2
0.4
0.6
0.8
1.0
normaized absorbance
wavelength (nm)
Fig. 15. Normalized absorbance spectrum of oxidized cyt c in water solution.
The results of the Z-scan measurements as a function of the pulse irradiance, in distinct
temporal regimes (ps and fs), are depicted as solid circles in Figure 16 (a) and (b). To explain
the behavior observed, the three-energy-level diagram presented in the inset of Figure 16
was considered, assuming that only the singlet states contribute to the nonlinear absorption
process. This assumption is based on the fact that the pulse duration is faster than the
intersystem-crossing time, which avoids any appreciable triplet state population buildup
during the light-matter interaction time. In addition, the excited singlet state
|2〉 was
assumed to be too short-lived to present an appreciable population buildup.
According to the three-energy-level diagram proposed, molecules at the ground state |0〉 can
be promoted to level
|1〉 when excited by laser pulses of 70 ps at 532 nm, then decaying back
to
|0〉 with a relaxation time
τ
10.
Two-photon absorption processes were neglected because,
under resonant conditions, excited state processes (saturable absorption) prevail. (Andrade
et al., 2004). The rate equations used to describe the fraction of molecules remaining at
ground state are:
10
0
001
0
1
τ
n
nW
dt
dn
−
+−=
(25)
where n
0
and n
1
are the population fractions of the ground and first excited singlet state
respectively and W
01
=
σ
01
I/h
ν
is the one-photon transition rate. All the terms in Eq. 25
Advances in Lasers and Electro Optics
54
02468
1.0
1.1
1.2
1.3
0 20 40 60 80 100
normalized transmittance
Irradiance (GW/cm
2
)
τ
10
σ
01
σ
12
S
1
S
2
S
0
0
1
2
singlet
τ
10
σ
01
σ
12
S
1
S
2
S
0
τ
10
σ
01
σ
12
S
1
S
2
S
0
0
1
2
singlet
(a) (b)
Fig. 16. (a) Normalized transmittance as a function of the 70 ps pulse irradiance at 532 nm.
(b) Normalized transmittance as a function of the 120 fs pulse irradiance at 530 nm. The
solid line in (a) and (b) are the fitting obtained with the three-energy-level model (inset)
with the parameters given in the text.
have already been defined.
1
10
=+ nn
, because the population of the
2
state is neglected.
01
σ
was determined as 4.1 x 10
-17
cm
2
.
In addition, an independent measurement was performed to determine the decay time of
level
|1〉,
10
τ
, with the degenerate pump-probe technique at 532 nm, yielding a characteristic
time of 2.7 ps (Neto et al., 2004). Therefore, since all parameters of Eq. (25) are determined, it
can be numerically solved using a Gaussian temporal intensity pattern for the laser pulse,
yielding the population dynamics within the laser pulse. The time-dependent absorption
coefficient in this case is:
{}
121010
)()()(
σσα
tntnNt +=
(26)
where N is the concentration,
σ
12
is the excited state cross-section, and n
0
and n
1
are the
population fraction in each state. By fitting the experimental data, the best value found for
σ
12
was 3.7 x 10
-17
cm
2
, which is on the same order of magnitude of those reported in the
literature for metallporphyrins (Blau et al., 1985, Neto et al., 2003). Since the intersystem-
crossing time is unknown, the possibility of the triplet state acquiring some population
cannot be disregarded a priori. In order to confirm the excited singlet state cross-section
value and the three-energy-level model assumed, Z-scan measurements using 120 fs pulses
at 532 nm were carried out. In this case, one can safely state that the pulse duration is faster
than the intersystem-crossing time and that there is no triplet state population during the
pulse interaction, which certainly allows the use of the three-energy-level diagram. Again,
an increase due to a saturable absorption mechanism is observed in the normalized
transmittance as a function of irradiance, displayed in Fig 16(b), indicating that laser pulses
are populating the excited state. The solid line represents the theoretical fitting obtained
Nonlinear Optical Absorption of Organic Molecules for Applications in Optical Devices
55
with the model described previously, resulting in
σ
12
= 3.7 x 10
-17
cm
2
, which is the same
value found in the picosecond Z-scan experiment. This result indicates that, even when
picosecond pulses are used, the triplet state is not populated, supporting the assumption
made on the three-level energy model used to explain the experimental results. It also
implies that the intersystem-crossing time of cyt c should be in the order of a few hundred
picoseconds (Sazanovich et al., 2003).
The short singlet state lifetime is a clear indication of the fast intersystem-crossing time,
which is a characteristic of porphyrins with open shell ions (Kalyanasundaram, 1992). This
short intersystem-crossing time, compared with those of closed shell porphyrins
(Kalyanasundaram, 1984), indicates an efficient singlet-triplet conversion, making
hematoporphyrins suitable for applications as a PDT sensitizer. Besides, cyt c is a
biocompatible molecule, which is a requirement for medical applications.
6. Conclusion
This chapter aimed to describe the resonant nonlinear optical properties of four important
organic molecules: Chlorophyll A, Indocyanine Green, Ytterbium Bisphthalocyanine and
Cytochrome C, which are materials that present interesting optical nonlinearities for
applications in optical devices. It was shown that Chlorophyll A solution exhibits a RSA
process for Q-switched and mode-locked laser pulses, with an intersystem-crossing time
relatively fast and a triplet state cross section value twice higher than that of the singlet.
Such features are desired for applications in PDT. However, due to the low triplet–singlet
cross-section ratio, Chlorophyll A is not expected to be efficient as an optical limiter. In
addition, the excited state population buildup generated with the WLC Z-scan technique
can be advantageously used to shape the pulse intensity spectrum in order to match the
most intense linear absorption band of the material. As a consequence, one can obtain an
enhancement of the nonlinear absorption in a transparent region through excited state
absorption. In practical terms, WLC pulses could be used in applications where a high RSA
process is needed in the blue region of the spectrum. RSA at 532 nm for ICG solution was
also described. For single pulse experiments, it was determined that the excited singlet state
cross-section is 75 times higher than that of the ground state. However, when pulse trains
are employed, triplet population is identified, with an intersystem-crossing time in the
nanosecond time scale. In this case, the triplet absorption cross-section found is 31 times
higher than the ground state one. These results indicate ICG as a candidate for applications
requiring high RSA, such as optical limiters and all-optical switches. Regarding Ytterbium
Bis-phtalocyanine, it was shown that this molecule presents two possible ground state levels
and both can absorb the excitation light for some wavelength range. When using
femtosecond laser pulses, it was also possible to observe distinct resonant nonlinear
absorption behaviours (SA and RSA) depending on the wavelength. Basically, the excited
state absorption cross-section is approximately zero in the Q-band region, giving origin to a
strong SA process. Oxidized Cytochrome C in water solution exhibits a saturable absorption
process when resonant excitation at 532 nm (Q-band ) is employed. Its short singlet state
lifetime indicates a relatively fast intersystem-crossing time that can lead to an efficient
formation of the triplet state. Such feature prompts this molecule as an efficient sensitizer for
PDT applications. Therefore, organic molecules presenting high nonlinear optical absorption
processes are potential candidates as active media for applications in optical devices.
Advances in Lasers and Electro Optics
56
7. Acknowledgment
We acknowledge financial support from FAPESP and CNPq (Brazil) and AFOSR (FA9550-
07-1-0374)
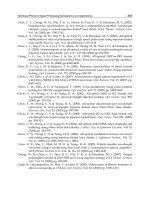
8. References
Andrade, A. A.; Neto, N. M. B.; Misoguti, L.; De Boni, L.; Zilio, S. C. & Mendonca, C. R.
(2004). Two-photon absorption investigation in reduced and oxidized cytochrome c
solutions. Chemical Physics Letters, 390, 4-6(Jun 1):506-510.
Baker, N. R. & Rosenqvist, E. (2004). Applications of chlorophyll fluorescence can improve
crop production strategies: an examination of future possibilities. Journal of
Experimental Botany, 55, 403(Aug):1607-1621.
Balu, M.; Hales, J.; Hagan, D. J. & Van Stryland, E. W. (2004). White-light continuum Z-scan
technique for nonlinear materials characterization. Optics Express, 12, 16(Aug
9):3820-3826.
Banfi, G.; Degiorgio, V. & Ricard, D. (1998). Nonlinear optical properties of semiconductor
nanocrystals. Advances in Physics, 47, 3(May-Jun):447-510.
Bhawalkar, J. D.; He, G. S. & Prasad, P. N. (1996). Nonlinear multiphoton processes in
organic and polymeric materials. Reports on Progress in Physics, 59, 9(Sep):1041-1070.
Blau, W.; Byrne, H.; Dennis, W. M. & Kelly, J. M. (1985). Reverse Saturable Absorption in
TetraPhenylPorphyrins. Optics Communications, 56, 1: 25-29.
Calvete, M.; Yang, G. Y. & Hanack, M. (2004). Porphyrins and phthalocyanines as materials
for optical limiting. Synthetic Metals, 141, 3(Mar 25):231-243.
Carter, G. A. & Spiering, B. A. (2002). Optical properties of intact leaves for estimating
chlorophyll concentration. Journal of Environmental Quality, 31, 5(Sep-Oct):1424-
1432.
Correa, D. S.; De Boni, L.; dos Santos, D. S.; Neto, N. M. B.; Oliveira, O. N.; Misoguti, L.;
Zilio, S. C. & Mendonca, C. R. (2002). Reverse saturable absorption in chlorophyll A
solutions. Applied Physics B-Lasers and Optics, 74, 6(Apr):559-561.
De Boni, L.; Andrade, A. A.; Misoguti, L.; Mendonca, C. R. & Zilio, S. C. (2004). Z-scan
measurements using femtosecond continuum generation. Optics Express, 12, 17(Aug
23):3921-3927.
De Boni, L.; Correa, D. S.; Pavinatto, F. J.; dos Santos, D. S. & Mendonca, C. R. (2007). Excited
state absorption spectrum of chlorophyll a obtained with white-light continuum.
Journal of Chemical Physics, 126, 16(Apr 28):165102.
De Boni, L.; Gaffo, L.; Misoguti, L. & Mendonca, C. R. (2006). Nonlinear absorption
spectrum of ytterbium bis-phthalocyanine solution measured by white-light
continuum Z-scan technique. Chemical Physics Letters, 419, 4-6(Feb 26):417-420.
De Boni, L.; Rezende, D. C. J. & Mendonca, C. R. (2007). Reverse saturable absorption
dynamics in indocyanine green. Journal of Photochemistry and Photobiology a-
Chemistry, 190, 1(Jul 5):41-44.
Fisher, A. M. R.; Murphree, A. L. & Gomer, C. J. (1995). Clinical and Preclinical
Photodynamic Therapy. Lasers in Surgery and Medicine, 17, 1:2-31.
Frackowiak, D.; Planner, A.; Waszkowiak, A.; Boguta, A.; Ion, R. M. & Wiktorowicz, K.
(2001). Yield of intersystem (singlet-triplet) crossing in phthalocyanines evaluated
Nonlinear Optical Absorption of Organic Molecules for Applications in Optical Devices
57
on the basis of a time in resolved photothermal method. Journal of Photochemistry
and Photobiology a-Chemistry, 141, 2-3(Jul 2):101-108.
Gouterman, M. (1961). Spectra of Porphyrins. Journal of Molecular Spectroscopy, 6, 1:138-163.
Hasegawa, J.; Ozeki, Y.; Ohkawa, K.; Hada, M. & Nakatsuji, H. (1998). Theoretical study of
the excited states of chlorin, bacteriochlorin, pheophytin a and chlorophyll a by the
SAC/SAC-CI method. Journal of Physical Chemistry B, 102, 7(Feb 12):1320-1326.
He, G. S.; Tan, L. S.; Zheng, Q. & Prasad, P. N. (2008). Multiphoton absorbing materials:
Molecular designs, characterizations, and applications. Chemical Reviews, 108,
4(Apr):1245-1330.
Kalyanasundaram, K. (1984). Photochemistry of water-soluble porphyrins: Comparative
study of isomeric tetrapyridyl- and tetrakis (N - methylpyridiniumyl) porphyrins.
Inorganic Chemistry, 23, 16, 2453-2459.
Kalyanasundaram, K. (1992). Photochemistry of polypyridine and porphyrin complexes,
Academic PressSan Diego.
Linnanto, J. & Korppi-Tommola, J. (2000). Spectroscopic properties of Mg-chlorin, Mg-
porphin and chlorophylls a, b, c(1), c(2), c(3) and d studied by semi-empirical and
ab initio MO/CI methods. Physical Chemistry Chemical Physics, 2, 21:4962-4970.
Loppacher, C.; Guggisberg, M.; Pfeiffer, O.; Meyer, E.; Bammerlin, M.; Luthi, R.; Schlittler,
R.; Gimzewski, J. K.; Tang, H. & Joachim, C. (2003). Direct determination of the
energy required to operate a single molecule switch. Physical Review Letters, 90,
6(Feb 14):066107.
Mendonça, C. R.; Gaffo, L.; Misoguti, L.; Moreira, W. C.; Oliveira, O. N. & Zilio, S. C. (2000).
Characterization of dynamic optical nonlinearities in ytterbium bis-phthalocyanine
solution. Chemical Physics Letters, 323, 3-4(Jun 16):300-304.
Mendonça, C. R.; Gaffo, L.; Moreira, W. C.; Oliveira, O. N. & Zilio, S. C. (2001). Optical
properties of ytterbium bis-phthalocyanine solution. Synthetic Metals, 121, 1-3(Mar
15):1477-1478.
Michel-Beyerle, M. E. (1985). Antennas and Reaction Centers of Photosynthetic Bacteria,
Springer-VerlagBerlin.
Misoguti, L.; Mendonca, C. R. & Zilio, S. C. (1999). Characterization of dynamic optical
nonlinearities with pulse trains. Applied Physics Letters, 74, 11(Mar 15):1531-1533.
Misoguti, L.; Mendonça, C. R. & Zilio, S. C. (1999). Characterization of dynamic optical
nonlinearities with pulse trains. Applied Physics Letters, 74, 11: 1531-1533.
Neto, N. M. B.; Andrade, A. A.; De Boni, L.; Misoguti, L.; Zilio, S. C. & Mendonca, C. R.
(2004). Excited-state absorption in oxidized cytochrome c solution. Applied Physics
B-Lasers and Optics, 79, 6(Oct):751-754.
Neto, N. M. B.; Correa, D. S.; Dos Santos, D. S.; Misoguti, L.; Oliveira, O. N.; Zilio, S. C. &
Mendonca, C. R. (2003). Influence of photodegradation on the optical limiting
process of chlorophyll A. Modern Physics Letters B, 17, 2(Jan 30):83-87.
Neto, N. M. B.; De Boni, L.; Rodrigues, J. J.; Misoguti, L.; Mendonca, C. R.; Dinelli, L. R.;
Batista, A. A. & Zilio, S. C. (2003). Dynamic saturable optical nonlinearities in free
base tetrapyridylporphyrin. Journal of Porphyrins and Phthalocyanines, 7, 6:452-456.
Neto, N. M. B.; Oliveira, S. L.; Misoguti, L.; Mendonca, C. R.; Goncalves, P. J.; Borissevitch, I.
E.; Dinelli, L. R.; Romualdo, L. L.; Batista, A. A. & Zilio, S. C. (2006). Singlet excited
state absorption of porphyrin molecules for pico- and femtosecond optical limiting
application. Journal of Applied Physics, 99, 12(Jun 15):123103.
Advances in Lasers and Electro Optics
58
O'Flaherty, S. M.; Hold, S. V.; Cook, M. J.; Torres, T.; Chen, Y.; Hanack, M. & Blau, W. J.
(2003). Molecular engineering of peripherally and axially modified phthalocyanines
for optical limiting and nonlinear optics. Advanced Materials, 15, 1(Jan 3):19-+.
Pang, Y.; Samoc, M. & Prasad, P. N. (1991). 3rd-Order Nonlinearity and 2-Photon-Induced
Molecular-Dynamics - Femtosecond Time-Resolved Transient Absorption, Kerr
Gate, and Degenerate 4-Wave-Mixing Studies in Poly(Para-Phenylene Vinylene)
Sol-Gel Silica Film. Journal of Chemical Physics, 94, 8(Apr 15):5282-5290.
Parusel, A. B. J. & Grimme, S. (2000). A theoretical study of the excited states of chlorophyll
a and pheophytin a. Journal of Physical Chemistry B, 104, 22(Jun 8):5395-5398.
Prasad, P. N. (1991). Polymeric Materials for Nonlinear Optics and Photonics. Polymer, 32,
10(1746-1751.
Prasad, P. N. & Willians, D. J. (1991). Introduction to Nonlinear Optical Effects in Molecules and
Polymers, Wiley-InterscienceNew York.
Reindl, S.; Penzkofer, A.; Gong, S. H.; Landthaler, M.; Szeimies, R. M.; Abels, C. & Baumler,
W. (1997). Quantum yield of triplet formation for indocyanine green. Journal of
Photochemistry and Photobiology a-Chemistry, 105, 1(May 15):65-68.
Rivadossi, A.; Zucchelli, G.; Garlaschi, F. M. & Jennings, R. C. (2004). Light absorption by the
chlorophyll a-b complexes of photosystem II in a leaf with special reference to
LHCII. Photochemistry and Photobiology, 80, 3(Nov-Dec):492-498.
Sazanovich, I. V.; Ganzha, V. A.; Dzhagarov, B. M. & Chirvony, V. S. (2003). Dichroism of
the triplet-triplet transient absorption of copper(II) porphyrins in liquid solution.
New interpretation of the subnanosecond relaxation component'. Chemical Physics
Letters, 382, 1-2(Nov 28):57-64.
Scheidt, W. R. & Reed, C. A. (1981). Spin-State Stereochemical Relationships in Iron
Porphyrins - Implications for the Hemoproteins. Chemical Reviews, 81, 6:543-555.
Shank, C. V.; Ippen, E. P. & Teschke, O. (1977). Sub-Picosecond Relaxation of Large Organic-
Molecules in Solution. Chemical Physics Letters, 45, 2:291-294.
Shapiro, S. L.,(1977), Topics in Applied Physics, New York.
Sheik-Bahae, M.; Said, A. A. & Van Stryland, E. W. (1989). High-Sensitivity, Single-Beam N2
Measurements. Optics Letters, 14, 17(Sep 1):955-957.
Shen, Y. R. (1984). The Principles of Nonlinear Optics, John Wiley,0471889989 New York.
Shirk, J. S.; Lindle, J. R.; Bartoli, F. J. & Boyle, M. E. (1992). 3rd-Order Optical Nonlinearities
of Bis(Phthalocyanines). Journal of Physical Chemistry, 96, 14(Jul 9):5847-5852.
Sundholm, D. (1999). Density functional theory calculations of the visible spectrum of
chlorophyll a. Chemical Physics Letters, 302, 5-6(Mar 26):480-484.
Unnikrishnan, K. P.; Thomas, J.; Nampoori, V. P. N. & Vallabhan, C. P. G. (2002).
Wavelength dependence of nonlinear absorption in a bis-phthalocyanine studied
using the Z-scan technique. Applied Physics B-Lasers and Optics, 75, 8(Dec):871-874.
Vernon, L. P. & Seely, G. R. (1996). The Chlorophylls, AcademicNew York.
Wehling, A. & Walla, P. J. (2005). Time-resolved two-photon spectroscopy of photosystem I
determines hidden carotenoid dark-state dynamics. Journal of Physical Chemistry B,
109, 51(Dec 29):24510-24516.
Zigmantas, D.; Hiller, R. G.; Sundstrom, V. & Polivka, T. (2002). Carotenoid to chlorophyll
energy transfer in the peridinin-chlorophyll-a-protein complex involves an
intramolecular charge transfer state. Proceedings of the National Academy of Sciences of
the United States of America, 99, 26(Dec 24):16760-16765.
3
Optical and Spectroscopic Properties of
Polymer Layers Doped with Rare Earth Ions
Vaclav Prajzler
1
, Oleksiy Lyutakov
2
, Ivan Huttel
2
,
Jiri Oswald
3
and Vitezslav Jerabek
1
1
Czech Technical University in Prague, Department of Microelectronics
Technicka 2, 166 27 Prague 6,
2
Institute of Chemical Technology in Prague
Technicka 2, 166 28 Prague 6,
3
Institute of Physics of the Academy of Sciences Czech Republic v.v.i.
Cukrovarnicka 10, 162 00 Prague,
Czech Republic
1. Introduction
This chapter deals with description properties of a number of Rare-Earth (RE) ions in
polymer materials. The list of the RE elements with some of its basic properties are shown in
Table 1. The electronic structure of each trivalent RE element consists of partially filled 4f
subshell, and outer 5s
2
and 5p
6
subshell. With increasing nuclear charge electrons enter into
the underlying 4f subshell rather than the external 5d subshell. Since the filled 5s
2
and 5p
6
subshells screen the 4f electrons, the RE elements have very similar chemical properties. The
screening of the partially filled 4f subshells, by the outer closed 5s
2
and 5p
6
subshell, also
gives rise to sharp emission spectra independent of the host materials. The intra-subshell
transitions of 4f electrons lead to narrow absorption peaks in the ultra-violet, visible, and
near-infrared regions.
*Number of electros (n) in the 4f shell of three-valence Rare Earth ions.
Table 1. The Rare Earth elements and some of its properties
Advances in Lasers and Electro Optics
60
Trivalent RE ions can be used for many photonics applications. Erbium (Er), neodymium
(Nd), praseodymium (Pr) ions are well-known, because these elements have transitions
used in telecommunications systems. Except these RE ions other elements are intensively
studied. Europium (Eu), terbium (Tb) and cerium (Ce) produce red, green and blue light
which is used for full colour displays. Thulium (Tm) and holmium (Ho) lasers has received
a large amount of interest during last ten years because these elements are the best
candidates for a wide range of applications including medicine and eye-safe remote sensing
systems such as laser ranging, coherent Doppler lidar for wind sensing, wind-shear
detection and etc (Kenyon A.J.; 2002; Bourdet et al. 2000).
The choice of host materials for RE ions hardly influences the energy levels of the RE ions.
Therefore in principle any materials that have little absorption at the pump and emission
wavelength can be used. Up to now there have been published many papers describing
properties of RE-doped with many different materials. Photonics materials such as glasses,
optical crystals (LiNbO
3
, Al
2
O
3
, Y
2
O
3
) and semiconductors (Si, SiGe, SiC, GaN, etc.) are
conventional materials for accomplishing lasing action (Polman A; 1997; Wong, et al. 2002;
Zavada, et al. 1995). Recently there has been considerable interest in the development of
new photonics materials such as polymers which have better properties and a lower price. It
is due to fact that a number of properties make polymers attractive hosts for RE ions
including high transparency in the visible and near-infrared spectra, well controlled
refractive indices, good thermal stabilities, offering simple fabrication process and low cost
(Liang et al., 2003; Slooff et al., 2002; Sosa et al., 2003; Tung et al., 2005) .
Polymers doped with RE-ions are still a new area and there is only a small number of groups
active in this field as for example: L.H. Slooff from the FOM Institute for Atomic and
Molecular Physics, Amsterdam, The Netherlands, W.H. Wong from the Department of
Electronic Engineering and Department of Physics and Material Sciences, City University of
Hong Kong, H. Liang from Structure Research Laboratory and Department of Polymer Science
and Engineering, University of Science and Technology of China and X. Xu from Optical
Physics Laboratory, Institute of Physics, Chinese Academy of Sciences, Beijing, China.
For our research we chose two types of polymers. As first polymer we chose
Polymethylmethacrylate (PMMA) polymer because it is the most common used polymer
and we also used new of type polymer Epoxy Novolak Resin (ENR) due to its low optical
losses 0.2 dB/cm at 1090 nm, 0.77 dB/cm at 1310 nm, 1.71 dB/cm at 1550 nm and due to
easy fabrication process (Beche et al., 2005). We doped these two polymers with erbium (Er),
ytterbium (Yb), europium (Eu), neodymium (Nd), thulium (Tm), holmium (Ho),
praseodymium (Pr) and dysprosium (Dy) ions (Prajzler et al., 2007; Prajzler et al., 2008). We
chose these RE ions because Er
3+
doped materials can emit at 1530 nm and Tm
3+
doped
photonics materials can have emission bands around 1470 nm and from 1600 to 2100 nm.
Yb
3+
and Ho
3+
ions were used as co-dopants. Tm
3+
doped polymers were co-doped with
Ho
3+
ions and Er
3+
doped polymers were co-doped with Yb
3+
ions. Trivalent Dy
3+
ions are
studied for emission at 1300 nm. Other RE ions were chosen for photoluminescence study in
visible region.
2. Experimental part
2.1 PMMA layers
Fabrication process of PMMA layers doped with RE ions is following: Small pieces of
PMMA (Goodfellow) were left to dissolve in chloroform for a few days before being used in
Optical and Spectroscopic Properties of Polymer Layers Doped with Rare Earth Ions
61
the fabrication of PMMA layers. The layers were formed by the solution either being spin-
coated onto silicon and glass substrates or by being poured into bottomless molds placed on
a glass substrate and left to dry. For RE doping, solutions whose content ranged from 1.0 at.
% to 20.0 at. % RE-ions were added to the PMMA. For RE co-doping rare earth chloride or
Rare Earth fluoride were together dissolved in C
5
H
9
NO or C
2
H
6
OS. Samples containing 1.0
at. % erbium were co-doped with ytterbium in amounts also ranging from 1.0 at. % to 20.0
at. %.
2.2 Epoxy Novolak Resin
Commercially available polymer Epoxy Novolak Resin (NANO
TM
Su-8 10) supported by
Micro Resist Technology GmbH was used for fabrication of the RE doped samples.
Chemical structure of Epoxy Novolak Resin (ENR) polymer is shown in Fig.1.
Fig. 1. Structure of the Epoxy Novolak Resin polymer
Polymer layers were formed by the solution either being spin-coated onto silicon or by
being poured into bottomless molds placed on a quartz substrate and let to dry. After the
deposition the samples were baked at 90°C for 45 min and then UV light was used for
hardening. Finally hard baking at 90°C for 60 min was applied. The doping occurred using
anhydrous RE chloride or RE fluoride dissolved in C
2
H
6
OS (Sigma-Aldrich). For the doping,
solutions where the RE content ranged from 1.0 at. % to 20.0 at. % were added to the ENR
polymer.
3. Results and discussion
3.1 Infrared spectra
The fabricated samples were investigated by infrared spectroscopy (FT-IR). Infrared
reflectance and ATR spectra were obtained using a Bruker IFS 66/v FTIR spectrometer
equipped with a broadband MCT detector, to which 128 interferograms were added with a
resolution of 4 cm
-1
(Happ-Genzel apodization). Fig. 2a displays the FT-IR spectra of PMMA
layers doped with Er
3+
ions. Fig. 2b shows the FT-IR spectra of ENR layers doped with Nd
3+
ions in the wavelength range from 3900 to 2600 cm
−1
.