Fuel Injection Part 5 pot
Bạn đang xem bản rút gọn của tài liệu. Xem và tải ngay bản đầy đủ của tài liệu tại đây (925.41 KB, 20 trang )
Experimental study of spray generated by a new type of injector with rotary swinging needle 73
shows that, generally, the range of the front of the spray generated by the RSN sprayer is
greater than that of the standard injector.
Fig. 8. The range of the Diesel Fuel spray front formed by the standard injector, at various
background pressures in the observation chamber
Fig. 9. The range of the front of the spray, formed by the RSN injector for fuels differing in
physical properties
As could be expected, the use of fuels of considerably greater viscosity affected both types of
injectors by considerably increasing the injection pressures. This was caused by a reduction
in the value of the index of fuel outflow from the sprayer holes. These changes were the
main contributors to the increased spray front range for fuels of increased viscosity (RO –
ν = 72.5 mm
2
/s; 70/30 RO/DF – ν = 29.0 mm
2
/s), in relation to (DF – ν = 5.9 mm
2
/s) – see
Figures 9 and 10. An additional reason for the increased range of the spray front when using
higher viscosity fuels (observed for both types of injectors), was probably due to the increase
in droplet size, when conditions conducive to their disintegration became worse.
From a comparison of Fig. 9 and 10, it may be seen that – as in the case of DF – the spray
range of other fuels was greater for the RSN injector over the entire time of spray
development.
Fig. 10. The range of the front of the spray, formed by the classical injector for fuels differing
in physical properties
5. The apex angle and surface area of the spray
In Fig. 11 it may be seen that, in the case of the RSN sprayer, a change in background
pressure did not significantly affect the values of the apex angles of the spray over the whole
period of its development. However, the spray surface area varied, the greatest area being
observed for p
b
= 15 bar, i.e., at the background pressure at which the range of the spray was
greatest.
Conversely, in the case of the standard injector, the effect of p
b
on the apex angle Θ
S
was
more visible – cp. Fig. 12. As could be expected, the largest apex angles occurred at
maximum background pressure. The values of the apex angles of the spray diminished
during its development, i.e., the penetration of the spray in a direction perpendicular to its
axis was reduced; this has a negative effect on mixing. It may be only partly compensated by
the fact that the spray surface area increases with its development. The smallest surface area
of the spray was recorded during the intermediate background pressure, p
b
= 20 bar, i.e., for
a value corresponding to the shortest range of the spray front.
From a comparison of Fig. 11 and 12 it will be seen that the values A
S
, achieved by the RSN
injector, were greater than for the standard injector. It may also indicate the superior
properties of the spray from the RSN injector, due to improved air/fuel mixing processes.
The larger area of the spray allows distribution of the fuel around the combustion chamber
of DI engine much effectively. In this case it is possible to reduce a rotary motion of the
charge. Too strong rotary motion of the charge can lead to sprays overlapping and can cause
the coalescence of fuel drops. It is unfavourable on account of PM formation.
Fuel Injection74
0.0 0.2 0.4 0.6 0.8 1.0 1.2 1.4
t
[
ms
]
0
2
4
6
8
10
A
s
[cm
2
]
0
10
20
30
40
50
s
[deg]
s
A
s
p
o
= 170 [bar], q = 130 [mm
3
/injection], n
p
= 600 [rpm]
p
b
= 25 [bar]
p
b
= 20 [bar]
p
b
= 15 [bar]
spray nozzle RSN
d
k
= 0.60 [mm], d
i
= 0.40 [mm]
Fig. 11. The apex angle and surface area of the spray formed by the RSN type at various
background pressures levels
0.0 0.2 0.4 0.6 0.8 1.0 1.2 1.4
t
[
ms
]
0
2
4
6
8
10
A
s
[cm
2
]
0
10
20
30
40
50
s
[deg]
s
A
s
p
o
= 170 [bar], q = 130 [mm
3
/injection], n
p
= 600 [rpm]
p
b
= 25 [bar]
p
b
= 20 [bar]
p
b
= 15 [bar]
spray nozzle D1LMK 140/M2
d
k
= 0.40 [mm]
Fig. 12. The apex angle and surface area of the spray formed by the classical injector at
various background pressures levels
The application of fuels with increased kinematic viscosity had little effect on the surface
area of the spray, A
S
(Fig. 13 and 14). At the same time, it may be noted that the dimensions
of this area are much greater for the RSN-type than for the standard injector
.
The value of the spray angles generated by the standard injector decreased inversely as the
sprays developed. The value of the angle was virtually independent of the type of fuel used.
On the other hand, in the case of the RSN sprayer, the apex angle of the spray was
dependent not only on the time of the spray development, but also on the type of fuel. It is
significant that the largest values of these angles were found in fuels with the lowest
viscosities and surface tension (DF). They did not change during the spray development
period. It is very likely that the smaller drops deviated more acutely towards outside the
Fig. 13. Apex angle and surface area of spray formed by the RSN model when spraying fuels
differing in physical properties
0.0 0.2 0.4 0.6 0.8 1.0 1.2 1.4
t
[
ms
]
0
2
4
6
8
10
0
10
20
30
40
50
s
A
s
spray nozzle D1LMK 140/M2
d
k
= 0.40 [mm]
p
o
= 170 [bar], p
b
= 20 [bar],q = 130 [mm
3
/injection], n
p
= 600 [rpm]
RO, = 72.5 [mm
2
/s]
70%RO+30%DF, = 29.0 [mm
2
/s]
DF, = 5.9 [mm
2
/s]
Fig. 14. Apex angle and surface area of spray formed by the standard injector, spraying fuels
with different physical properties
spray. RO, with the highest viscosity, behaved differently. The apex angle of the spray
increased steadily, and for time t = 1.2 ms (the end of the analysed fuel injection), it was
greater than for DF. Presumably, in this case the apex angle of the spray resulted from the
additional factor which increased the turbulence of outflow from the sprayer, caused by the
variability of cross-sections of the spraying holes, and the resulting permanent change in the
ratio of the length of the outlet hole to its sectional area.
Experimental study of spray generated by a new type of injector with rotary swinging needle 75
0.0 0.2 0.4 0.6 0.8 1.0 1.2 1.4
t
[
ms
]
0
2
4
6
8
10
A
s
[cm
2
]
0
10
20
30
40
50
s
[deg]
s
A
s
p
o
= 170 [bar], q = 130 [mm
3
/injection], n
p
= 600 [rpm]
p
b
= 25 [bar]
p
b
= 20 [bar]
p
b
= 15 [bar]
spray nozzle RSN
d
k
= 0.60 [mm], d
i
= 0.40 [mm]
Fig. 11. The apex angle and surface area of the spray formed by the RSN type at various
background pressures levels
0.0 0.2 0.4 0.6 0.8 1.0 1.2 1.4
t
[
ms
]
0
2
4
6
8
10
A
s
[cm
2
]
0
10
20
30
40
50
s
[deg]
s
A
s
p
o
= 170 [bar], q = 130 [mm
3
/injection], n
p
= 600 [rpm]
p
b
= 25 [bar]
p
b
= 20 [bar]
p
b
= 15 [bar]
spray nozzle D1LMK 140/M2
d
k
= 0.40 [mm]
Fig. 12. The apex angle and surface area of the spray formed by the classical injector at
various background pressures levels
The application of fuels with increased kinematic viscosity had little effect on the surface
area of the spray, A
S
(Fig. 13 and 14). At the same time, it may be noted that the dimensions
of this area are much greater for the RSN-type than for the standard injector
.
The value of the spray angles generated by the standard injector decreased inversely as the
sprays developed. The value of the angle was virtually independent of the type of fuel used.
On the other hand, in the case of the RSN sprayer, the apex angle of the spray was
dependent not only on the time of the spray development, but also on the type of fuel. It is
significant that the largest values of these angles were found in fuels with the lowest
viscosities and surface tension (DF). They did not change during the spray development
period. It is very likely that the smaller drops deviated more acutely towards outside the
Fig. 13. Apex angle and surface area of spray formed by the RSN model when spraying fuels
differing in physical properties
0.0 0.2 0.4 0.6 0.8 1.0 1.2 1.4
t
[
ms
]
0
2
4
6
8
10
0
10
20
30
40
50
s
A
s
spray nozzle D1LMK 140/M2
d
k
= 0.40 [mm]
p
o
= 170 [bar], p
b
= 20 [bar],q = 130 [mm
3
/injection], n
p
= 600 [rpm]
RO, = 72.5 [mm
2
/s]
70%RO+30%DF,
= 29.0 [mm
2
/s]
DF,
= 5.9 [mm
2
/s]
Fig. 14. Apex angle and surface area of spray formed by the standard injector, spraying fuels
with different physical properties
spray. RO, with the highest viscosity, behaved differently. The apex angle of the spray
increased steadily, and for time t = 1.2 ms (the end of the analysed fuel injection), it was
greater than for DF. Presumably, in this case the apex angle of the spray resulted from the
additional factor which increased the turbulence of outflow from the sprayer, caused by the
variability of cross-sections of the spraying holes, and the resulting permanent change in the
ratio of the length of the outlet hole to its sectional area.
Fuel Injection76
Fig. 15. The comparison of the apex angle, surface area, and the front-range of the spray
generated by the classical injector and the RSN type when spraying RO
In Fig. 15, an additional comparison of the surface area, apex angle and range of the spray
front for a spray of RO through a triple-hole standard injector and the RSN injector type, is
depicted. The studies were carried out at p
b
= 20 bar and a line pressure at injector opening
p
o
= 170 bar. The fuel dose was set at q = 130 mm
3
/injection, and the rotary velocity of the
camshaft of the injection pump was n
p
= 600 rpm. Despite the fact that smaller values of
injection pressures were noted for the RSN injector (p
wmax
= 300 bar, p
wav
= 189 bar, and for
the classical injector 376 bar and 236 bar, respectively), the surface area and range of the
spray front were much greater in this case. Only the apex angle of the spray in the initial
phase of the injection had a lower value for the spray generated by this injector (RSN type).
Later in the cycle, however, this angle increased rapidly and at the end of the analysed
period of spray development, the angle was greater by about 18 deg. Greater values of the
parameters A
S
, Θ
S
, and L
C
for the RSN injector probably resulted not only from the lack of
throttling of the fuel flow in the needle seat, but also from the mechanical action of the outlet
holes in the spray nozzle on the spray.
6. Radial distribution of fuel in spray drops generated
by standard and RSN injectors
Investigations of fuel distribution were carried out using both injectors in a spray of droplets,
at a constant injection pump speed of n
p
= 600 rpm. The fuel dose was adjusted to 130
mm
3
/injection and the line pressure at the injector was p
o
= 170 bar. Fuel was injected into a
background atmospheric of p
b
= 1 bar; the fuel level H
p
in the measuring vessels was read after
each 1000-cycle period. The radial distribution of fuel in a spray was measured by directing the
sprayed fuel into a series of standing measuring vessels. The inlet openings of the vessels were
perpendicular to the axis of the spraying hole. Fuel distribution in a spray was investigated by
placing the inlets of the measuring vessels at several distances from the edge of the inlet hole
of the sprayer body – S
r
. These were: 75, 150 and 210 mm. In addition, for each distance, the
series of vessels was rotated by 45 deg, which enabled determination of the fuel distribution in
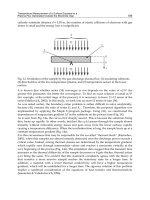
four planes, mutually inclined at angles of 45 deg. Fig. 17 and 18 have the following legend:
‘Position 90 deg’, denoting the axis ‘–x + x’ and the axis of a sprayer in one plane. ‘Position 45
deg’ denotes that the series of vessels had been turned through 45 deg in relation to position 90
deg.
4
5
°
r = 7 0 [mm]
s
r = 0
s
r = 70 [mm]
s
r = 0
s
r = 7 0 [mm]
s
r = 70 [mm]
s
-x +x
+
y
-y
-x
+x
+y
-y
Fig. 16. A series of cylindrical measuring vessels used in determining fuel distribution in
a spray of drops (top view)
Experimental study of spray generated by a new type of injector with rotary swinging needle 77
Fig. 15. The comparison of the apex angle, surface area, and the front-range of the spray
generated by the classical injector and the RSN type when spraying RO
In Fig. 15, an additional comparison of the surface area, apex angle and range of the spray
front for a spray of RO through a triple-hole standard injector and the RSN injector type, is
depicted. The studies were carried out at p
b
= 20 bar and a line pressure at injector opening
p
o
= 170 bar. The fuel dose was set at q = 130 mm
3
/injection, and the rotary velocity of the
camshaft of the injection pump was n
p
= 600 rpm. Despite the fact that smaller values of
injection pressures were noted for the RSN injector (p
wmax
= 300 bar, p
wav
= 189 bar, and for
the classical injector 376 bar and 236 bar, respectively), the surface area and range of the
spray front were much greater in this case. Only the apex angle of the spray in the initial
phase of the injection had a lower value for the spray generated by this injector (RSN type).
Later in the cycle, however, this angle increased rapidly and at the end of the analysed
period of spray development, the angle was greater by about 18 deg. Greater values of the
parameters A
S
, Θ
S
, and L
C
for the RSN injector probably resulted not only from the lack of
throttling of the fuel flow in the needle seat, but also from the mechanical action of the outlet
holes in the spray nozzle on the spray.
6. Radial distribution of fuel in spray drops generated
by standard and RSN injectors
Investigations of fuel distribution were carried out using both injectors in a spray of droplets,
at a constant injection pump speed of n
p
= 600 rpm. The fuel dose was adjusted to 130
mm
3
/injection and the line pressure at the injector was p
o
= 170 bar. Fuel was injected into a
background atmospheric of p
b
= 1 bar; the fuel level H
p
in the measuring vessels was read after
each 1000-cycle period. The radial distribution of fuel in a spray was measured by directing the
sprayed fuel into a series of standing measuring vessels. The inlet openings of the vessels were
perpendicular to the axis of the spraying hole. Fuel distribution in a spray was investigated by
placing the inlets of the measuring vessels at several distances from the edge of the inlet hole
of the sprayer body – S
r
. These were: 75, 150 and 210 mm. In addition, for each distance, the
series of vessels was rotated by 45 deg, which enabled determination of the fuel distribution in
four planes, mutually inclined at angles of 45 deg. Fig. 17 and 18 have the following legend:
‘Position 90 deg’, denoting the axis ‘–x + x’ and the axis of a sprayer in one plane. ‘Position 45
deg’ denotes that the series of vessels had been turned through 45 deg in relation to position 90
deg.
4
5
°
r = 7 0 [mm]
s
r = 0
s
r = 70 [mm]
s
r = 0
s
r = 7 0 [mm]
s
r = 70 [mm]
s
-x +x
+
y
-y
-x
+x
+y
-y
Fig. 16. A series of cylindrical measuring vessels used in determining fuel distribution in
a spray of drops (top view)
Fuel Injection78
The height of fuel in the measuring vessels was adopted (denoted by H
p
) as a comparative
measure to ascertain the fuel distribution in a spray of droplets. A radius at which a chosen
fuel column was located, i.e., the radial distance from the theoretical axis of a spray, was
denoted by r
s
(Fig. 16). ‘Direction x’ and ‘direction y’ (legends on figures), denote vessels
placed on the ‘–x + x’ and ‘–y + y’ axes, respectively, in Fig. 16.
Similar to the case of the direct observation studies – the standard injector with a D1LMK
140/M2 sprayer, and the new type injector – denoted as RSN, were studied.
Fig. 17. Comparison of the radial distribution of fuel in a spray in the ‘y’ direction for the
standard injector and the RSN type
Using histograms, Fig. 17 and 18 show the results of studies of the radial distribution of fuel in
a spray of drops, formed by the standard injector (D1LMK 140/M2) and the RSN type. For
simplicity, particular values of the radius r
s
are plotted against the measured heights of fuel
columns in the measuring vessels, H
p
, rather than the related values of the spray density.
As seen in the standard injector, the usual situation prevailed, and the highest concentration
of fuel lay at the core of the spray, i.e., the density of a unit spray has a maximum value at
the spray axis, where large diameter droplets are most numerous, as stated earlier. A
characteristic feature of fuel distribution in the standard spray is its symmetry around the
spray axis (the axis in line with the axis of symmetry of the outlet hole), and the levelling off
of the distribution as the distance from the sprayer increases (H
p
values diminish in the
centre and increase slightly towards the outside).
70
60
50
40
30
20
10
0
10
20
30
40
50
60
70
r
s
[mm]
0
20
40
60
80
100
H
p
[mm]
70
60
50
40
30
20
10
0
10
20
30
40
50
60
70
r
s
[mm]
0
20
40
60
80
100
H
p
[mm]
70
60
50
40
30
20
10
0
10
20
30
40
50
60
70
r
s
[mm]
0
20
40
60
80
100
H
p
[mm]
70
60
50
40
30
20
10
0
10
20
30
40
50
60
70
r
s
[mm]
0
20
40
60
80
100
H
p
[mm]
70
60
50
40
30
20
10
0
10
20
30
40
50
60
70
r
s
[mm]
0
20
40
60
80
100
H
p
[mm]
70
60
50
40
30
20
10
0
10
20
30
40
50
60
70
r
s
[mm]
0
20
40
60
80
100
H
p
[mm]
p
o
= 170 [bar], q = 130 [mm
3
/injection], n
p
= 600 [rpm], p
b
1 [bar]
spray nozzle D1LMK 140/M2 spray nozzle RSN
S
r
= 75 [mm]
S
r
= 75 [mm]
S
r
= 150 [mm]
S
r
= 150 [mm]
S
r
= 210 [mm] S
r
= 210 [mm]
direction x, location 45 deg
-x
+x
-x
-x -x
-x
-x
+x
+x +x
+x
+x
Fig. 18. Comparison of the radial distribution of fuel in a spray in the ‘x’ direction for the
standard injector and the RSN type
The levelling off of the fuel distribution in a spray as the distance from the sprayer increases
is caused by the size reduction of the droplets and the damping of their movement.
Additionally, the turbulent movements in a spray tend to carry fuel towards the outer layers
Experimental study of spray generated by a new type of injector with rotary swinging needle 79
The height of fuel in the measuring vessels was adopted (denoted by H
p
) as a comparative
measure to ascertain the fuel distribution in a spray of droplets. A radius at which a chosen
fuel column was located, i.e., the radial distance from the theoretical axis of a spray, was
denoted by r
s
(Fig. 16). ‘Direction x’ and ‘direction y’ (legends on figures), denote vessels
placed on the ‘–x + x’ and ‘–y + y’ axes, respectively, in Fig. 16.
Similar to the case of the direct observation studies – the standard injector with a D1LMK
140/M2 sprayer, and the new type injector – denoted as RSN, were studied.
Fig. 17. Comparison of the radial distribution of fuel in a spray in the ‘y’ direction for the
standard injector and the RSN type
Using histograms, Fig. 17 and 18 show the results of studies of the radial distribution of fuel in
a spray of drops, formed by the standard injector (D1LMK 140/M2) and the RSN type. For
simplicity, particular values of the radius r
s
are plotted against the measured heights of fuel
columns in the measuring vessels, H
p
, rather than the related values of the spray density.
As seen in the standard injector, the usual situation prevailed, and the highest concentration
of fuel lay at the core of the spray, i.e., the density of a unit spray has a maximum value at
the spray axis, where large diameter droplets are most numerous, as stated earlier. A
characteristic feature of fuel distribution in the standard spray is its symmetry around the
spray axis (the axis in line with the axis of symmetry of the outlet hole), and the levelling off
of the distribution as the distance from the sprayer increases (H
p
values diminish in the
centre and increase slightly towards the outside).
70
60
50
40
30
20
10
0
10
20
30
40
50
60
70
r
s
[mm]
0
20
40
60
80
100
H
p
[mm]
70
60
50
40
30
20
10
0
10
20
30
40
50
60
70
r
s
[mm]
0
20
40
60
80
100
H
p
[mm]
70
60
50
40
30
20
10
0
10
20
30
40
50
60
70
r
s
[mm]
0
20
40
60
80
100
H
p
[mm]
70
60
50
40
30
20
10
0
10
20
30
40
50
60
70
r
s
[mm]
0
20
40
60
80
100
H
p
[mm]
70
60
50
40
30
20
10
0
10
20
30
40
50
60
70
r
s
[mm]
0
20
40
60
80
100
H
p
[mm]
70
60
50
40
30
20
10
0
10
20
30
40
50
60
70
r
s
[mm]
0
20
40
60
80
100
H
p
[mm]
p
o
= 170 [bar], q = 130 [mm
3
/injection], n
p
= 600 [rpm], p
b
1 [bar]
spray nozzle D1LMK 140/M2 spray nozzle RSN
S
r
= 75 [mm]
S
r
= 75 [mm]
S
r
= 150 [mm]
S
r
= 150 [mm]
S
r
= 210 [mm] S
r
= 210 [mm]
direction x, location 45 deg
-x
+x
-x
-x -x
-x
-x
+x
+x +x
+x
+x
Fig. 18. Comparison of the radial distribution of fuel in a spray in the ‘x’ direction for the
standard injector and the RSN type
The levelling off of the fuel distribution in a spray as the distance from the sprayer increases
is caused by the size reduction of the droplets and the damping of their movement.
Additionally, the turbulent movements in a spray tend to carry fuel towards the outer layers
Fuel Injection80
of the spray, and the distribution becomes more equal (Metz and Seika, 1998). This
phenomenon is related to the fuel movement in the later phase of injection and it is also
observed in the spray formed by the RSN-type injector. The levelling off of the fuel
distribution with increased distance from the sprayer seems to be a phenomenon shared
among sprays generated by both injector types.
A spray of fuel generated by the RSN sprayer shows asymmetry; the distribution in the ‘x’
direction differs from that in the ‘y’ direction. In the ‘y’ direction particularly, the
concentration of fuel is considerably larger (also when the series of vessels is rotated
through 45 deg). Moreover, in the ‘y’ direction a greater shift of the area of the maximum
fuel concentration (core of a spray) may be observed in comparison to the ‘x’ direction. This
leads to the conclusion that the fuel distribution in the spray formed by the RSN sprayer
does not show any symmetry in relation to the theoretical axis of the spray.
The largest shift of the spray core from the theoretical axis for the RSN sprayer was
observed in the ‘y’ direction. This effect appeared when the axis of the sprayer was in one
plane with the axis at –x + x. In this position the axis of the needle rotation was
perpendicular to the ‘y’ direction. The asymmetry of the core of the spray generated by the
RSN sprayer may be explained by the change of the cross-sections of the outlet holes and the
resulting mechanical action of the surface of the hole in the sprayer body on the fuel being
discharged. The fuel, flowing through the spraying hole (particularly in the opening phase),
hit the surface of the outlet hole. This changed the direction of the flow, which caused
variations in the position of the core in the cross-section of the spray.
The spray generated by standard injector is axially symmetric. More fuel saturation in the
spray core causes a different value of combustion air factor. This is unfavourable, because
soot is usually produced in the rich mixture area (local deficiency of air) at a sufficiently
high temperature (800–1400 K). This happens mainly in the core of the fuel spray and at its
rear, where the concentration of fuel droplets is often higher.
Executed investigations of radial distribution of fuel in spray confirm that the spray
generated by RSN injector is not symmetrical. The shift of the spray core outside (as effect of
needle rotary) can be favourable on account of the possibly stronger impact of gas medium
on spray zone, where the concentration of the fuel is higher. In this case, the secondary drop
break-up will be more intensive. Smaller diameters of drops are obviously favourable with
regard to soot and PM formation.
7. Conclusions
The parameters of the injection system have a decisive effect on the rate of combustion in the
diesel engine, because of the influence on quality of formed air-fuel mixture. However, the
optimal macrostructure of the spray, which is distributed in the cylinder volume, depends
on the type and construction of the injector. On braking, the fuel stream in drops increases
the area of contact between the fuel and air. It causes, first of all, fuel vaporisation and, then,
its diffusion into air. The pressure energy generated by the injection system is consumed on
spraying of the fuel stream which, together with the phenomena of physical and chemical
parts of self-ignition delay, leads to fast increase in mixture entropy.
A better quality of fuel spraying guarantees RSN injector, which was confirmed by model
investigations. The selected results have been presented in the paper.
The results of these investigations show that fuel sprays formed by using a RSN type injector
differ from those generated by a standard injector. In particular, the parameters analysed, i.e.,
the range of the spray-front, the apex angle of the spray and its surface area, reach greater
values for a spray formed by the new RSN type of sprayer; this may positively affect the
ecological impact as well as the performance of engines fitted with injectors of this type.
Variation in the conditions of injection (pressure changes in the gaseous medium into which
fuel is injected, change due to use of fuels of differing viscosity), affects the macrostructure
of sprays generated differently by each type of injector. The best example may be the
variance in the apex angle of the spray while spraying RO. In the standard injector, it was
found that this angle diminished as the spray developed, while in the RSN injector the
opposite tendency was observed.
The investigations of fuel distribution in a spray of droplets confirm that the spray
generated by the RSN-type injector develops in a different way from that generated by the
standard injector. In particular, the results of these studies show the asymmetry of the spray
formed by the new type of injector.
More favourable parameters of the macrostructure of the spray generated by the RSN
injector allow the air-fuel mixture to burn more completely. Next, it provides reducing of
emission of toxic components from exhaust gases. However, for using a new type of injector,
modification of the combustion chamber is needed. This modification has to consider higher
values of spray macrostructure parameters. For example, a confirmed larger range of the
spray formed by a new type of injector can be served. At injection into the combustion
chamber without modification, the spray can settle on the walls of combustion chamber
which can cause increase in PM emission. The authors conducted investigations in this
range and intend to publish them in the subsequent papers.
8. Nomenclature
The Table 1 shows the parameters for the atomization of fuel, which were used in the study.
Additionally, there are used description of parameters, if required.
Quantity Unit Specification
A
S
[cm
2
]
Surface of view of fuel spray on perpendicular plane to
spray nozzle axis
L
C
[mm] Tip penetration of fuel spray
Θ
S
[deg] Apex angle of fuel spray
H
p
[mm]
Fuel level (at measuring of the fuel radial distribution in
a spray)
S
r
[mm]
Distance of an inlet area of the measuring vessel from the
edge of outlet hole in spray nozzle body (measuring fuel
radial distribution in a spray)
r
s
[mm]
Distance measuring point from the theoretical axis spray
(measuring fuel radial distribution in a spray)
d
k
[mm] Outlet hole diameter in a needle
d
i
[mm] Outlet hole diameter in a spray nozzle body
Table 1. Description of parameters used in the study
Experimental study of spray generated by a new type of injector with rotary swinging needle 81
of the spray, and the distribution becomes more equal (Metz and Seika, 1998). This
phenomenon is related to the fuel movement in the later phase of injection and it is also
observed in the spray formed by the RSN-type injector. The levelling off of the fuel
distribution with increased distance from the sprayer seems to be a phenomenon shared
among sprays generated by both injector types.
A spray of fuel generated by the RSN sprayer shows asymmetry; the distribution in the ‘x’
direction differs from that in the ‘y’ direction. In the ‘y’ direction particularly, the
concentration of fuel is considerably larger (also when the series of vessels is rotated
through 45 deg). Moreover, in the ‘y’ direction a greater shift of the area of the maximum
fuel concentration (core of a spray) may be observed in comparison to the ‘x’ direction. This
leads to the conclusion that the fuel distribution in the spray formed by the RSN sprayer
does not show any symmetry in relation to the theoretical axis of the spray.
The largest shift of the spray core from the theoretical axis for the RSN sprayer was
observed in the ‘y’ direction. This effect appeared when the axis of the sprayer was in one
plane with the axis at –x + x. In this position the axis of the needle rotation was
perpendicular to the ‘y’ direction. The asymmetry of the core of the spray generated by the
RSN sprayer may be explained by the change of the cross-sections of the outlet holes and the
resulting mechanical action of the surface of the hole in the sprayer body on the fuel being
discharged. The fuel, flowing through the spraying hole (particularly in the opening phase),
hit the surface of the outlet hole. This changed the direction of the flow, which caused
variations in the position of the core in the cross-section of the spray.
The spray generated by standard injector is axially symmetric. More fuel saturation in the
spray core causes a different value of combustion air factor. This is unfavourable, because
soot is usually produced in the rich mixture area (local deficiency of air) at a sufficiently
high temperature (800–1400 K). This happens mainly in the core of the fuel spray and at its
rear, where the concentration of fuel droplets is often higher.
Executed investigations of radial distribution of fuel in spray confirm that the spray
generated by RSN injector is not symmetrical. The shift of the spray core outside (as effect of
needle rotary) can be favourable on account of the possibly stronger impact of gas medium
on spray zone, where the concentration of the fuel is higher. In this case, the secondary drop
break-up will be more intensive. Smaller diameters of drops are obviously favourable with
regard to soot and PM formation.
7. Conclusions
The parameters of the injection system have a decisive effect on the rate of combustion in the
diesel engine, because of the influence on quality of formed air-fuel mixture. However, the
optimal macrostructure of the spray, which is distributed in the cylinder volume, depends
on the type and construction of the injector. On braking, the fuel stream in drops increases
the area of contact between the fuel and air. It causes, first of all, fuel vaporisation and, then,
its diffusion into air. The pressure energy generated by the injection system is consumed on
spraying of the fuel stream which, together with the phenomena of physical and chemical
parts of self-ignition delay, leads to fast increase in mixture entropy.
A better quality of fuel spraying guarantees RSN injector, which was confirmed by model
investigations. The selected results have been presented in the paper.
The results of these investigations show that fuel sprays formed by using a RSN type injector
differ from those generated by a standard injector. In particular, the parameters analysed, i.e.,
the range of the spray-front, the apex angle of the spray and its surface area, reach greater
values for a spray formed by the new RSN type of sprayer; this may positively affect the
ecological impact as well as the performance of engines fitted with injectors of this type.
Variation in the conditions of injection (pressure changes in the gaseous medium into which
fuel is injected, change due to use of fuels of differing viscosity), affects the macrostructure
of sprays generated differently by each type of injector. The best example may be the
variance in the apex angle of the spray while spraying RO. In the standard injector, it was
found that this angle diminished as the spray developed, while in the RSN injector the
opposite tendency was observed.
The investigations of fuel distribution in a spray of droplets confirm that the spray
generated by the RSN-type injector develops in a different way from that generated by the
standard injector. In particular, the results of these studies show the asymmetry of the spray
formed by the new type of injector.
More favourable parameters of the macrostructure of the spray generated by the RSN
injector allow the air-fuel mixture to burn more completely. Next, it provides reducing of
emission of toxic components from exhaust gases. However, for using a new type of injector,
modification of the combustion chamber is needed. This modification has to consider higher
values of spray macrostructure parameters. For example, a confirmed larger range of the
spray formed by a new type of injector can be served. At injection into the combustion
chamber without modification, the spray can settle on the walls of combustion chamber
which can cause increase in PM emission. The authors conducted investigations in this
range and intend to publish them in the subsequent papers.
8. Nomenclature
The Table 1 shows the parameters for the atomization of fuel, which were used in the study.
Additionally, there are used description of parameters, if required.
Quantity Unit Specification
A
S
[cm
2
]
Surface of view of fuel spray on perpendicular plane to
spray nozzle axis
L
C
[mm] Tip penetration of fuel spray
Θ
S
[deg] Apex angle of fuel spray
H
p
[mm]
Fuel level (at measuring of the fuel radial distribution in
a spray)
S
r
[mm]
Distance of an inlet area of the measuring vessel from the
edge of outlet hole in spray nozzle body (measuring fuel
radial distribution in a spray)
r
s
[mm]
Distance measuring point from the theoretical axis spray
(measuring fuel radial distribution in a spray)
d
k
[mm] Outlet hole diameter in a needle
d
i
[mm] Outlet hole diameter in a spray nozzle body
Table 1. Description of parameters used in the study
Fuel Injection82
The continuation of Table 1
Quantity Unit Specification
h
t
[mm] Piston stroke of injector
α
i
[deg] Angle of needle rotation
f
c
[mm
2
] Geometrical flow area
q [mm
3
/injection] Fuel dose
t [ms] Time
n
p
[rpm] Rotational speed of injection pump camshaft
p
o
[bar] Static opening pressure of injector
p
b
[bar] Background pressure
p
wmax
[bar] Maximum fuel injection pressure
p
wav
[bar] Average fuel injection pressure
ν [mm
2
/s] Kinematic viscosity of fuel
DF - Diesel Fuel
RO - Rape Oil
9. References
Beck, N.J.; Uyehara, O.A. & Johnson, W.P. (1988) Effects of Fuel Injection on Diesel Combustion,
SAE Transactions, Paper 880299.
Dürnholz, M. & Krüger, M. (1997) Hat der Dieselmotor als Fahrzeugantrieb eine zukunft?, 6.
Aachener Kolloquium Fahrzeug – und Motorentechnik, Akwizgran, Germany.
Hiroyasu, H. & Arai, M. (1990) Structures of Fuel Sprays in Diesel Engines, SAE Transactions,
Paper 900475.
Kollmann, K. & Bargende, M. (1997) DI – Dieselmotor und DI – Ottomotor – Wohin geht die
Pkw – Motorenentwicklung?, Symposium Dieselmotorentechnik 98, Technische
Akademie Esslingen, Ostfildern, Germany.
Kuszewski, H. (2002) Wpływ zmiennych przekrojów wylotowych wtryskiwacza z obrotową iglicą
na rozpylanie oleju napędowego, PhD Dissertation, Cracow University of Technology,
Cracow, Poland.
Kuszewski, H. & Lejda, K. (2009) Experimental investigations of a new type of fueliing
system for heavy-duty diesel engines, International Journal of Heavy Vehicle Systems,
Inderscience Enterprises Ltd, Olney, UK.
Metz, N. & Seika, M. (1998) Die Luftqualität in Europa bis zum Jahre 2010 mit und ohne
EURO IV Grenzwerte, 19. Internationales Wiener Motorensymposium,
Fortschrittberichte VDI Reihe 12, Nr 348, Wien, Austria.
Peake, S. (1997) Vehicle and Fuel – Challenges Beyond 2000, Automotive Publishing, London,
UK.
Szlachta, Z. & Kuszewski, H. (2002) Wpływ zmiennych przekrojów wylotowych wtryskiwacza z
obrotową iglicą na rozpylanie oleju napędowego, Rep. 5 T12D 026 22, Cracow, Poland.
Szymański, J. & Zabłocki, M. (1992) Wtryskiwacz do silnika spalinowego, Patent Application in
Patent Department R.P, P-294889, Poland.
Varde, K.S. & Popa, D.M. (1983) Diesel Fuel Spray Penetration at High Injection Pressures,
SAE Transactions, Paper 830448.
Effect of injector nozzle holes on diesel engine performance 83
Effect of injector nozzle holes on diesel engine performance
Semin and Abdul Rahim Ismail
X
Effect of injector nozzle holes on
diesel engine performance
Semin
Institut Teknologi Sepuluh Nopember
Indonesia
Abdul Rahim Ismail
University Malaysia Pahang
Malaysia
1. Introduction
The four-stroke direct-injection diesel engine typical was measured and modeled by Bakar
et al (2007) using GT-POWER computational model and has explored of diesel engine
performance effect based on engine speeds. GT-POWER is the leading engine simulation
tool used by engine and vehicle makers and suppliers and is suitable for analysis of a wide
range of engine issues. The details of the diesel engine design vary significantly over the
engine performance and size range. In particular, different combustion chamber geometries
and fuel injection characteristics are required to deal effectively with major diesel engine
design problem achieving sufficiently rapid fuel-air mixing rates to complete the fuel-
burning process in the time available. According to Heywood (1988) and Ganesan (1999), a
wide variety of inlet port geometries, cylinder head and piston shapes, and fuel-injection
patterns are used to accomplish this over the diesel size range. The engine ratings usually
indicate the highest power at which manufacturer expect their products to give satisfactory
of power, economy, reliability and durability under service conditions. Maximum torque
and the speed at which it is achieved, is usually given also by Heywood (1988). The
importance of the diesel engine performance parameters are geometrical properties, the
term of efficiency and other related engine performance parameters. The engine efficiencies
are indicated thermal efficiency, brake thermal efficiency, mechanical efficiency, volumetric
efficiency and relative efficiency (Ganesan, 1999). The other related engine performance
parameters are mean effective pressure, mean piston speed, specific power output, specific
fuel consumption, intake valve mach index, fuel-air or air-fuel ratio and calorific value of the
fuel (Heywood, 1988; Ganesan, 1999; Semin et al., 2007). According to Heywood (1988) in
the diesel engine geometries design written that diesel engine compression ratio is
maximum cylinder volume or the displaced volume or swept and clearance volume divided
by minimum cylinder volume. And the power delivered by the diesel engine and absorbed
by the dynamometer is the product of torque and angular speed. The engine efficiencies,
every its efficiencies defined by Ganesan (1999).
5
Fuel Injection84
2. Important
In this chapter has investigated the effect of injector nozzle holes diameter geometries on the
performance of diesel engine such as indicated power, indicated torque, fuel consumption
and fuel in-engine cylinder. The investigation is using computational modelling based on
variation engine speeds.
3. Engine Performance Review
In the diesel engine geometries design by Heywood (1988), the diesel engine compression
ratio is maximum cylinder volume or the displaced volume or swept (V
d
) and clearance
volume (V
c
) divided by minimum cylinder volume (V
c
). The diesel engine compression ratio
can be calculated as below:
c
cd
c
V
VV
r
(1)
and the power delivered by the diesel engine and absorbed by the dynamometer is the
product of torque and angular speed. Diesel engine power definition as:
P = 2πNT
(2)
In the diesel engine efficiencies, every its efficiencies defined by Ganesan (1999). Indicated
thermal efficiency (η
ith
) is the ratio of energy (E) in the indicated power (ip) to the input fuel
energy. Brake thermal efficiency (η
bth
) is the ratio of energy in the brake power (bp),
Mechanical efficiency (η
m
) is defined as the ratio of brake power (bp) or delivered power to
the indicated power (ip) or power provided to the piston and it can also be defined as the
ratio of the brake thermal efficiency to the indicated thermal efficiency. Relative efficiency or
efficiency ratio (η
rel
) is the ratio of thermal efficiency of an actual cycle to that of the ideal
cycle, the efficiency ratio is a very useful criteria which indicates the degree of development
of the engine. Ganesan (1999) written that, the one of the very important parameters which
decides the performance of four-stroke engines is volumetric efficiency (η
v
), where four-
stroke engines have distinct suction stroke and therefore the volumetric efficiency indicates
the breathing ability of the engine. The volumetric efficiency is defined as the volume flow
rate of air into the intake system divided by the rate at which the volume is displaced by the
system. The normal range of volumetric efficiency at full throttle for SI engines is 80% to
85% and for CI engines is 85% to 90%.
E
ip
ith
(3)
E
bp
bth
(4)
ip
bp
m
(5)
2/
.
NV
m
dispa
a
v
(6)
efficiency standard-Air
efficiency thermalActual
rel
(7)
The other related engine performance was defined by Heywood (1988),
Kowalewicz
(1984)
, Stone (1997) and Ganesan (1999). Mean effective pressure (mep), where n
R
is the
number of crank revolutions for each power stroke per cylinder (two for four-stroke, one for
two-stroke cycles) as :
NV
Pn
mep
d
R
(8)
The measure of an engine’s efficiency which will be called the fuel conversion efficiency is
given by Heywood (1988):
HVfHVRf
R
HVf
c
Qm
P
QNnm
NPn
Qm
W
nf
/
/
(9)
Specific fuel consumption as :
P
m
sfc
f
(10)
In the engine testing, both the air mass flow rate m
a
and the fuel mass flow rate m
f
are
normally measured. The ratio of these flow rates is useful in defining engine operating
conditions are air/fuel ratio (A/F) and fuel/air ratio (F/A).
The following relationships between diesel engine performance parameters can be
developed. For power P:
R
HVaf
n
AFNQm
P
)/(
(11)
2
)/(
,
AFQNV
P
iaHVdvf
(12)
Effect of injector nozzle holes on diesel engine performance 85
2. Important
In this chapter has investigated the effect of injector nozzle holes diameter geometries on the
performance of diesel engine such as indicated power, indicated torque, fuel consumption
and fuel in-engine cylinder. The investigation is using computational modelling based on
variation engine speeds.
3. Engine Performance Review
In the diesel engine geometries design by Heywood (1988), the diesel engine compression
ratio is maximum cylinder volume or the displaced volume or swept (V
d
) and clearance
volume (V
c
) divided by minimum cylinder volume (V
c
). The diesel engine compression ratio
can be calculated as below:
c
cd
c
V
VV
r
(1)
and the power delivered by the diesel engine and absorbed by the dynamometer is the
product of torque and angular speed. Diesel engine power definition as:
P = 2πNT
(2)
In the diesel engine efficiencies, every its efficiencies defined by Ganesan (1999). Indicated
thermal efficiency (η
ith
) is the ratio of energy (E) in the indicated power (ip) to the input fuel
energy. Brake thermal efficiency (η
bth
) is the ratio of energy in the brake power (bp),
Mechanical efficiency (η
m
) is defined as the ratio of brake power (bp) or delivered power to
the indicated power (ip) or power provided to the piston and it can also be defined as the
ratio of the brake thermal efficiency to the indicated thermal efficiency. Relative efficiency or
efficiency ratio (η
rel
) is the ratio of thermal efficiency of an actual cycle to that of the ideal
cycle, the efficiency ratio is a very useful criteria which indicates the degree of development
of the engine. Ganesan (1999) written that, the one of the very important parameters which
decides the performance of four-stroke engines is volumetric efficiency (η
v
), where four-
stroke engines have distinct suction stroke and therefore the volumetric efficiency indicates
the breathing ability of the engine. The volumetric efficiency is defined as the volume flow
rate of air into the intake system divided by the rate at which the volume is displaced by the
system. The normal range of volumetric efficiency at full throttle for SI engines is 80% to
85% and for CI engines is 85% to 90%.
E
ip
ith
(3)
E
bp
bth
(4)
ip
bp
m
(5)
2/
.
NV
m
dispa
a
v
(6)
efficiency standard-Air
efficiency thermalActual
rel
(7)
The other related engine performance was defined by Heywood (1988),
Kowalewicz
(1984)
, Stone (1997) and Ganesan (1999). Mean effective pressure (mep), where n
R
is the
number of crank revolutions for each power stroke per cylinder (two for four-stroke, one for
two-stroke cycles) as :
NV
Pn
mep
d
R
(8)
The measure of an engine’s efficiency which will be called the fuel conversion efficiency is
given by Heywood (1988):
HVfHVRf
R
HVf
c
Qm
P
QNnm
NPn
Qm
W
nf
/
/
(9)
Specific fuel consumption as :
P
m
sfc
f
(10)
In the engine testing, both the air mass flow rate m
a
and the fuel mass flow rate m
f
are
normally measured. The ratio of these flow rates is useful in defining engine operating
conditions are air/fuel ratio (A/F) and fuel/air ratio (F/A).
The following relationships between diesel engine performance parameters can be
developed. For power P:
R
HVaf
n
AFNQm
P
)/(
(11)
2
)/(
,
AFQNV
P
iaHVdvf
(12)
Fuel Injection86
For torque T :
4
)/(
,
AFQV
T
iaHVdvf
(13)
For mean effective pressure :
mep =
)/(
,
AFQ
iaHVvf
(14)
The specific power or the power per unit piston area is a measure of the engine designer’s
success in using the available piston area regardless of cylinder size. The specific power is :
2
)/(
,
AFNLQ
A
P
iaHVvf
p
(15)
Mean piston speed :
4
)/(
,
AFQSN
A
P
iaHVpvf
p
(16)
Heywood (1988) written that, specific power is thus proportional to the product of mean
effective pressure and mean piston speed. These relationship illustrated the direct
importance to engine performance of high fuel conversion efficiency, high volumetric
efficiency, increasing the output of a given displacement engine by increasing the inlet air
density, maximum fuel/air ratio that can be useful burned in the engine and high mean
piston speed.
4. Modelling of Injector Nozzle Holes
The four-stroke direct-injection (DI) diesel engine was presented in this chapter. The
specification of the selected diesel engine was presented in Table 1. To develop the four-
stroke direct-injection diesel engine modeling is step by step, the first step is open all of the
selected diesel engine components to measure the engine components part size. Then, the
engine components size data will be input to the software library of the all engine
components data. To create the model, select window and then tile with template library
from the menu. This will place the template library on the left hand side of the screen. The
template library contains all of the available templates that can be used in computational
modeling. Some of these templates those that will be needed in the project need to be copied
into the project before they can be used to create objects and parts. For the purpose of this
model, click on the icons listed and drag them from the template library into the project
library. Some of these are templates and some are objects that have already been defined
and included in the template library (Gamma Technologies, 2004). This chapter focused on
fuel nozzle hole of fuel injector. The engine modeling is according to Semin et al. (2007) as
shown in Fig. 1.
All of the parameters in the model will be listed automatically in the case setup and each
one must be defined for first case of the simulation. The physically of the injector fuel nozzle
hole material detailed were investigated in this research is shown in Fig. 2. In this figure was
showed the detail of injection hole or fuel nozzle hole. The fuel nozzle holes would be
changed in wide diameter of nozzle hole and in different number of nozzle hole.
Engine Parameters Value Engine Parameters Value
Model CF186F Intake valve close (
0
CA) 530
Bore (mm) 86.0 Exhaust valve open (
0
CA) 147
Stroke (mm) 70.0 Exhaust valve close (
0
CA) 282
Displacement (cc) 407.0 Max. intake valve open (mm) 7.095
Number of cylinder 1 Max. exhaust valve open (mm) 7.095
Connecting rod length (mm) 118.1
Valve lift periodicity (deg)
360
Piston pin offset (mm) 1.00
Fuel nozzle diameter (mm)
0.1
Intake valve open (
0
CA) 395
Fuel nozzle hole number (pc)
4
Table 1. Specification of the selected diesel engine
Fig. 1. Direct-injection diesel engine modeling
Effect of injector nozzle holes on diesel engine performance 87
For torque T :
4
)/(
,
AFQV
T
iaHVdvf
(13)
For mean effective pressure :
mep =
)/(
,
AFQ
iaHVvf
(14)
The specific power or the power per unit piston area is a measure of the engine designer’s
success in using the available piston area regardless of cylinder size. The specific power is :
2
)/(
,
AFNLQ
A
P
iaHVvf
p
(15)
Mean piston speed :
4
)/(
,
AFQSN
A
P
iaHVpvf
p
(16)
Heywood (1988) written that, specific power is thus proportional to the product of mean
effective pressure and mean piston speed. These relationship illustrated the direct
importance to engine performance of high fuel conversion efficiency, high volumetric
efficiency, increasing the output of a given displacement engine by increasing the inlet air
density, maximum fuel/air ratio that can be useful burned in the engine and high mean
piston speed.
4. Modelling of Injector Nozzle Holes
The four-stroke direct-injection (DI) diesel engine was presented in this chapter. The
specification of the selected diesel engine was presented in Table 1. To develop the four-
stroke direct-injection diesel engine modeling is step by step, the first step is open all of the
selected diesel engine components to measure the engine components part size. Then, the
engine components size data will be input to the software library of the all engine
components data. To create the model, select window and then tile with template library
from the menu. This will place the template library on the left hand side of the screen. The
template library contains all of the available templates that can be used in computational
modeling. Some of these templates those that will be needed in the project need to be copied
into the project before they can be used to create objects and parts. For the purpose of this
model, click on the icons listed and drag them from the template library into the project
library. Some of these are templates and some are objects that have already been defined
and included in the template library (Gamma Technologies, 2004). This chapter focused on
fuel nozzle hole of fuel injector. The engine modeling is according to Semin et al. (2007) as
shown in Fig. 1.
All of the parameters in the model will be listed automatically in the case setup and each
one must be defined for first case of the simulation. The physically of the injector fuel nozzle
hole material detailed were investigated in this research is shown in Fig. 2. In this figure was
showed the detail of injection hole or fuel nozzle hole. The fuel nozzle holes would be
changed in wide diameter of nozzle hole and in different number of nozzle hole.
Engine Parameters Value Engine Parameters Value
Model CF186F Intake valve close (
0
CA) 530
Bore (mm) 86.0 Exhaust valve open (
0
CA) 147
Stroke (mm) 70.0 Exhaust valve close (
0
CA) 282
Displacement (cc) 407.0 Max. intake valve open (mm) 7.095
Number of cylinder 1 Max. exhaust valve open (mm) 7.095
Connecting rod length (mm) 118.1
Valve lift periodicity (deg)
360
Piston pin offset (mm) 1.00
Fuel nozzle diameter (mm)
0.1
Intake valve open (
0
CA) 395
Fuel nozzle hole number (pc)
4
Table 1. Specification of the selected diesel engine
Fig. 1. Direct-injection diesel engine modeling
Fuel Injection88
Fig. 2. Detail of injector fuel nozzle holes
Whenever the computational simulation is running, the computational model produces
several output files that contain simulation results in various formats. Most of the output is
available in the post-processing application. The software is powerful tool that can be used
to view animation and order analysis output (Gamma Technologies, 2004). After the
simulation was finished, report tables that summarize the simulations can be produced.
These reports contain important information about the simulation and simulation result in a
tabular form. The computational simulation of the engine model result is informed the
engine performance. The running simulation result in this research is focused on the engine
performance data based on variation of fuel nozzle material hole diameter size, diameter
number and the different engine speed (rpm). The diesel engine model was running on any
different engine speeds in rpm, there are 500, 1000, 1500, 2000, 2500, 3000 and 3500. The
variations of injector fuel nozzle holes number are based on multi holes and multi diameter
holes, the simulation model there are started from the injector fuel nozzle 1 hole, 2 holes, 3
holes, 4 holes, 5 holes, 6 holes, 7 holes, 8 holes, 9 holes and 10 holes.
5. Effect of Injector Nozzle Holes on Fuel in Engine Cylinder
The simulation results are shown in every cases, such as case 1 is on 500 rpm, case 2 is on
1000 rpm, case 3 is on 1500 rpm, case 4 is on 2000 rpm, case 5 is on 2500 rpm, case 6 is on
3000 rpm, case 7 is on 3500 rpm and case 8 on 4000 rpm. Numerous studies have suggested
that decreasing the injector nozzle orifice diameter is an effective method on increasing fuel
air mixing during injection (Baik, 2001). Smaller nozzle holes have found to be the most
efficient at fuel/air mixing primarily because the fuel rich core of the jet is smaller. In
addition, decreasing the nozzle hole orifice diameter, would reduce the length of the
potential core region. Unfortunately, decreasing nozzle holes size causes a reduction in the
turbulent energy generated by the jet.
Since fuel air mixing is controlled by turbulence generated at the jet boundary layer, this
will offset the benefits of the reduced jet core size. Furthermore, jets emerging from smaller
nozzle orifices were shown not to penetrate as far as those emerging from larger orifices.
This decrease in penetration means that the fuel will not be exposed to all of the available air
in the chamber. The effect of fuel nozzle holes number and geometries of in-cylinder engine
liquid fuel are shown in Fig. 3 – Fig. 12,
Fig. 3. Liquid fuel in cylinder of injector
nozzle 1 holes
Fig. 4. Liquid fuel in cylinder of injector
nozzle 2 holes
Fig. 5. Liquid fuel in cylinder of injector
nozzle 3 holes
Fig. 6. Liquid fuel in cylinder of injector
nozzle 4 holes
Fig. 7. Liquid fuel in cylinder of injector
nozzle 5 holes
Fig. 8. Liquid fuel in cylinder of injector
nozzle 6 holes
Effect of injector nozzle holes on diesel engine performance 89
Fig. 2. Detail of injector fuel nozzle holes
Whenever the computational simulation is running, the computational model produces
several output files that contain simulation results in various formats. Most of the output is
available in the post-processing application. The software is powerful tool that can be used
to view animation and order analysis output (Gamma Technologies, 2004). After the
simulation was finished, report tables that summarize the simulations can be produced.
These reports contain important information about the simulation and simulation result in a
tabular form. The computational simulation of the engine model result is informed the
engine performance. The running simulation result in this research is focused on the engine
performance data based on variation of fuel nozzle material hole diameter size, diameter
number and the different engine speed (rpm). The diesel engine model was running on any
different engine speeds in rpm, there are 500, 1000, 1500, 2000, 2500, 3000 and 3500. The
variations of injector fuel nozzle holes number are based on multi holes and multi diameter
holes, the simulation model there are started from the injector fuel nozzle 1 hole, 2 holes, 3
holes, 4 holes, 5 holes, 6 holes, 7 holes, 8 holes, 9 holes and 10 holes.
5. Effect of Injector Nozzle Holes on Fuel in Engine Cylinder
The simulation results are shown in every cases, such as case 1 is on 500 rpm, case 2 is on
1000 rpm, case 3 is on 1500 rpm, case 4 is on 2000 rpm, case 5 is on 2500 rpm, case 6 is on
3000 rpm, case 7 is on 3500 rpm and case 8 on 4000 rpm. Numerous studies have suggested
that decreasing the injector nozzle orifice diameter is an effective method on increasing fuel
air mixing during injection (Baik, 2001). Smaller nozzle holes have found to be the most
efficient at fuel/air mixing primarily because the fuel rich core of the jet is smaller. In
addition, decreasing the nozzle hole orifice diameter, would reduce the length of the
potential core region. Unfortunately, decreasing nozzle holes size causes a reduction in the
turbulent energy generated by the jet.
Since fuel air mixing is controlled by turbulence generated at the jet boundary layer, this
will offset the benefits of the reduced jet core size. Furthermore, jets emerging from smaller
nozzle orifices were shown not to penetrate as far as those emerging from larger orifices.
This decrease in penetration means that the fuel will not be exposed to all of the available air
in the chamber. The effect of fuel nozzle holes number and geometries of in-cylinder engine
liquid fuel are shown in Fig. 3 – Fig. 12,
Fig. 3. Liquid fuel in cylinder of injector
nozzle 1 holes
Fig. 4. Liquid fuel in cylinder of injector
nozzle 2 holes
Fig. 5. Liquid fuel in cylinder of injector
nozzle 3 holes
Fig. 6. Liquid fuel in cylinder of injector
nozzle 4 holes
Fig. 7. Liquid fuel in cylinder of injector
nozzle 5 holes
Fig. 8. Liquid fuel in cylinder of injector
nozzle 6 holes
Fuel Injection90
Fig. 9. Liquid fuel in cylinder of injector
nozzle 7 holes
Fig. 10. Liquid fuel in cylinder of
injector nozzle 8 holes
Fig. 11. Liquid fuel in cylinder of
injector nozzle 9 holes
Fig. 12. Liquid fuel in cylinder of
injector nozzle 10 holes
For excessively small nozzle size, the improvements in mixing related to decreased plume
size may be negated by a reduction in radial penetration (
Baumgarter, 2006). This behavior
is undesirable because it restricts penetration to the chamber extremities where a large
portion of the air mass resides. Furthermore, it hampers air entrainment from the head side
of the plume because the exposed surface area of the plume is reduced. It has been
suggested that a nozzle containing many small holes would provide better mixing than a
nozzle consisting of a single large hole. The effect of injector nozzle multi holes in-cylinder
engine unburned fuel are shown in Fig. 13 – Fig. 22.
The optimal nozzle design would be one that provided the maximum number of liquid fuel
burn in combustion process and minimum number of liquid fuel unburned. Theoretically, a
10 holes nozzle satisfies this requirement. Unfortunately, jets emerging from a 10 holes
nozzle tended to be very susceptible. All of the nozzles examined and the result shown that
the seven holes nozzle provided the best results for any different engine speeds in
simulation and the best performance shown on low speed engine.
Fig. 13. Unburned fuel in cylinder of
injector nozzle 1 holes
Fig. 14. Unburned fuel in cylinder of
injector nozzle 2 holes
Fig. 15. Unburned fuel in cylinder of
injector nozzle 3 holes
Fig. 16. Unburned fuel in cylinder of
injector nozzle 4 holes
Fig. 17. Unburned fuel in cylinder of
injector nozzle 5 holes
Fig. 18. Unburned fuel in cylinder of
injector nozzle 6 holes
Fig. 19. Unburned fuel in cylinder of
injector nozzle 7 holes
Fig. 20. Unburned fuel in cylinder of
injector nozzle 8 holes
Effect of injector nozzle holes on diesel engine performance 91
Fig. 9. Liquid fuel in cylinder of injector
nozzle 7 holes
Fig. 10. Liquid fuel in cylinder of
injector nozzle 8 holes
Fig. 11. Liquid fuel in cylinder of
injector nozzle 9 holes
Fig. 12. Liquid fuel in cylinder of
injector nozzle 10 holes
For excessively small nozzle size, the improvements in mixing related to decreased plume
size may be negated by a reduction in radial penetration (
Baumgarter, 2006). This behavior
is undesirable because it restricts penetration to the chamber extremities where a large
portion of the air mass resides. Furthermore, it hampers air entrainment from the head side
of the plume because the exposed surface area of the plume is reduced. It has been
suggested that a nozzle containing many small holes would provide better mixing than a
nozzle consisting of a single large hole. The effect of injector nozzle multi holes in-cylinder
engine unburned fuel are shown in Fig. 13 – Fig. 22.
The optimal nozzle design would be one that provided the maximum number of liquid fuel
burn in combustion process and minimum number of liquid fuel unburned. Theoretically, a
10 holes nozzle satisfies this requirement. Unfortunately, jets emerging from a 10 holes
nozzle tended to be very susceptible. All of the nozzles examined and the result shown that
the seven holes nozzle provided the best results for any different engine speeds in
simulation and the best performance shown on low speed engine.
Fig. 13. Unburned fuel in cylinder of
injector nozzle 1 holes
Fig. 14. Unburned fuel in cylinder of
injector nozzle 2 holes
Fig. 15. Unburned fuel in cylinder of
injector nozzle 3 holes
Fig. 16. Unburned fuel in cylinder of
injector nozzle 4 holes
Fig. 17. Unburned fuel in cylinder of
injector nozzle 5 holes
Fig. 18. Unburned fuel in cylinder of
injector nozzle 6 holes
Fig. 19. Unburned fuel in cylinder of
injector nozzle 7 holes
Fig. 20. Unburned fuel in cylinder of
injector nozzle 8 holes
Fuel Injection92
Fig. 21. Unburned fuel in cylinder of
injector nozzle 9 holes
Fig. 22. Unburned fuel in cylinder of
injector nozzle 10 holes
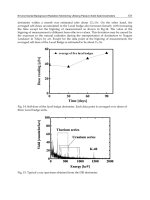
6. Effect of Injector Nozzle Holes on Engine Performance
The simulation result on engine performance effect of injector fuel nozzle holes number and
geometries in indicated power, indicated torque and indicated specific fuel consumption
(ISFC) of engine are shown in Figure 23 – 25. The injector fuel nozzle holes orifice diameter
and injector nozzle holes numbers effect on indicated power, indicated torque and ISFC
performance of direct-injection diesel engine was shown from the simulation model running
output. An aerodynamic interaction and turbulence seem to have competing effects on
spray breakup as the fuel nozzle holes orifice diameter decreases. The fuel drop size
decreases if the fuel nozzle holes orifice diameter is decreases with a decreasing quantitative
effect for a given set of jet conditions.
Indicated Torque Effect of Fuel Nozzle Holes Number
0
5
10
15
20
25
30
35
40
45
0 500 1000 1500 2000 2500 3000 3500 4000 4500
Engine Speed (rpm)
Indicated Torque (N-m
)
Nozzle 1 hole Nozzle 2 holes Nozzle 3 holes Nozzle 4 holes Nozzle 5 holes
Nozzle 6 holes Nozzle 7 holes Nozzle 8 holes Nozzle 9 holes Nozzle 10holes
Fig. 23.
Effect of fuel nozzle holes on indicated torque of diesel engine
Indicated Power Effect of Fuel Nozzle Holes Number
0
1
2
3
4
5
6
7
8
9
10
0 500 1000 1500 2000 2500 3000 3500 4000 4500
Engine Speed (rpm)
Indicated Power (kW
)
Nozzle 1 hole Nozzle 2 holes Nozzle 3 holes Nozzle 4 holes Nozzle 5 holes
Nozzle 6 holes Nozzle 7 holes Nozzle 8 holes Nozzle 9 holes Nozzle 10holes
Fig. 24.
Effect of fuel nozzle holes on indicated power of diesel engine
ISFC Effect of Fuel Nozzle Holes Number
1100
1600
2100
2600
3100
3600
4100
4600
0 500 1000 1500 2000 2500 3000 3500 4000 4500
Engine Speed (rpm)
ISFC (g/kW-h
)
Nozzle 1 hole Nozzle 2 holes Nozzle 3 holes Nozzle 4 holes Nozzle 5 holes
Nozzle 6 holes Nozzle 7 holes Nozzle 8 holes Nozzle 9 holes Nozzle 10 holes
Fig. 25.
Effect of fuel nozzle holes on ISFC of diesel engine