Fuel Injection Part 13 pot
Bạn đang xem bản rút gọn của tài liệu. Xem và tải ngay bản đầy đủ của tài liệu tại đây (567.65 KB, 20 trang )
Experimental investigations into the production behavior of methane
hydrate in porous sediment under ethylene glycol injection and hot brine stimulation 233
hot water; the ascending section is the heterothermally endothermal process of the system in
the porous media in the effect of hot water after the hydrate dissociation has fully completed.
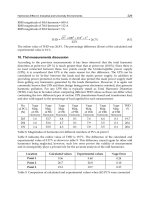
As shown in Figure 2, in the above three runs, the dissociation firstly happened in the inlet
of the vessel, and then in Port 2, Port 3 and Port 4 with time in turn until the hydrate in the
vessel was completely dissociated. Accordingly, it is considered that the dissociation process
of the hydrate in the vessel is the moving-forward process of the hydrate dissociation
boundary from the inlet to the outlet. In other words, the flowing of hot water injected in the
vessel can be regarded as the moving of a piston from the inlet to the outlet.
0 20 40 60 80
-10
0
10
20
30
40
50
60
Port 3Port 2
Port 1
Temperature /
o
C
Time / min
50
o
C
90
o
C
130
o
C
Fig. 1. The curve of the temperature change over time at Ports 1-3 in the vessel in Run H1,
Run H5 and Run H9 with the effect of hot water at 50
o
C, 90
o
C and 130
o
C
3.2.2 Brine stimulation
In Run H13-Run H16, the experiments of the brine stimulation was carried out. Figure 3
shows the curve of the temperature change over time at Port 4 in the vessel with the
injection of the brine solution at -1
o
C with 2, 8, 16 and 24 wt%, respectively. For Prot 1 and
Port 3, the characteristics of the curve of the temperature change over time are similar. Since
in the above experiments, the brine solution was injected into the vessel at -1
o
C, lower than
that of the hydrate system in the vessel (0
o
C), the hydrate dissociation can be only caused
from the inhibitors, not from the thermal effect.
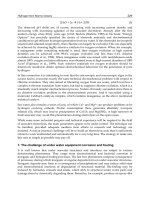
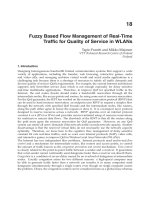
As shown in Figure 3 and discussed above, under the injection of the brine at 2 wt% and -1
o
C into the vessel, the hydrate was not dissociated. However, the hydrate dissociation can be
caused by the effect of the brine solution with higher concentrations. As shown in Figure 3,
the process of the hydrate dissociation is the process of the temperature decrease, which is
the result of the presence of the brine solution. Since the temperature drop was caused by
the heat balance between that needed for hydrate dissociation and that supplied from
surrounding environment, the lowest point of temperature represents the occasion when
hydrate dissociated most intensely. In addition, it was found that the time for the hydrate
dissociation is shortened and the degree of depth (well depth) of the temperature drop
increases with the increase of the concentration of the brine solution.
According to the calculation, about 16 minutes has been needed for brine to replace the pore
water around the temperature sensors of Port 4 in Run H13-Run H16 with the effects of the
different NaCl concentrations at -1
o
C. However, the lowest points of temperature have
occurred after lapse of time when the replacement had finished. This was caused by salinity
change of pore water due to ion diffusion.
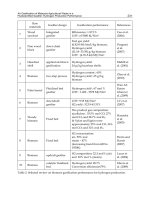
Figure 16 gives the curve of the temperature change with time at Ports 1-3 in the vessel in
the presence of brine solution with 24 wt% and at -1
o
C. As shown in Figure 16, there is a
well depth of the temperature change in each temperature curve at Ports 1-3, and the wells
appear with time in turn and the depths of the wells from Port 2 to Port 4 gradually increase.
In the process of the hydrate dissociation, it might be caused by the direct replacement of
pore water with brine at ports 1 and 2, resulting in the thermal homogenization, while the
temperature change at Port 4 was caused by salinity change of pore water due to ion
diffusion.
0 20 40 60 80 100 120 140 160
-5
-4
-3
-2
-1
0
1
2
3
16
Temperature of Port 3 /
o
C
Time / min
2%
8%
16%
24%
12min
Fig. 3. The curve of the temperature change over time at Port 4 in the vessel in Run H13-Run
H16 with the effects of the different brine concentrations at -1
o
C
Fuel Injection234
0 10 20 30 40 50 60
-4
-2
0
2
Temperature /
o
C
Time (min)
Port 1
Port 2
Port 3
12min
Fig. 4. The curve of the temperature change over time at Ports 1-3 in the vessel in Run H16
with the injection of 24 wt% brine solution at -1
o
C
3.2.3 Hot Brine stimulation
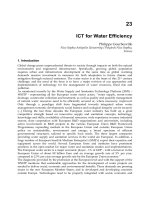
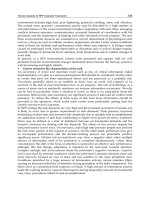
Figure 5 gives the typical curve of the temperature change with time at Ports 1-3 in the
vessel in the presence of hot brine solution with 24 wt% and at 90
o
C. It is shown from the
figure that at Port 4, the curve can be divided into three sections: the horizontal section, the
downward section and the upward section. The horizontal section represents the non-
dissociation and the isothermally endothermal dissociation (phase transformation)
processes of the hydrate still without the effect of the inhibitor. The downward section is the
cooling endothermal dissociation process of the hydrate on the effects of the hot water and
brine solution. In this section, with the increase of concentration of brine solution with time,
which acts on the surface of the hydrate, the temperature of the hydrate gradually decreases
and the hydrate gradually dissociates until the dissociation is completed while the
concentration of brine solution reaches the maximum value. The upward section is only the
heterothermally endothermal process of the system in the porous media in the effect of heat
after the hydrate dissociation has fully completed. In the section, there are no the phase
transformation. As shown in Figure 5 that the characteristics of the temperature changes
with Ports 1 and 2 are similar with Port 4. For other salt concentrations and other
temperatures of the injected hot solutions, the characteristics of the temperature change are
also similar with the above. In addition, as shown in the figure, the flowing of hot brine
water injected in the vessel can be also regarded as the moving of a piston from inlet to
outlet, as analyzed in Figure 2.
Temperature changes in Port 4 in Run H4, Run H8, Run H12 and Run H16 over time with
the injection of the brine of 24 wt% at -1, 50, 90, 130
o
C, respectively, have been shown in
Figure 6. The experimental results illustrate that with the brine injected at the same
concentrations the same lowest value of temperature decrease of the hydrate system at the
same port has been produced and it is independent of the initial temperatures of the injected
solutions. The temperature changes over time with the brine injected at the other same
concentrations at -1, 50, 90, 130
o
C show the similar characteristics.
Figure 7 gives a typical curve of the temperature change over time at Port 4 with Run H1-
Run H4 through injecting brine solution with the concentrations of 0, 8, 16, and 24 wt%,
respectively, at 130
o
C. As shown in Figure 7, it is noted that the time for the hydrate
dissociation shortened and the degree of the depth (well depth) of the temperature drop
increases with the increase of the concentration of brine solution. For other certain
temperatures with the different injections of brine solution of 0, 8, 16 and 24 wt%,
respectively, the similar characteristics can be obtained.
The dissociation processes of hydrate have been displayed through temperature curves at
various ports changing over time. However, for 2 wt% and 8 wt% salinity curves in Figure 3,
temperature shows an increase about 0.2- 0.3
o
C during about 2 or 3 minutes early. This is
due to heat transfer from the air bath after the air bath had been opened partially to turn on
input valve and output valve on the purpose of the injection of liquid as shown in Figure 1.
Heat transfer to or from the air bath affected all the temperature measurements during
about 2 or 3 minutes early. In spite of that, this increase or drop does not demolish the data
explain above because it was much lower than the well depth of the temperature change in
the temperature curves occurring later.
0 20 40 60 80 100 120 140
-5
0
5
10
15
20
25
30
35
40
45
50
Temperature /
o
C
Time (min)
Port 1
Port 2
Port 3
Fig. 5. The curve of the temperature change over time at Ports 1-3 in the vessel in Run H8
with the injection of 24 wt% brine solution at 90
o
C
Experimental investigations into the production behavior of methane
hydrate in porous sediment under ethylene glycol injection and hot brine stimulation 235
0 10 20 30 40 50 60
-4
-2
0
2
Temperature /
o
C
Time (min)
Port 1
Port 2
Port 3
12min
Fig. 4. The curve of the temperature change over time at Ports 1-3 in the vessel in Run H16
with the injection of 24 wt% brine solution at -1
o
C
3.2.3 Hot Brine stimulation
Figure 5 gives the typical curve of the temperature change with time at Ports 1-3 in the
vessel in the presence of hot brine solution with 24 wt% and at 90
o
C. It is shown from the
figure that at Port 4, the curve can be divided into three sections: the horizontal section, the
downward section and the upward section. The horizontal section represents the non-
dissociation and the isothermally endothermal dissociation (phase transformation)
processes of the hydrate still without the effect of the inhibitor. The downward section is the
cooling endothermal dissociation process of the hydrate on the effects of the hot water and
brine solution. In this section, with the increase of concentration of brine solution with time,
which acts on the surface of the hydrate, the temperature of the hydrate gradually decreases
and the hydrate gradually dissociates until the dissociation is completed while the
concentration of brine solution reaches the maximum value. The upward section is only the
heterothermally endothermal process of the system in the porous media in the effect of heat
after the hydrate dissociation has fully completed. In the section, there are no the phase
transformation. As shown in Figure 5 that the characteristics of the temperature changes
with Ports 1 and 2 are similar with Port 4. For other salt concentrations and other
temperatures of the injected hot solutions, the characteristics of the temperature change are
also similar with the above. In addition, as shown in the figure, the flowing of hot brine
water injected in the vessel can be also regarded as the moving of a piston from inlet to
outlet, as analyzed in Figure 2.
Temperature changes in Port 4 in Run H4, Run H8, Run H12 and Run H16 over time with
the injection of the brine of 24 wt% at -1, 50, 90, 130
o
C, respectively, have been shown in
Figure 6. The experimental results illustrate that with the brine injected at the same
concentrations the same lowest value of temperature decrease of the hydrate system at the
same port has been produced and it is independent of the initial temperatures of the injected
solutions. The temperature changes over time with the brine injected at the other same
concentrations at -1, 50, 90, 130
o
C show the similar characteristics.
Figure 7 gives a typical curve of the temperature change over time at Port 4 with Run H1-
Run H4 through injecting brine solution with the concentrations of 0, 8, 16, and 24 wt%,
respectively, at 130
o
C. As shown in Figure 7, it is noted that the time for the hydrate
dissociation shortened and the degree of the depth (well depth) of the temperature drop
increases with the increase of the concentration of brine solution. For other certain
temperatures with the different injections of brine solution of 0, 8, 16 and 24 wt%,
respectively, the similar characteristics can be obtained.
The dissociation processes of hydrate have been displayed through temperature curves at
various ports changing over time. However, for 2 wt% and 8 wt% salinity curves in Figure 3,
temperature shows an increase about 0.2- 0.3
o
C during about 2 or 3 minutes early. This is
due to heat transfer from the air bath after the air bath had been opened partially to turn on
input valve and output valve on the purpose of the injection of liquid as shown in Figure 1.
Heat transfer to or from the air bath affected all the temperature measurements during
about 2 or 3 minutes early. In spite of that, this increase or drop does not demolish the data
explain above because it was much lower than the well depth of the temperature change in
the temperature curves occurring later.
0 20 40 60 80 100 120 140
-5
0
5
10
15
20
25
30
35
40
45
50
Temperature /
o
C
Time (min)
Port 1
Port 2
Port 3
Fig. 5. The curve of the temperature change over time at Ports 1-3 in the vessel in Run H8
with the injection of 24 wt% brine solution at 90
o
C
Fuel Injection236
0 20 40 60 80 100 120 140
-10
0
10
20
30
Temperature of Port 3 /
o
C
Time (min)
-1
o
C
50
o
C
90
o
C
130
o
C
Fig. 6. The curve of the temperature change over time at Port 4 in the vessel in Run H4, Run
H8, Run H12 and Run H16 with the injection of 24 wt% brine solution at the different
temperatures
0 10 20 30 40 50 60 70 80
-6
-4
-2
0
2
4
6
8
10
12
14
16
18
20
Temperature /
o
C
Time (min)
0%
8%
16%
24%
Fig. 7. The curve of the temperature change over time at Port 4 in the vessel in Run H1-Run
H4 with the effects of the different brine concentrations at 130
o
C.
3.3 Gas production
A typical curve of the accumulative gas production for the whole gas production process in
Run H9 is given in Figure 8. As shown in Figure 8, the gas production process with the hot
brine or hot water injection in the vessel can be divided into three sections. In Section I, the
free methane gas in the vessel is released, and instantaneously gas production rate increases
rapidly. The gas production rate could be expressed by the slope of the curve of the
accumulative gas production. After the free gas released, the gas production rate decreases
remarkably. This section is the hydrate dissociation and gas production process and
considered to be Section II. Afterwards in Section III, the hydrate dissociation process has
finished, and there is only the residual gas release from the vessel. (Sloan & Koh, 2008) As
shown in Figure 8, there are two inflexion points on the curve of the accumulative gas
production with time. The left point indicates the end of free gas release process (Section I)
and the beginning of the hydrate dissociation process (Section II). The right one means the
end of hydrate dissociation process and the beginning of production process of the residual
gas (Section III).
Figure 9 gives the accumulative gas production over time with the 2 wt% brine solution
injection at -1
o
C, which is a typical case of the gas production without the effects of thermal
and brine. It can be seen from the figure that there is only the free gas production without
the dissociated gas from the hydrate in this case.
Figure 10 shows the accumulative gas production in Section II with the hot water injection at
50, 90 and 130
o
C, respectively, as did in Run H9, Run H5 and Run H1. The hydrate
dissociation rate increases with the increase of the temperature of the injected hot water
during the hydrate dissociation process (Goel et al., 2001).
Figure 11 gives the accumulative gas production in Section II at 50
o
C with the injections of
the brine solution in the concentration range of 0~24 wt%. The hydrate instantaneous
dissociation rate could be increased by injecting brine solution other than water, and it is
related to the concentration of injected brine solution. When the brine concentration is less
than 16 wt%, the dissociation rate increases with the brine concentration. It is noted that the
hydrate instantaneous dissociation rate is approximately the same with the injection of brine
solution of 16 wt% and 24 wt% at 50
o
C. In other words, if the brine concentration continues
rising after reaching certain value, the concentration has little effect on the hydrate
instantaneous dissociation rate. Hence, in the process of hydrate dissociation with the
injection of hot brine, it is not necessary to use the brine solution with very high
concentrations. The accumulative gas production and the hydrate instantaneous
dissociation rate at other certain temperature such as -1, 90, and 130
o
C, with the injections of
the brine solution in the concentration range of 0~24 wt% show the similar behavior.
Experimental investigations into the production behavior of methane
hydrate in porous sediment under ethylene glycol injection and hot brine stimulation 237
0 20 40 60 80 100 120 140
-10
0
10
20
30
Temperature of Port 3 /
o
C
Time (min)
-1
o
C
50
o
C
90
o
C
130
o
C
Fig. 6. The curve of the temperature change over time at Port 4 in the vessel in Run H4, Run
H8, Run H12 and Run H16 with the injection of 24 wt% brine solution at the different
temperatures
0 10 20 30 40 50 60 70 80
-6
-4
-2
0
2
4
6
8
10
12
14
16
18
20
Temperature /
o
C
Time (min)
0%
8%
16%
24%
Fig. 7. The curve of the temperature change over time at Port 4 in the vessel in Run H1-Run
H4 with the effects of the different brine concentrations at 130
o
C.
3.3 Gas production
A typical curve of the accumulative gas production for the whole gas production process in
Run H9 is given in Figure 8. As shown in Figure 8, the gas production process with the hot
brine or hot water injection in the vessel can be divided into three sections. In Section I, the
free methane gas in the vessel is released, and instantaneously gas production rate increases
rapidly. The gas production rate could be expressed by the slope of the curve of the
accumulative gas production. After the free gas released, the gas production rate decreases
remarkably. This section is the hydrate dissociation and gas production process and
considered to be Section II. Afterwards in Section III, the hydrate dissociation process has
finished, and there is only the residual gas release from the vessel. (Sloan & Koh, 2008) As
shown in Figure 8, there are two inflexion points on the curve of the accumulative gas
production with time. The left point indicates the end of free gas release process (Section I)
and the beginning of the hydrate dissociation process (Section II). The right one means the
end of hydrate dissociation process and the beginning of production process of the residual
gas (Section III).
Figure 9 gives the accumulative gas production over time with the 2 wt% brine solution
injection at -1
o
C, which is a typical case of the gas production without the effects of thermal
and brine. It can be seen from the figure that there is only the free gas production without
the dissociated gas from the hydrate in this case.
Figure 10 shows the accumulative gas production in Section II with the hot water injection at
50, 90 and 130
o
C, respectively, as did in Run H9, Run H5 and Run H1. The hydrate
dissociation rate increases with the increase of the temperature of the injected hot water
during the hydrate dissociation process (Goel et al., 2001).
Figure 11 gives the accumulative gas production in Section II at 50
o
C with the injections of
the brine solution in the concentration range of 0~24 wt%. The hydrate instantaneous
dissociation rate could be increased by injecting brine solution other than water, and it is
related to the concentration of injected brine solution. When the brine concentration is less
than 16 wt%, the dissociation rate increases with the brine concentration. It is noted that the
hydrate instantaneous dissociation rate is approximately the same with the injection of brine
solution of 16 wt% and 24 wt% at 50
o
C. In other words, if the brine concentration continues
rising after reaching certain value, the concentration has little effect on the hydrate
instantaneous dissociation rate. Hence, in the process of hydrate dissociation with the
injection of hot brine, it is not necessary to use the brine solution with very high
concentrations. The accumulative gas production and the hydrate instantaneous
dissociation rate at other certain temperature such as -1, 90, and 130
o
C, with the injections of
the brine solution in the concentration range of 0~24 wt% show the similar behavior.
Fuel Injection238
0 10 20 30 40 50 60 70 80 90
0
2000
4000
6000
8000
10000
12000
14000
16000
0
200
400
600
800
1000
1200
STD: Standard State
Section III
Section II
Section I
Cumulative water mass (g)
The gas cumulative production (STD ml)
Time (min)
gas produced volume
water injected
water produced
Fig. 8. The accumulative gas production and the accumulative mass of water injected and
produced over time in Run H9 with the injection of hot water at 50
o
C
0 5 10 15 20 25 30
0
500
1000
1500
2000
2500
3000
3500
4000
Cumulative liquid mass (g)
The gas cumulative production (STD ml)
Time (min)
gas produced volume
0
50
100
150
200
250
300
350
400
water injected
water produced
Fig. 9. The accumulative gas production and the accumulative mass of brine injected and
produced in Run H13 with the injection of 2 wt% brine solution at -1
o
C
0 10 20 30 40 50 60 70 80 90
0
1000
2000
3000
4000
5000
6000
7000
The gas cumulative production (STD ml)
Time (min)
50
o
C
90
o
C
130
o
C
Fig. 10. The accumulative gas production at section II in Run H1, Run H5 and Run H9 with
the effects of hot water at 50
o
C, 90
o
C and 130
o
C
0 10 20 30 40 50 60 70
0
1000
2000
3000
4000
5000
6000
7000
8000
The gas cumulative production (STD ml)
Time (min)
0 wt%
8 wt%
16 wt%
24 wt%
Fig. 11. The accumulative gas production at section II in Run H9-Run H12 with the effects of
the different brine concentrations at 50
o
C
Experimental investigations into the production behavior of methane
hydrate in porous sediment under ethylene glycol injection and hot brine stimulation 239
0 10 20 30 40 50 60 70 80 90
0
2000
4000
6000
8000
10000
12000
14000
16000
0
200
400
600
800
1000
1200
STD: Standard State
Section III
Section II
Section I
Cumulative water mass (g)
The gas cumulative production (STD ml)
Time (min)
gas produced volume
water injected
water produced
Fig. 8. The accumulative gas production and the accumulative mass of water injected and
produced over time in Run H9 with the injection of hot water at 50
o
C
0 5 10 15 20 25 30
0
500
1000
1500
2000
2500
3000
3500
4000
Cumulative liquid mass (g)
The gas cumulative production (STD ml)
Time (min)
gas produced volume
0
50
100
150
200
250
300
350
400
water injected
water produced
Fig. 9. The accumulative gas production and the accumulative mass of brine injected and
produced in Run H13 with the injection of 2 wt% brine solution at -1
o
C
0 10 20 30 40 50 60 70 80 90
0
1000
2000
3000
4000
5000
6000
7000
The gas cumulative production (STD ml)
Time (min)
50
o
C
90
o
C
130
o
C
Fig. 10. The accumulative gas production at section II in Run H1, Run H5 and Run H9 with
the effects of hot water at 50
o
C, 90
o
C and 130
o
C
0 10 20 30 40 50 60 70
0
1000
2000
3000
4000
5000
6000
7000
8000
The gas cumulative production (STD ml)
Time (min)
0 wt%
8 wt%
16 wt%
24 wt%
Fig. 11. The accumulative gas production at section II in Run H9-Run H12 with the effects of
the different brine concentrations at 50
o
C
Fuel Injection240
3.4 Liquid production
As shown in Figure 8, during free gas production, with hot water or hot brine injection there
is little liquid production. This stage is one process that free gas in the vessel is drived out,
and in this stage, the injected liquid solution stays in the vessel. During the hydrate
dissociation, the liquid production rate is slightly higher than the solution injection rate, due
to the water produced from the hydrate dissociation. After the hydrate dissociation process
finished, the liquid production rate is equal to the solution injection rate.
3.5 Production efficiency analysis
In this work, to determine the efficiency of gas production from the hydrate by hot brine
injection, the thermal efficiency and the energy ratio are investigated. The thermal efficiency
is defined as the ratio of the heat quantity for hydrate dissociation to the total heat input,
which is defined as the amount of heat needed to raise the temperature of the hydrate
system in the vessel up to the injection temperature. Thus, when the fluid is injected at 0
o
C
or less than 0
o
C, the thermal efficiency is zero, and there is no thermal effect on the hydrate
system in the vessel by the fluid injected. The energy ratio is defined as the ratio of the
combustion heat quantity of produced gas to the total input heat quantity (Li et al., 2006,
2008b).
Thermal efficiencies and energy ratios for the hydrate production in the above various
experimental runs under hot water and hot brine injections are shown in Figures 12 and 13,
respectively. As shown in Figures 12 and 13, the thermal efficiency and the energy ratio
decrease with the increase of the temperature of injected hot water at the 0 wt% salinity. For
the case of the injection of hot brine solution, the thermal efficiency and the energy ratio
increase with the increase of the concentration of injected hot brine with the certain
temperature. For hydrate dissociation, more powerful temperature-driving force comes
forth resulting from increasing salinity and thus hydrate dissociates more rapidly resulting
in smaller the total heat input. Then, increasing thermal efficiency and energy ratio have
been obtained.
However, with the differences of the temperatures of the injected hot brine, the degrees of
the increases of the thermal efficiency and the energy ratio are different. As shown in
Figures 12, 13, it is noted that at low temperature, 50
o
C, the increase effectiveness of the
thermal efficiency and the energy ratio is apparent with the increase of the concentration of
hot brine. Whereas, at high temperature thus as 130
o
C, there are only a little increase for
them. Hence, it is suggested that in the gas hydrate production by the hot brine injection, the
appropriate temperature in conjunction with the high concentration of brine solution brings
relative high recovery efficiency. The injection with too high temperature results in the
energy loss.
0 5 10 15 20 25
0.0
0.1
0.2
Thermal efficiency
Salinity wt%
50
o
C
90
o
C
130
o
C
Fig. 12. Thermal efficiencies of gas production with the salinity at 50
o
C, 90
o
C and 130
o
C
0 5 10 15 20 25
3
6
9
12
15
Energy ratio for whole process
brine salinity wt%
50
o
C
90
o
C
130
o
C
Fig. 13. Energy ratios of gas production with the salinity at 50
o
C, 90
o
C and 130
o
C
Experimental investigations into the production behavior of methane
hydrate in porous sediment under ethylene glycol injection and hot brine stimulation 241
3.4 Liquid production
As shown in Figure 8, during free gas production, with hot water or hot brine injection there
is little liquid production. This stage is one process that free gas in the vessel is drived out,
and in this stage, the injected liquid solution stays in the vessel. During the hydrate
dissociation, the liquid production rate is slightly higher than the solution injection rate, due
to the water produced from the hydrate dissociation. After the hydrate dissociation process
finished, the liquid production rate is equal to the solution injection rate.
3.5 Production efficiency analysis
In this work, to determine the efficiency of gas production from the hydrate by hot brine
injection, the thermal efficiency and the energy ratio are investigated. The thermal efficiency
is defined as the ratio of the heat quantity for hydrate dissociation to the total heat input,
which is defined as the amount of heat needed to raise the temperature of the hydrate
system in the vessel up to the injection temperature. Thus, when the fluid is injected at 0
o
C
or less than 0
o
C, the thermal efficiency is zero, and there is no thermal effect on the hydrate
system in the vessel by the fluid injected. The energy ratio is defined as the ratio of the
combustion heat quantity of produced gas to the total input heat quantity (Li et al., 2006,
2008b).
Thermal efficiencies and energy ratios for the hydrate production in the above various
experimental runs under hot water and hot brine injections are shown in Figures 12 and 13,
respectively. As shown in Figures 12 and 13, the thermal efficiency and the energy ratio
decrease with the increase of the temperature of injected hot water at the 0 wt% salinity. For
the case of the injection of hot brine solution, the thermal efficiency and the energy ratio
increase with the increase of the concentration of injected hot brine with the certain
temperature. For hydrate dissociation, more powerful temperature-driving force comes
forth resulting from increasing salinity and thus hydrate dissociates more rapidly resulting
in smaller the total heat input. Then, increasing thermal efficiency and energy ratio have
been obtained.
However, with the differences of the temperatures of the injected hot brine, the degrees of
the increases of the thermal efficiency and the energy ratio are different. As shown in
Figures 12, 13, it is noted that at low temperature, 50
o
C, the increase effectiveness of the
thermal efficiency and the energy ratio is apparent with the increase of the concentration of
hot brine. Whereas, at high temperature thus as 130
o
C, there are only a little increase for
them. Hence, it is suggested that in the gas hydrate production by the hot brine injection, the
appropriate temperature in conjunction with the high concentration of brine solution brings
relative high recovery efficiency. The injection with too high temperature results in the
energy loss.
0 5 10 15 20 25
0.0
0.1
0.2
Thermal efficiency
Salinity wt%
50
o
C
90
o
C
130
o
C
Fig. 12. Thermal efficiencies of gas production with the salinity at 50
o
C, 90
o
C and 130
o
C
0 5 10 15 20 25
3
6
9
12
15
Energy ratio for whole process
brine salinity wt%
50
o
C
90
o
C
130
o
C
Fig. 13. Energy ratios of gas production with the salinity at 50
o
C, 90
o
C and 130
o
C
Fuel Injection242
4. EG stimulation
4.1 Experimental Procedures
During the experiment, the raw dry quartz sand with the size range of 300-450 μm are
tightly packed in the vessel, and then the vessel was evacuated twice to remove air in it with
a vacuum pump. The quartz sand in the vessel was wetted to saturation with distilled water
using a metering pump. The sand sediment was saturated when the amount of water
produced from the vessel was equal to the amount of water injected. It was assumed that
the volume of water injected in the vessel was the total volume available in the vessel. Then
the methane gas was injected into the vessel until the pressure in the vessel reaches much
higher than the equilibrium hydrate formation pressure at the working temperature. After
that, the vessel was closed as an isochoric system. The temperature was gradually decreased
to form the hydrate by changing the air bath temperature. The hydrate formation was
considered to be completed until there was no pressure decrease in the system. The hydrate
formation process in general lasts for 2 to 5 days.
The hydrate dissociation by EG injection was carried out in the following procedures.
Firstly, the EG solution with the desired concentration was prepared in the middle
containers. The back pressure regulator was set to 3.8MPa, which is the system pressure
during the hydrate dissociation process under EG injection. Then the dissociation run was
started by injecting the EG solution from the middle containers into the vessel. The EG
solution was cooled down to the temperature in the air bath before injected into the vessel.
After injecting the EG solution for approximately 5 mins, hydrate began to dissociate and
gas and water solution were observed to release from the vessel through the outlet valve.
The gas production process lasted for 30-100 min, depending on the EG concentrations and
injection rates. When there was no significant gas released, the EG injection was finished
and the system pressure was released to 1 atm. gradually. During the entire dissociation
run, the temperature and pressure in the vessel, the gas production, the amount of EG
solution injected and the water production were recorded at 2 seconds intervals.
4.2 Hydrate Formation
Table 2 provides the hydrate formation conditions. The volume of the water and gas before
hydrate formation is equal to the total volume of water, gas and hydrate after hydrate
formation:
V
w1
+V
g1
= V
w2
+V
g2
+V
h2
(1)
It was assumed that there is 5.75 mol water in 1mol methane hydrate, and the density of
methane hydrate is 0.94 g/cm
3
and water in the vessel is incompressible. The volume of the
gas in the vessel after hydrate formation was calculated by the pressure and temperature
conditions in the vessel using the Peng-Robinson equation. The inlet and outlet pressures of
the vessel change simultaneously due to the high porosity and permeability of the sediment,
so the pressure in the vessel in this work takes the average of the inlet and outlet pressures.
Figure 14 shows a typical experimental result of the pressure and temperature profiles with time
during MH formation in the sediment. It can be seen from Figure 14 that the pressure profile
during MH formation could be divided into four sections. In section I (0 min-175 min), the
temperature decreased from 17.0
o
C to 2.0
o
C in isochoric condition, and the pressure decreases
from 5.4 MPa to 5.1 MPa due to the gas adsorption on porous the quartz sand and the gas
contraction in the vessel. After section I, the closed system was maintained at a constant
temperature (2.0
o
C) until the end of the experiment. In section II (175 min-280 min), the pressure
of the closed system was above 5.0 MPa, which was much higher than the pure hydrate
equilibrium pressure of 3.5 MPa at 2.0
o
C. (Sloan & Koh, 2008) This section was considered to be
the hydrate nucleation process, and in this period of time there was no hydrate formed in the
vessel. (Fan et al., 2006) The section III is the hydrate formation process. In this section, the
pressure gradually decreased due to the gas consumption during the hydrate formation, and this
section takes much longer time than section I and II. In the last section (section IV), no further
pressure decrease was observed, and the system was maintained at a constant temperature.
Hence, the system reached the thermodynamic stable state.
Total 7 experimental runs of hydrate dissociation by EG injection have been carried out. Run
E0 as the blank experiment, which injected the distilled water instead of EG solution, was
used to eliminate the influence of the gas production by the liquid injection. Table 3
provides the experimental conditions during hydrate dissociation by EG injection, including
the EG injection rate, the EG concentration and the average pressure and temperature
during MH dissociation. The hydrate dissociation runs in Table 3 were related to the
formation runs in Table 2.
experimental runs
E0 E1 E2 E3 E4 E5 E6 E7
Initial Pressure (MPa) 5.403
5.519
5.488
5.476
5.306
5.311
5.416 5.409
Initial temperature (
o
C) 17.83
17.89
18.01
17.71
17.83
17.46
17.77 17.95
Final Pressure (MPa) 3.556
3.502
3.467
3.480
3.557
3.566
3.516 3.486
Final temperature (
o
C) 1.97 1.92 1.81 1.92 2.00 2.07 1.81 1.73
Final amount of water (ml) 43.73
47.53
46.22
45.53
42.18
41.95
42.92 43.26
Conversion of gas to hydrate (%)
33.03
36.77
36.82
36.22
31.44
31.49
33.83 34.52
Hydrate content (vol, %) 7.33 8.16 8.17 8.04 6.98 6.99 7.51 7.66
Table 2. Formation conditions of hydrate related to hydrate dissociation by EG injection
experimental runs
E0 E1 E2 E3 E4 E5 E6 E7
EG injection rate (ml/min) 8.8 4.9 6.8 8.8 8.8 8.8 8.8 8.8
EG concentration (wt %) 0 30 30 30 40 50 60 70
Pressure (MPa) 3.889
3.862
3.926
3.862
3.864
3.85 3.901 3.825
Temperature (
o
C) 2.043
1.645
2.015
1.985
2.061
1.901
2.010 1.846
Table 3. Experimental conditions during Hydrate dissociation by EG injection
Experimental investigations into the production behavior of methane
hydrate in porous sediment under ethylene glycol injection and hot brine stimulation 243
4. EG stimulation
4.1 Experimental Procedures
During the experiment, the raw dry quartz sand with the size range of 300-450 μm are
tightly packed in the vessel, and then the vessel was evacuated twice to remove air in it with
a vacuum pump. The quartz sand in the vessel was wetted to saturation with distilled water
using a metering pump. The sand sediment was saturated when the amount of water
produced from the vessel was equal to the amount of water injected. It was assumed that
the volume of water injected in the vessel was the total volume available in the vessel. Then
the methane gas was injected into the vessel until the pressure in the vessel reaches much
higher than the equilibrium hydrate formation pressure at the working temperature. After
that, the vessel was closed as an isochoric system. The temperature was gradually decreased
to form the hydrate by changing the air bath temperature. The hydrate formation was
considered to be completed until there was no pressure decrease in the system. The hydrate
formation process in general lasts for 2 to 5 days.
The hydrate dissociation by EG injection was carried out in the following procedures.
Firstly, the EG solution with the desired concentration was prepared in the middle
containers. The back pressure regulator was set to 3.8MPa, which is the system pressure
during the hydrate dissociation process under EG injection. Then the dissociation run was
started by injecting the EG solution from the middle containers into the vessel. The EG
solution was cooled down to the temperature in the air bath before injected into the vessel.
After injecting the EG solution for approximately 5 mins, hydrate began to dissociate and
gas and water solution were observed to release from the vessel through the outlet valve.
The gas production process lasted for 30-100 min, depending on the EG concentrations and
injection rates. When there was no significant gas released, the EG injection was finished
and the system pressure was released to 1 atm. gradually. During the entire dissociation
run, the temperature and pressure in the vessel, the gas production, the amount of EG
solution injected and the water production were recorded at 2 seconds intervals.
4.2 Hydrate Formation
Table 2 provides the hydrate formation conditions. The volume of the water and gas before
hydrate formation is equal to the total volume of water, gas and hydrate after hydrate
formation:
V
w1
+V
g1
= V
w2
+V
g2
+V
h2
(1)
It was assumed that there is 5.75 mol water in 1mol methane hydrate, and the density of
methane hydrate is 0.94 g/cm
3
and water in the vessel is incompressible. The volume of the
gas in the vessel after hydrate formation was calculated by the pressure and temperature
conditions in the vessel using the Peng-Robinson equation. The inlet and outlet pressures of
the vessel change simultaneously due to the high porosity and permeability of the sediment,
so the pressure in the vessel in this work takes the average of the inlet and outlet pressures.
Figure 14 shows a typical experimental result of the pressure and temperature profiles with time
during MH formation in the sediment. It can be seen from Figure 14 that the pressure profile
during MH formation could be divided into four sections. In section I (0 min-175 min), the
temperature decreased from 17.0
o
C to 2.0
o
C in isochoric condition, and the pressure decreases
from 5.4 MPa to 5.1 MPa due to the gas adsorption on porous the quartz sand and the gas
contraction in the vessel. After section I, the closed system was maintained at a constant
temperature (2.0
o
C) until the end of the experiment. In section II (175 min-280 min), the pressure
of the closed system was above 5.0 MPa, which was much higher than the pure hydrate
equilibrium pressure of 3.5 MPa at 2.0
o
C. (Sloan & Koh, 2008) This section was considered to be
the hydrate nucleation process, and in this period of time there was no hydrate formed in the
vessel. (Fan et al., 2006) The section III is the hydrate formation process. In this section, the
pressure gradually decreased due to the gas consumption during the hydrate formation, and this
section takes much longer time than section I and II. In the last section (section IV), no further
pressure decrease was observed, and the system was maintained at a constant temperature.
Hence, the system reached the thermodynamic stable state.
Total 7 experimental runs of hydrate dissociation by EG injection have been carried out. Run
E0 as the blank experiment, which injected the distilled water instead of EG solution, was
used to eliminate the influence of the gas production by the liquid injection. Table 3
provides the experimental conditions during hydrate dissociation by EG injection, including
the EG injection rate, the EG concentration and the average pressure and temperature
during MH dissociation. The hydrate dissociation runs in Table 3 were related to the
formation runs in Table 2.
experimental runs
E0 E1 E2 E3 E4 E5 E6 E7
Initial Pressure (MPa) 5.403
5.519
5.488
5.476
5.306
5.311
5.416 5.409
Initial temperature (
o
C) 17.83
17.89
18.01
17.71
17.83
17.46
17.77 17.95
Final Pressure (MPa) 3.556
3.502
3.467
3.480
3.557
3.566
3.516 3.486
Final temperature (
o
C) 1.97 1.92 1.81 1.92 2.00 2.07 1.81 1.73
Final amount of water (ml) 43.73 47.53 46.22 45.53 42.18 41.95 42.92 43.26
Conversion of gas to hydrate (%)
33.03
36.77
36.82
36.22
31.44
31.49
33.83 34.52
Hydrate content (vol, %) 7.33 8.16 8.17 8.04 6.98 6.99 7.51 7.66
Table 2. Formation conditions of hydrate related to hydrate dissociation by EG injection
experimental runs
E0 E1 E2 E3 E4 E5 E6 E7
EG injection rate (ml/min) 8.8 4.9 6.8 8.8 8.8 8.8 8.8 8.8
EG concentration (wt %) 0 30 30 30 40 50 60 70
Pressure (MPa) 3.889 3.862 3.926 3.862 3.864 3.85 3.901 3.825
Temperature (
o
C) 2.043 1.645 2.015 1.985 2.061 1.901 2.010 1.846
Table 3. Experimental conditions during Hydrate dissociation by EG injection
Fuel Injection244
0 200 400 600 800 1000 1200 1400 1600 1800 2000 2200
2.5
3.0
3.5
4.0
4.5
5.0
5.5
6.0
0
2
4
6
8
10
12
14
16
18
20
Pressure
1320min
380min
Temperature(Deg C)
Pressure(MPa)
Time(min)
175min
Section I
Section II
Section III
Section IV
Temperature
Fig. 14. The pressure and temperature profiles during hydrate formation in isochoric
experiment
0 20 40 60 80 100 120 140 160 180 200
0.0
0.5
1.0
1.5
2.0
2.5
3.0
inlet (port 1)
outlet (port 4)
Temperature(Deg C)
Time(min)
Fig. 15. The inlet and outlet temperature during the EG injection for Run E3
4.2 Hydrate Dissociation
4.3.1 Temperature distribution
Before injected into the vessel, the EG solution was cooled by the coil in the air bath. In an
unstirred system, such as the vessel used in the experiment, it is difficult for the methane
gas and water to form methane hydrate completely. Hence, only a little hydrate was formed
and most part of water or gas was remained in the vessel. Besides, the existing of quartz
sand disperses the formed hydrate. Thus, the temperature neither sharply increases in the
process of methane hydrate formation shown in Figure 14 nor sharply decreases in the
process of methane hydrate dissociation. So the temperature in the vessel maintained
constant during EG solution injection.
The inlet (port 1) and outlet (port 4) temperature in the vessel during the EG injection for
Run E3 is shown in Figure 15, and the temperature profiles for all other runs show a similar
trend with Run3.
4.3.2 Gas and liquid production rate
The gas production rate for whole production process for Run E5, which is a typical one, is
shown in Figure 4. The gas production rates for other runs show the similar characteristics.
As shown in Figure 4, the process of the hydrate dissociation with the EG injection in one-
dimensional vessel can be divided into four main sections. In section I, the free methane gas
in the vessel was released. This caused the sudden increase of instantaneous gas release rate,
up to 800 ml/min. After the free gas released, the gas production rate decreased and
maintained about 30 ml/min. This section is considered to be section II. In section I and II,
the EG was diluted by the remained water in the vessel after hydrate formation, and there
were little hydrate dissociated due to the low concentration of EG solutions. With further
injection of the EG, the concentration of the EG solution in the vessel increased gradually.
The EG is a hydrophilic chemical that lowers the activity of water and destroys the structure
of the hydrate. When the EG concentration increased high enough to make the hydrate
dissociate, the gas production rate suddenly increased to about 100 ml/min, which
indicated that the hydrate in the vessel began to dissociate. This is the hydrate dissociation
section (section III). The dissociation section lasted approximately 25 min, which is the
longest time among the four sections, as shown in Figure 16. Section IV was the last section
of the experiment, with remain gas released.
Table 4 provides the Run Etime and gas produced from hydrate dissociation by EG injection
for all runs. The EG injection time is from the beginning of EG injection to the end of hydrate
dissociation. Onset time for hydrate dissociation is the starting point of section III, and the
duration of hydrate dissociation is the length of time of section III. For example, in Run E5 in
Figure 16, the onset time for the hydrate dissociation section is 8 min and the end of this
section is 32 min, resulting in the duration of hydrate dissociation of approximately 24 min.
The gas production ratio is defined as the ratio of the amount of gas generated from hydrate
in the hydrate dissociation section and the initial amount of gas contained in all hydrate
excluding the free gas in the vessel. Total gas produced after EG injection is also given in
Table 4.
The rate of hydrate dissociation by EG injection is a function of EG concentration, injection
rate of EG solution, pressure, temperature of the system and hydrate-EG interfacial area.
(Sira et al., 1990) In this work, the pressure, temperature and the EG injection rate maintain
Experimental investigations into the production behavior of methane
hydrate in porous sediment under ethylene glycol injection and hot brine stimulation 245
0 200 400 600 800 1000 1200 1400 1600 1800 2000 2200
2.5
3.0
3.5
4.0
4.5
5.0
5.5
6.0
0
2
4
6
8
10
12
14
16
18
20
Pressure
1320min
380min
Temperature(Deg C)
Pressure(MPa)
Time(min)
175min
Section I
Section II
Section III
Section IV
Temperature
Fig. 14. The pressure and temperature profiles during hydrate formation in isochoric
experiment
0 20 40 60 80 100 120 140 160 180 200
0.0
0.5
1.0
1.5
2.0
2.5
3.0
inlet (port 1)
outlet (port 4)
Temperature(Deg C)
Time(min)
Fig. 15. The inlet and outlet temperature during the EG injection for Run E3
4.2 Hydrate Dissociation
4.3.1 Temperature distribution
Before injected into the vessel, the EG solution was cooled by the coil in the air bath. In an
unstirred system, such as the vessel used in the experiment, it is difficult for the methane
gas and water to form methane hydrate completely. Hence, only a little hydrate was formed
and most part of water or gas was remained in the vessel. Besides, the existing of quartz
sand disperses the formed hydrate. Thus, the temperature neither sharply increases in the
process of methane hydrate formation shown in Figure 14 nor sharply decreases in the
process of methane hydrate dissociation. So the temperature in the vessel maintained
constant during EG solution injection.
The inlet (port 1) and outlet (port 4) temperature in the vessel during the EG injection for
Run E3 is shown in Figure 15, and the temperature profiles for all other runs show a similar
trend with Run3.
4.3.2 Gas and liquid production rate
The gas production rate for whole production process for Run E5, which is a typical one, is
shown in Figure 4. The gas production rates for other runs show the similar characteristics.
As shown in Figure 4, the process of the hydrate dissociation with the EG injection in one-
dimensional vessel can be divided into four main sections. In section I, the free methane gas
in the vessel was released. This caused the sudden increase of instantaneous gas release rate,
up to 800 ml/min. After the free gas released, the gas production rate decreased and
maintained about 30 ml/min. This section is considered to be section II. In section I and II,
the EG was diluted by the remained water in the vessel after hydrate formation, and there
were little hydrate dissociated due to the low concentration of EG solutions. With further
injection of the EG, the concentration of the EG solution in the vessel increased gradually.
The EG is a hydrophilic chemical that lowers the activity of water and destroys the structure
of the hydrate. When the EG concentration increased high enough to make the hydrate
dissociate, the gas production rate suddenly increased to about 100 ml/min, which
indicated that the hydrate in the vessel began to dissociate. This is the hydrate dissociation
section (section III). The dissociation section lasted approximately 25 min, which is the
longest time among the four sections, as shown in Figure 16. Section IV was the last section
of the experiment, with remain gas released.
Table 4 provides the Run Etime and gas produced from hydrate dissociation by EG injection
for all runs. The EG injection time is from the beginning of EG injection to the end of hydrate
dissociation. Onset time for hydrate dissociation is the starting point of section III, and the
duration of hydrate dissociation is the length of time of section III. For example, in Run E5 in
Figure 16, the onset time for the hydrate dissociation section is 8 min and the end of this
section is 32 min, resulting in the duration of hydrate dissociation of approximately 24 min.
The gas production ratio is defined as the ratio of the amount of gas generated from hydrate
in the hydrate dissociation section and the initial amount of gas contained in all hydrate
excluding the free gas in the vessel. Total gas produced after EG injection is also given in
Table 4.
The rate of hydrate dissociation by EG injection is a function of EG concentration, injection
rate of EG solution, pressure, temperature of the system and hydrate-EG interfacial area.
(Sira et al., 1990) In this work, the pressure, temperature and the EG injection rate maintain
Fuel Injection246
constant after the EG injection. The instantaneous gas production rates during the whole
process were unsteady as shown in Figure 16, while the hydrate dissociation rate decreased
continuously with time as illustrated by a typical run (Run E5) in Figure 17. The hydrate
dissociation rate was calculated by the gas production rate of section III in Figure 16, in
which the gas production was caused by the hydrate dissociation at the certain pressure and
temperature.
Figure 18 shows the effect of the EG injection rate on the cumulative gas produced from
hydrate dissociation as a function of time for Runs 1-3. The cumulative gas produced from
the vessel was measured by the gas flow meter in Figure 1. In Runs 1-3, the EG
concentration was kept the same at 30 wt% and the injection rate was varied from 4.9 to 8.8
ml/min. As shown in Figure 18, in general, with the increase of the EG injection rate, the
cumulative gas produced increased. As the EG injection rate increase, there were more EG
injected into the vessel at the same time, which increased the hydrate-EG interfacial area and
stimulated more hydrate dissociate at the same time. The general trend for gas production
rate profile is similar in Runs 1-3, but the onset time and duration of hydrate dissociation
section are all different with different EG injection rate. As shown in Table 4, from Run E1 to
Run E3, the duration of hydrate dissociation section decrease from 73 min to 35 min, while
the gas production ratio increased from 38.9% to 50.6%.
Figure 19 shows the effect of the EG concentration on the cumulative gas produced from
hydrate dissociation as a function of time for fixed injection rate (Runs 3-7). From Runs 3 to
7, the EG injection rate was maintained same at 8.8 ml/min and the EG concentration was
varied from 30 to 70 wt%. Run E0 was the blank experiment, which injected the distilled
water instead of EG solution, with the same injection rate as Runs 3-7. Although the general
trend for gas production rate profile is similar in Runs 3-7 with the same EG injection rate,
the duration of hydrate dissociation decrease as the EG concentration increased from 30
wt% to 70 wt%. As shown in Table 4, from Run E3 to Run E7, the gas production ratio
increased from 50.6% to 96.2%. The gas production ratio is larger than 90% while the EG
concentration is over 60 wt% during hydrate dissociation. On the other hand, the EG
injection time for all runs are different, which decreases with the increase of injection rate
and concentration of the injected EG solution in general.
The EG injection and the solution production rate profiles are much simpler than that of the
gas production, and Figure 20 gives a typical profile (Run E5). The solution produced from
the outlet of the vessel was composed of the EG solution, water in the vessel before EG
injection, and water produced from the hydrate dissociation. From Figure 20, the EG
injection rate kept nearly constant for the whole production process. While there was
fluctuation for the solution production rate, due to the unsteady state during hydrate
dissociation process under the chemical stimulation.
experimental runs
E0 E1 E2 E3 E4 E5 E6 E7
EG injection time (min) - 107 71 43 33 32 29 24
Onset time for hydrate
dissociation (min)
- 34 21 8 6 8 7 4
Duration of hydrate dissociation
(min)
- 73 50 35 27 24 22 20
Gas produced from hydrate (ml)
- 977 1088
1252
1547
1800
2194 2268
Gas production ratio (%) - 38.9 43.3 50.6 72.1 83.7 95.0 96.2
Gas produced after EG injection
(ml)
- 3496
3334
4025
3210
3933
4180 3368
Table 4. Run time and gas produced from hydrate dissociation by EG injection
0 10 20 30 40 50
0
100
200
300
400
500
600
700
800
900
1000
1100
1200
Section IV
Section I
Section II
Gas production rate(ml/min)
Time(min)
(Hydrate Dissociation)
Section III
Fig. 16. The gas production rate for Run E5
Experimental investigations into the production behavior of methane
hydrate in porous sediment under ethylene glycol injection and hot brine stimulation 247
constant after the EG injection. The instantaneous gas production rates during the whole
process were unsteady as shown in Figure 16, while the hydrate dissociation rate decreased
continuously with time as illustrated by a typical run (Run E5) in Figure 17. The hydrate
dissociation rate was calculated by the gas production rate of section III in Figure 16, in
which the gas production was caused by the hydrate dissociation at the certain pressure and
temperature.
Figure 18 shows the effect of the EG injection rate on the cumulative gas produced from
hydrate dissociation as a function of time for Runs 1-3. The cumulative gas produced from
the vessel was measured by the gas flow meter in Figure 1. In Runs 1-3, the EG
concentration was kept the same at 30 wt% and the injection rate was varied from 4.9 to 8.8
ml/min. As shown in Figure 18, in general, with the increase of the EG injection rate, the
cumulative gas produced increased. As the EG injection rate increase, there were more EG
injected into the vessel at the same time, which increased the hydrate-EG interfacial area and
stimulated more hydrate dissociate at the same time. The general trend for gas production
rate profile is similar in Runs 1-3, but the onset time and duration of hydrate dissociation
section are all different with different EG injection rate. As shown in Table 4, from Run E1 to
Run E3, the duration of hydrate dissociation section decrease from 73 min to 35 min, while
the gas production ratio increased from 38.9% to 50.6%.
Figure 19 shows the effect of the EG concentration on the cumulative gas produced from
hydrate dissociation as a function of time for fixed injection rate (Runs 3-7). From Runs 3 to
7, the EG injection rate was maintained same at 8.8 ml/min and the EG concentration was
varied from 30 to 70 wt%. Run E0 was the blank experiment, which injected the distilled
water instead of EG solution, with the same injection rate as Runs 3-7. Although the general
trend for gas production rate profile is similar in Runs 3-7 with the same EG injection rate,
the duration of hydrate dissociation decrease as the EG concentration increased from 30
wt% to 70 wt%. As shown in Table 4, from Run E3 to Run E7, the gas production ratio
increased from 50.6% to 96.2%. The gas production ratio is larger than 90% while the EG
concentration is over 60 wt% during hydrate dissociation. On the other hand, the EG
injection time for all runs are different, which decreases with the increase of injection rate
and concentration of the injected EG solution in general.
The EG injection and the solution production rate profiles are much simpler than that of the
gas production, and Figure 20 gives a typical profile (Run E5). The solution produced from
the outlet of the vessel was composed of the EG solution, water in the vessel before EG
injection, and water produced from the hydrate dissociation. From Figure 20, the EG
injection rate kept nearly constant for the whole production process. While there was
fluctuation for the solution production rate, due to the unsteady state during hydrate
dissociation process under the chemical stimulation.
experimental runs
E0 E1 E2 E3 E4 E5 E6 E7
EG injection time (min) - 107 71 43 33 32 29 24
Onset time for hydrate
dissociation (min)
- 34 21 8 6 8 7 4
Duration of hydrate dissociation
(min)
- 73 50 35 27 24 22 20
Gas produced from hydrate (ml)
- 977 1088
1252
1547
1800
2194 2268
Gas production ratio (%) - 38.9 43.3 50.6 72.1 83.7 95.0 96.2
Gas produced after EG injection
(ml)
- 3496
3334
4025
3210
3933
4180 3368
Table 4. Run time and gas produced from hydrate dissociation by EG injection
0 10 20 30 40 50
0
100
200
300
400
500
600
700
800
900
1000
1100
1200
Section IV
Section I
Section II
Gas production rate(ml/min)
Time(min)
(Hydrate Dissociation)
Section III
Fig. 16. The gas production rate for Run E5
Fuel Injection248
0 10 20 30 40 50
0.0
0.2
0.4
0.6
0.8
1.0
1.2
hydrate dissociation rate (mol/min)
Time(min)
Section III
(Hydrate Dissociation)
Section IV
Fig. 17. The hydrate dissociation rate for Run E5
0 10 20 30 40 50 60 70 80
0
200
400
600
800
1000
1200
1400
1600
1800
2000
Run #3
Cumulative gas produced (ml)
Time(min)
Run #2
Run #1
Fig. 18. The cumulative gas produced during the hydrate dissociation for Runs 1-3
0 2 4 6 8 10 12 14 16 18 20 22 24 26 28 30 32 34 36 38 40
0
500
1000
1500
2000
2500
Cumulative gas produced (ml)
Time(min)
Run #3
Run #4
Run #6
Run #5
Run #7
Run #0
Fig. 19. The cumulative gas produced during the hydrate dissociation for Runs 3-7
0 10 20 30 40 50
0
2
4
6
8
10
12
14
16
18
20
22
24
EG injection rate
Solution production rate
Solution injection and production rate(g/min)
Time(min)
Hydrate Dissociation
Fig. 20. Solution injection and production rate profile for Run E5
4.3.3 Production Efficiency Analysis
The efficiency of producing gas from hydrate by EG injection is investigated here. In order
to compare the efficiency of different runs, the production efficiency has been defined as the
ratio of the volume of produced gas to the mass of EG injected in unit time.
Experimental investigations into the production behavior of methane
hydrate in porous sediment under ethylene glycol injection and hot brine stimulation 249
0 10 20 30 40 50
0.0
0.2
0.4
0.6
0.8
1.0
1.2
hydrate dissociation rate (mol/min)
Time(min)
Section III
(Hydrate Dissociation)
Section IV
Fig. 17. The hydrate dissociation rate for Run E5
0 10 20 30 40 50 60 70 80
0
200
400
600
800
1000
1200
1400
1600
1800
2000
Run #3
Cumulative gas produced (ml)
Time(min)
Run #2
Run #1
Fig. 18. The cumulative gas produced during the hydrate dissociation for Runs 1-3
0 2 4 6 8 10 12 14 16 18 20 22 24 26 28 30 32 34 36 38 40
0
500
1000
1500
2000
2500
Cumulative gas produced (ml)
Time(min)
Run #3
Run #4
Run #6
Run #5
Run #7
Run #0
Fig. 19. The cumulative gas produced during the hydrate dissociation for Runs 3-7
0 10 20 30 40 50
0
2
4
6
8
10
12
14
16
18
20
22
24
EG injection rate
Solution production rate
Solution injection and production rate(g/min)
Time(min)
Hydrate Dissociation
Fig. 20. Solution injection and production rate profile for Run E5
4.3.3 Production Efficiency Analysis
The efficiency of producing gas from hydrate by EG injection is investigated here. In order
to compare the efficiency of different runs, the production efficiency has been defined as the
ratio of the volume of produced gas to the mass of EG injected in unit time.
Fuel Injection250
Under the EG stimulation, the hydrate dissociated only on the hydrate dissociation section
(Section III shown in Figure 16). Table 5 shows three production efficiencies:
1) Production efficiency for hydrate dissociation section (section III) (ml/g/min)
2) Production efficiency at 50% hydrate dissociation (section III) (ml/g/min)
3) Production efficiency for whole injection process (section I to III) (ml/g/min)
The first one was calculated with the volume of gas, the mass of EG injected and the
duration time of the hydrate dissociation section (section III in Figure 16). It can be used to
measure the gas production efficiency of hydrate dissociation process by the effect of EG in
section III.
The second one was calculated the same way with the first one, while it used the values of
50% hydrate dissociation point. In this work, the hydrate dissociation runs were divided
into 4 sections, and the hydrate dissociation only happened in section III. The amount of
dissociated hydrate was measured by the gas volume released from the vessel in section III.
So 100% hydrate dissociation point was the end of section III, when the gas produced from
hydrate dissociation all released from the vessel. In the same way, 50% hydrate dissociation
point was some time in section III, when 50% gas produced from hydrate dissociation.
Both the first and second production efficiencies were calculated based on the experimental
result of section III (the hydrate dissociation section).
The third one was used to measure the whole experimental runs, from the beginning of EG
injection to the end of the hydrate dissociation process, which include section I to section III.
The formation conditions of hydrate used in the work was same for all runs, including
pressure, temperature, amount of water and the hydrate content in the vessel. For all EG
injection runs, the impact of the hydrate content, the amount of water and free gas in the
vessel, and the difference of the operating conditions (including the pressure and
temperature) during EG injection were all eliminated, while the impact of the EG
concentration and injection rate on the production efficiency reflected in Table 5. As shown
in Table 5, the production efficiency for the whole EG injection process was between 0.20
and 0.88 ml/g/min, while the efficiency for hydrate dissociation section was between 0.12
and 0.80 ml/g/min. But the production efficiency at 50% hydrate dissociation was much
higher, with the maximum of 2.03 ml/g/min.
From the efficiency analysis, the following conclusions can be drawn: (1) the production
efficiency of the hydrate dissociation section, 50% hydrate dissociation and the whole
injection process varied with the EG concentration and injection rate, and the variation
presented the same trend. (2) The hydrate dissociation rate decreased as the experiments go
on, as shown in Figure 17. This can explain why the efficiencies at 50% hydrate dissociation
were all higher than that of the whole injection process. (3) With the increase of the EG
injection rate, the production efficiency increases, as Runs 1-3. The production efficiencies
for hydrate dissociation section of Runs 1, 2 and 3 increase from 0.12 to 0.50 when the
injection rate increase from 4.9 to 8.8 ml/min. (4) The EG concentration also influence the
production efficiency, as Runs 3-7. From the result shown in Table 5, there was a maximum
point for the EG concentration on the production efficiency with the same injection rate (9
ml/min), as Run E6 with 60 wt% EG solution. With the increase of the EG concentration, the
gas production rate increases, as the result shown in Figure 19. While the mass of EG
injected into the vessel increase with the increase of the concentration, the production
efficiency reaches the maximum of 0.80 in Run E6. The same result was also concluded on
the production efficiency at 50% hydrate dissociation and the whole production process
including the free gas release section.
experimental runs
E0 E1 E2 E3 E4 E5 E6 E7
Production efficiency for
hydrate dissociation section
(section III) (ml/g/min)
- 0.12 0.28 0.50 0.57 0.60 0.80 0.76
Production efficiency at 50%
hydrate dissociation (section III)
(ml/g/min)
- 0.44 1.32 1.60 1.61 1.75 2.03 1.53
Production efficiency for whole
injection process (section I to III)
(ml/g/min)
- 0.20 0.31 0.79 0.79 0.81 0.88 0.86
Table 5. Production efficiency analysis for the hydrate dissociation by EG injection
5. Conclusions
1 The flowing of hot water or hot brine injected in the vessel can be regarded as the
moving of a piston from the inlet to the outlet.
2 The hydrate dissociation process is divided into three stages: free gas production,
hydrate dissociation and residual gas production.
3 The process of the hydrate dissociation is a process of the temperature decrease in the
presence of the brine solution. The duration of the hydrate dissociation is shortened and
the degree of the depth of the temperature drop increases with the increase of the brine
concentration.
4 The rate of instantaneous hydrate dissociation increases with the increase of brine
concentration with the injection of hot brine solution. However, when the brine
concentration is higher than the certain degree, the rate of instantaneous hydrate
dissociation no longer continues to increases.
5 During the hydrate dissociation, the rate of the liquid production is slightly higher than
the rate of the solution injection, due to the water produced from the hydrate
dissociation.
6 Thermal efficiency and energy ratio for the hydrate production can be enhanced by
injecting hot brine solution, and the enhance effectiveness is apparent with the injection
of high brine concentration at the relative low temperature.
7 After the EG injection, the hydrate dissociation in the vessel can be divided into four
sections, that is the free gas producing section, EG diluting section, the hydrate
dissociating section and the remnant gas producing section.
8 The gas and water production rate were both unsteady during hydrate dissociation rate
decrease continuously with time under the EG stimulation, while the EG injection rate
kept nearly constant for the whole production process.
Experimental investigations into the production behavior of methane
hydrate in porous sediment under ethylene glycol injection and hot brine stimulation 251
Under the EG stimulation, the hydrate dissociated only on the hydrate dissociation section
(Section III shown in Figure 16). Table 5 shows three production efficiencies:
1) Production efficiency for hydrate dissociation section (section III) (ml/g/min)
2) Production efficiency at 50% hydrate dissociation (section III) (ml/g/min)
3) Production efficiency for whole injection process (section I to III) (ml/g/min)
The first one was calculated with the volume of gas, the mass of EG injected and the
duration time of the hydrate dissociation section (section III in Figure 16). It can be used to
measure the gas production efficiency of hydrate dissociation process by the effect of EG in
section III.
The second one was calculated the same way with the first one, while it used the values of
50% hydrate dissociation point. In this work, the hydrate dissociation runs were divided
into 4 sections, and the hydrate dissociation only happened in section III. The amount of
dissociated hydrate was measured by the gas volume released from the vessel in section III.
So 100% hydrate dissociation point was the end of section III, when the gas produced from
hydrate dissociation all released from the vessel. In the same way, 50% hydrate dissociation
point was some time in section III, when 50% gas produced from hydrate dissociation.
Both the first and second production efficiencies were calculated based on the experimental
result of section III (the hydrate dissociation section).
The third one was used to measure the whole experimental runs, from the beginning of EG
injection to the end of the hydrate dissociation process, which include section I to section III.
The formation conditions of hydrate used in the work was same for all runs, including
pressure, temperature, amount of water and the hydrate content in the vessel. For all EG
injection runs, the impact of the hydrate content, the amount of water and free gas in the
vessel, and the difference of the operating conditions (including the pressure and
temperature) during EG injection were all eliminated, while the impact of the EG
concentration and injection rate on the production efficiency reflected in Table 5. As shown
in Table 5, the production efficiency for the whole EG injection process was between 0.20
and 0.88 ml/g/min, while the efficiency for hydrate dissociation section was between 0.12
and 0.80 ml/g/min. But the production efficiency at 50% hydrate dissociation was much
higher, with the maximum of 2.03 ml/g/min.
From the efficiency analysis, the following conclusions can be drawn: (1) the production
efficiency of the hydrate dissociation section, 50% hydrate dissociation and the whole
injection process varied with the EG concentration and injection rate, and the variation
presented the same trend. (2) The hydrate dissociation rate decreased as the experiments go
on, as shown in Figure 17. This can explain why the efficiencies at 50% hydrate dissociation
were all higher than that of the whole injection process. (3) With the increase of the EG
injection rate, the production efficiency increases, as Runs 1-3. The production efficiencies
for hydrate dissociation section of Runs 1, 2 and 3 increase from 0.12 to 0.50 when the
injection rate increase from 4.9 to 8.8 ml/min. (4) The EG concentration also influence the
production efficiency, as Runs 3-7. From the result shown in Table 5, there was a maximum
point for the EG concentration on the production efficiency with the same injection rate (9
ml/min), as Run E6 with 60 wt% EG solution. With the increase of the EG concentration, the
gas production rate increases, as the result shown in Figure 19. While the mass of EG
injected into the vessel increase with the increase of the concentration, the production
efficiency reaches the maximum of 0.80 in Run E6. The same result was also concluded on
the production efficiency at 50% hydrate dissociation and the whole production process
including the free gas release section.
experimental runs
E0 E1 E2 E3 E4 E5 E6 E7
Production efficiency for
hydrate dissociation section
(section III) (ml/g/min)
- 0.12 0.28 0.50 0.57 0.60 0.80 0.76
Production efficiency at 50%
hydrate dissociation (section III)
(ml/g/min)
- 0.44 1.32 1.60 1.61 1.75 2.03 1.53
Production efficiency for whole
injection process (section I to III)
(ml/g/min)
- 0.20 0.31 0.79 0.79 0.81 0.88 0.86
Table 5. Production efficiency analysis for the hydrate dissociation by EG injection
5. Conclusions
1 The flowing of hot water or hot brine injected in the vessel can be regarded as the
moving of a piston from the inlet to the outlet.
2 The hydrate dissociation process is divided into three stages: free gas production,
hydrate dissociation and residual gas production.
3 The process of the hydrate dissociation is a process of the temperature decrease in the
presence of the brine solution. The duration of the hydrate dissociation is shortened and
the degree of the depth of the temperature drop increases with the increase of the brine
concentration.
4 The rate of instantaneous hydrate dissociation increases with the increase of brine
concentration with the injection of hot brine solution. However, when the brine
concentration is higher than the certain degree, the rate of instantaneous hydrate
dissociation no longer continues to increases.
5 During the hydrate dissociation, the rate of the liquid production is slightly higher than
the rate of the solution injection, due to the water produced from the hydrate
dissociation.
6 Thermal efficiency and energy ratio for the hydrate production can be enhanced by
injecting hot brine solution, and the enhance effectiveness is apparent with the injection
of high brine concentration at the relative low temperature.
7 After the EG injection, the hydrate dissociation in the vessel can be divided into four
sections, that is the free gas producing section, EG diluting section, the hydrate
dissociating section and the remnant gas producing section.
8 The gas and water production rate were both unsteady during hydrate dissociation rate
decrease continuously with time under the EG stimulation, while the EG injection rate
kept nearly constant for the whole production process.
Fuel Injection252
9 Under the experiment conditions, with the EG injection rate increasing, the gas
production ratio increased, the duration of hydrate dissociation shortened and the
production efficiency increased.
10 Under the experiment conditions, with the EG concentration increasing, the gas
production ratio increased, the duration of hydrate dissociation process shortened. And
the EG concentration also affects the production efficiency. The production efficiency
for the whole EG injection process increased with the EG concentration increasing from
0 to 60wt%, and after that the production efficiency began to decrease.
6. Acknowledgments
The authors appreciate the financial support from the National High Technology Research
and Development Program of China (No.2006AA09A209, No.2006AA05Z319) and the
National Natural Science Foundation of China (No.20676133).
7. References
Collett, T. S. (2004). Gas hydrates as a future energy resource, Geotimes, 49, 11, (2004) pp 24-
27, ISSN 0016-8556
Fan, S. S.; Zhang, Y. Z.; Tian, G. L.; Liang, D. Q.; Li, D. L. (2006). Natural gas hydrate
dissociation by presence of ethylene glycol. Energy & Fuels, 20, 1, (2006) pp 324-326,
ISSN 0887-0624
Goel, N.; Wiggins, M.; Shah, S., Analytical modeling of gas recovery from in situ hydrates
dissociation. Journal of Petroleum Science and Engineering 2001, 29, (2), 115-127, ISSN
0920-4105
Kamath, V. A. M., P.N.; Sira, J.H.; Patil, S.L. (1991). Experimental study of Brine injection
and depressurization methods for dissociation of gas hydrate. SPE Formation
Evaluation, 6, 4, (1991) pp 477-484, ISSN 0885-923X
Kawamura, T.; Yamamoto, Y.; Ohtake, M.; Sakamoto, Y.; Komai, T.; Haneda, H. (2005a).
Dissociation experiment of hydrate core sample using thermodynamic inhibitors,
15th International Offshore and Polar Engineering Conference (ISOPE 2005), pp. 346-
350, Seoul, SOUTH KOREA, Jun 19-24, 2005, ISBN 1-880653-64-8
Kawamura, T.; Yamamoto, Y.; Ohtake, M.; Sakamoto, Y.; Komai, T.; Haneda, H. (2005b). In
Experimental study on dissociation of hydrate core sample accelerated by
thermodynamic inhibitors for gas recovery from natural gas hydrate, The 5th
International Conference on Gas Hydrate, pp 3023-3028, Trondheim, Norway, 12-16
June, 2005, ISBN 9781615670666
Kawamura, T.; Sakamoto, Y.; Ohtake, M.; Yamamoto, Y.; Haneda, H.; Yoon, J. H.; Komai, T.
(2006). Dissociation behavior of hydrate core sample using thermodynamic
inhibitor, International Journal of Offshore and Polar Engineering, 16, 1, (2006) pp 5-9,
ISSN 1053-5381
Kawamura, T.; Ohtake, M.; Sakamoto, Y.; Yamamoto, Y.; Haneda, H.; Komai, T.; Higuchi, S.
(2007). Experimental study on steam injection method using methane hydrate core
samples, Proceedings of The Seventh (2007) ISOPE Ocean Mining Symposium, pp 83-86,
Lisbon, PORTUGAL, Jul 01-06, 2007, ISBN 1-880653-57-X
Klauda, J. B.; Sandler, S. I. (2005). Global Distribution of Methane Hydrate in Ocean
Sediment, Energy & Fuels, 19, 2, (2005) pp 459–470, ISSN 0887-0624
Kono, H. O.; Narasimhan, S.; Song, F.; Smith, D. H. (2002). Synthesis of methane gas hydrate
in porous sediments and its dissociation by depressurizing, Powder Technology, 122,
2-3, (2002) pp 239-246, ISSN 0032-5910
Li, G.; Tang, L.; Huang, C.; Feng, Z.; Fan, S. (2006). Thermodynamic evaluation of hot brine
stimulation for natural gas hydrate dissociation, Huagong Xuebao/Journal of Chemical
Industry and Engineering (China), 57, 9, (2006) pp 2033-2038, ISSN 0438-1157
Li, G.; Li, X.; Tang, L.; Zhang, Y. (2007a). Experimental investigation of production behavior
of methane hydrate under ethylene glycol stimulation in unconsolidated sediment,
Energy & Fuels, 21, 6, (2007) pp 3388-3393, ISSN 0887-0624
Li, G.; Li, X.; Tang, L.; Zhang, Y.; Feng, Z.; Fan, S. (2007b). Experimental Investigation of
Production Behavior of Methane Hydrate under Ethylene Glycol Injection, Huagong
Xuebao/Journal of Chemical Industry and Engineering (China), 58, 8, (2007b) pp 2067-
2074, ISSN 0438-1157
Li, X. S.; Wan, L. H.; Li, G.; Li, Q. P.; Chen, Z. Y.; Yan, K. F. (2008a). Experimental
Investigation into the Production Behavior of Methane Hydrate in Porous Sediment
with Hot Brine Stimulation, Industrial & Engineering Chemistry Research, 47, 23,
(2008) pp 9696-9702, ISSN 0888-5885
Li, G.; Li, X.; Tang, L G.; Li, Q P. (2008b). Control Mechanisms for Methane Hydrate
Production by Thermal Stimulation, Proceedings of the 6th International Conference on
Gas Hydrates (ICGH 2008), Vancouver, British Columbia, CANADA, July 6-10, 2008.
Makogon, Y. F.; Holditch, S. A.; Makogon, T. Y. (2007). Natural gas-hydrates - A potential
energy source for the 21st Century, Journal of Petroleum Science and Engineering, 56,
1-3, (2007) pp 14-31, ISSN 0920-4105
Milkov, A. V. (2004). Global estimates of hydrate-bound gas in marine sediments: how much
is really out there? , Earth-Science Reviews, 66, 3-4, (2004) pp 183-197, ISSN 0012-8252
Moridis, G. J. (2003). Numerical studies of gas production from methane hydrates, SPE
Journal, 8, 4, (2003) pp 359-370, ISSN 0036-1844
Moridis, G. J.; Collett, T. S.; Dallimore, S. R.; Satoh, T.; Hancock, S.; Weatherill, B. (2004a).
Numerical studies of gas production from several CH4 hydrate zones at the Mallik
site, Mackenzie Delta, Canada. Journal of Petroleum Science and Engineering, 43, 3-4,
(2004) pp 219-238, ISSN 0920-4105
Moridis, G. J. (2004b). Numerical Studies of Gas Production from Class 2 and Class 3
Hydrate Accumulations at the Mallik Site, Mackenzie Delta, Canada, SPE Reservoir
Evaluation and Engineering, 7, 3, (2004) pp 175-183, ISSN 1094-6470
Moridis, G. J.; Kowalsky, M. B.; Pruess, K. (2007). Depressurization-induced gas production
from class 1 hydrate deposits, SPE Reservoir Evaluation & Engineering, 10, 5, (2007)
pp 458-481, ISSN 1094-6470
Moridis, G. J.; Collett, T. S.; Boswell, R.; Kurihara, M.; Reagan, M. T.; Koh, C.; Sloan, E. D.
(2009a). Toward Production From Gas Hydrates: Current Status, Assessment of
Resources, and Simulation-Based Evaluation of Technology and Potential, SPE
Reservoir Evaluation & Engineering, 12, 5, (2009) pp 745-771, ISSN 1094-6470
Moridis, G. J.; Reagan, M. T.; Kim, S. J.; Seol, Y.; Zhang, K. (2009). Evaluation of the Gas
Production Potential of Marine Hydrate Deposits in the Ulleung Basin of the
Korean East Sea, SPE Journal
, 14, 4, (2009) pp 759-781, ISSN 0036-1844