solar collectors and panels theory and applications Part 14 docx
Bạn đang xem bản rút gọn của tài liệu. Xem và tải ngay bản đầy đủ của tài liệu tại đây (824.83 KB, 30 trang )
Applications Oriented Research on Solar Collectors at the "Politehnica" University of Timişoara
381
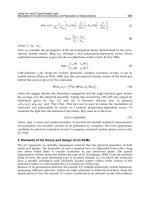
Some regions of the absorbing surface are shadowed by the window supports and by the
walls of the chassis. The first effect has a daily variation, while the second one may be
considered to have a hourly variation. A cross section through the lateral window support is
represented in Fig. 3. The fluid crosses n times the shadows created by the central and
lateral supports , with n = 5 the number of pipes. The total length of the shadow may be
expressed as
(
)
θ
=
+−
⎡
⎤
⎣
⎦
1
tanLnh bd, (1)
where h is the overheight (Fig. 1), b is the width of the central support (Fig. 2), d is width of
the insulation (Fig. 3) and θ is the angle between the incoming sun ray and the normal to the
absorber. For example, at equinox,
θ
ωΔτ
=
, with ω – the apparent angular speed of the Sun
and
Δτ
- time from noon.
Fig. 2. Pipe for air circulation.
The length of the pipe that is irradiated allowing for the heat to be absorbed is
1cd
LL L
=
−
. (2)
The surface of the fluid that is irradiated,
c
AaL
=
, results:
()
(
)
tan
ccd
AaL nh db
θ
⎡
⎤
=− −+
⎣
⎦
(3)
so that the fraction of surface that is effectively used is
(
)
θ
+−
⎡
⎤
⎣
⎦
=−
tan
1
cd
nbd
f
L
. (4)
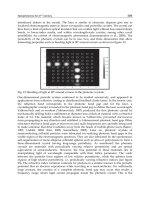
The variation of the fraction f with the hour is represented in Fig. 4. It may be seen that
0.85f ≈ for a time interval of 4 – 6 hours centred at noon.
Support
width - b
Window
central
support
Lateral
window
support
Cold
air
Hot air
b
Solar Collectors and Panels, Theory and Applications
382
Fig. 3. Shadowing of the surface.
In order to find the equations that characterize the system, we note that the heat obtained by
thermal conversion is transferred to the working agent. The fluid enters the collector at a
temperature T
fi
and exits at a temperature T
fe
. The energy balance for the fluid that flows
through a small segment of pipe, of length Δy, is
'0
pf pf u
yyy
mC T mC T q y
Δ
Δ
+
−
+=
, (5)
where m
is the mass flow rate, C
p
is the isobar specific heat of the fluid, q
u
' is the heat flux
absorbed by the unit length of a current tube and T
f
is the temperature of the fluid.
Fig. 4. Irradiated fraction of surface versus hour.
The flux absorbed per unit length may be expressed as
(
)
''
ufa
qaFSUTT
⎡
⎤
=−−
⎣
⎦
(6)
where
(
)
c
eff
SG
τα
=
is the total flux density absorbed by the black plate, G
c
is the solar flux
density in the plane of the collector, F' is an efficiency factor and U is the coefficient of heat
loss in the ambient.
By manipulating (5) and (6), the equation of the temperature may be obtained:
'
exp
fa fia
p
SSFAU
TT TT
y
UUmC
⎛⎞
⎛⎞
=++ −− −
⎜⎟
⎜⎟
⎜⎟
⎝⎠
⎝⎠
. (7)
By setting y = L, the temperature at the collector output T
fe
may be obtained.
8
10
12
14
16
0.5
1.0
f
Hour
absorber
insulatio
n
d
h
θ
normal to the absorber
Incomin
g
ra
y
Applications Oriented Research on Solar Collectors at the "Politehnica" University of Timişoara
383
If the collector is functioning in an open regime, the input temperature is equal to the
ambient one
f
ia
TT= , which, substituted into (7) yields (Luminosu, 1983)
'
1exp
fa
p
SFaU
TT y
UmC
⎡
⎤
⎛⎞
=
+⎢− − ⎥
⎜⎟
⎜⎟
⎢
⎥
⎝⎠
⎣
⎦
. (8)
For
yL= , and by using
c
A
aL= , the temperature at the output of the collector results:
'
1exp
fe a c
p
SFU
TT A
UmC
⎡
⎤
⎛⎞
=
+⎢− − ⎥
⎜⎟
⎜⎟
⎢
⎥
⎝⎠
⎣
⎦
. (9)
The temperature rise
f
ea
TT T
Δ
=
− versus the radiant power density absorbed by the black
plate S is represented in Fig. 5. The curves are linear and start from the origin. Temperature
rises as high as 50
o
C may be achieved.
Fig. 5. Temperature rise versus absorbed power density.
The energy flow for the air collector in open state (heat per time unit or power),
()
u
pf
ea
QmCTT=−
is (De Sabata & al. 1983):
'
1exp
c
up
p
SFUA
QmC
UmC
⎡
⎤
⎛⎞
=
⎢− − ⎥
⎜⎟
⎜⎟
⎢
⎥
⎝⎠
⎣
⎦
. (10)
The collector power versus the density of the flux absorbed by the black plate is represented
in Fig. 6, at various mass flow rates of the fluid. The power increases with the incoming
radiation and the flow rate. At large flow rates, at noon, the power may increase up to
800 W.
The specific power is the ratio of the energy flow to the collecting surface
u
u
c
Q
q
A
=
. (11)
0
0
20
40
200
400
600
S [W/m
2
]
t =(T-T
a
) [
o
C]
Solar Collectors and Panels, Theory and Applications
384
The values of the specific power are listed in Table 1. Measurements have shown that this
quantity reaches larger values in the afternoon than before noon for similar values of the
incident flux. This result may be explained by the fact that the carcass of the device provides
additional heat to the fluid when the radiation intensity decreases.
Fig. 6. Collector power versus absorbed radiation, parameterized by the flow rate
S[W/m
2
] 100 200 300 400 500 600
u
q
[W/m
2
]
33 74 124 152 200 218
Table 1. Absorbed flux density and specific power.
The instantaneous efficiency of the collector is
u
i
cc
Q
AG
η
=
. (12)
Equations (10) and (12) imply
'
1exp
p
c
i
cc p
mC S
FUA
UA G mC
η
⎡
⎤
⎛⎞
=
⎢− − ⎥
⎜⎟
⎜⎟
⎢
⎥
⎝⎠
⎣
⎦
. (13)
The variation of the efficiency with the absorbed flux, for various values of the flow rate is
represented in Fig. 7.
The long term performance of the collector is given by the average efficiency in the
considered time interval
,u avera
g
e
cc
Q
AG
η
=
(14)
where
,u avera
g
e
Q
is the average value of the power provided by the collector and
c
G
is the
average value of the incident radiant power density in the considered time interval.
The hourly variation of the average efficiency is represented in Fig. 8, parameterized by the
flow rate.
0
400
800
200
400
600
S [W/m
2
]
P [W]
0
•
•
•
•
•
•
×
×
×
×
°
°
°
°
*
*
*
*
*
*
+
+
+
+
+
+
• 135 m
3
/h
× 108 m
3
/h
° 81 m
3
/h
* 54
+ 27 m
3
/h
Applications Oriented Research on Solar Collectors at the "Politehnica" University of Timişoara
385
The curves presented in Fig. 8 show that efficiencies are high around noon, when the
incidence angles are small and the absorption – transmission products are high. The time
variation of the incidence angle determines changes of the absorption-transmission product
which, at its turn, determines the variation of the efficiency. The curves present maxima at
noon, but they are asymmetric with respect to noon: the slopes of the curves are smaller in
the afternoon when the fluid is additionally heated by the metallic support. At high flow
rates (135 m
3
/h), the efficiency of the collector approaches 40%. This reasonably high
efficiency and the unsophisticated design recommend this solar collector for home
climatization and for drying applications in industry.
Fig. 7. Efficiency versus irradiation.
Fig. 8. Hourly variation of the average efficiency.
3. Trombe wall
The Trombe wall is the main element of heating systems for buildings based on passive
solar gain. For an outside temperature t
ext
=0
o
C and an inside temperature t
int
=20
o
C, a simple
wall (without solar installations) transfers heat towards the interior if the normal solar
Hour
η[%]
• 135 m
3
/h
× 108 m
3
/h
° 81 m
3
/h
* 54 m
3
/h
09
11
13
15
17
20
25
30
•
×
°
*
•
•
•
••
•
•
•
×
×
×
×
×
×
×
×
°
°
°
°
°
°
°
*
*
*
*
*
*
*
*
°
350
550
750
950
20
25
30
G
c
[W/m
2
]
η [%]
••
•
•
×
°
*
×
×
×
°
°°
*
*
*
• 135 m
3
/h
× 108 m
3
/h
° 81 m
3
/h
* 54 m
3
/h
Solar Collectors and Panels, Theory and Applications
386
irradiation is greater than 465.2 W/m
2
(Athanasouli & Massouporos, 1999). Such conditions
are met in Timişoara, Romania during transition months, between 11 am and 1 pm. In order
to increase the contribution of the wall to the energy required for heating the room and in
order to decrease energy losses during night time, the wall may be covered with a glass
plate during daytime and additionally with a curtain at night fall (Ohanesion & Charteres,
1978). The solar panels mounted on the eastern and southern walls of a school supplied each
year a thermal energy of 2469 kWh during classes (Lo et al., 1994).
An experimental setup with Trombe wall has been built at the "Politehnica" University of
Timişoara in order to evaluate the opportunity of implementing passive solar installations in
the region. The installation has been used for heating a living room, complementary to
electric power, during transition months (March, April, September and October). The
Trombe wall has been placed on the southern wall of an ordinary building with four rooms
at the ground floor, otherwise heated by classical means. The three rooms that were not
heated by solar means have been maintained at a temperature of
o
21 1 C± , so that the heat
lost through the door of the target room could be neglected (De Sabata et al., 1986a, 1986b).
The dimensions of the solar heated room were
2.80 4.75 1.75 m×× and the dimensions of
the window on the southern wall were
1.0 0.75 m×
. The walls made with bricks were
0.39 m thick and were plastered with lime and mortar. The concrete foundation was
1mh =
deep and 0.49 m thick. The underground water layer is situated at a depth smaller than four
meters and it has a temperature
o
10 C
f
t = . The surface of the Trombe wall was
2
8.8 m
T
A =
(Fig. 9). The curtain from I covered the wall during night time. The air dampers L
1,2,3
controlled the direction of the air flow. A water container C was attached to the passive wall
in order to raise the inside air humidity. The small power fan F (
10 WP =
) contributed to
the uniformity of the thermal field.
The heating of the room has been provided by a radiator with thermostat R and the Trombe
wall. The heat supplied by the two devices balanced the thermal losses of the room through
the eastern wall, the floor and the window (Luminosu, 2003a). Temperatures at points 1 12
have been measured with the thermometer V, having an error of
o
0.1 C± . The global
radiation intensity G has been measured with an error of 5%
±
by means of an instrument
built in our laboratory (Luminosu et al., 2010), the electric power with an aem1CM4a
instrument (N on Fig. 9), with an error of
5Wh± and the air humidity has been measured
with the hygrometer H, having an error of 5%
±
. Additionally, the velocity of the air current
has been measured with the anemometer FEET (A, Fig. 9), error 10%
±
and the illumination
at the centre of the room has been measured with a Lux PU150 light meter.
The average air velocity has been found to be
0.15 m/sv =
, which corresponds to the upper
comfort limit and, due to the additional water container, the humidity has been kept in
between the limits 35 70%, a range well inside the comfort limits. The lighting at the centre
of the room has been in the range 50 70 lx in the horizontal plane; these values have been
achieved by operating the blinds and by turning on the 12 W ECOTONE light bulbs for
about 4 hours a day.
The measured values of the solar radiation (1), temperature at the upper air damper (2),
temperature at the centre of the room (3) and ambient temperature versus hour are
presented in Fig. 10. Measurements have been performed in autumn (October and
November) and spring (mid February and March). Temperature ranges of 14 17.5
o
C at the
centre of the room, 21 31
o
C at the upper air damper and 18 22
o
C near a wall shared with
an adjacent room have been obtained.
Applications Oriented Research on Solar Collectors at the "Politehnica" University of Timişoara
387
The daily average radiant energy has been 99.1 MJ
d
H = . Adding up the hourly measured
heats resulted in the following average daily heats: the heat lost by the room 22.4 MJ
dL
Q = ,
the heat supplied by the passive wall 10.26 MJ
dT
Q = and the electric energy for heating
12.31 MJ
del
Q =
Fig. 9. Room with Trombe wall and measuring points.
The power of the Trombe wall has been
237.5 W
T
P = . As the average number of days with
clear sky during the transition months is 46N
=
, the annual average heat supplied by the
wall is 131 kWh
yT dT
QNQ== . The daily efficiency of the passive wall is 100
dT
T
d
Q
H
η
=× .
Depending on the season, the efficiency of the considered wall varied between 7.8 and
10.4%. The specific annul heat of the wall is
2
14.9 kWh/m
yT
yT
T
Q
q
A
== .
The sensation of thermal comfort is determined by the inside temperature and the
temperatures of the walls and objects the human body establishes a radiant energy exchange
with. According to hygienists (Săvulescu, 1984), the radiant temperature (
o
C) is given by
1
n
rad
jj
j
tft
=
=
∑
(15)
and the room temperature by
(B)
(N)
(
A
)
(F)
(V)
(H)
(
N
)
(L3)
(C)
(L2)
(L1)
(RSN)
(R)
4
7
6
1
10
8
9
3
2
5
12
(S)
I
kW
(WT)
East
(mV)
G
ver
t
G
hor
2.80
G
vert
G
G
hor
t
11
Solar Collectors and Panels, Theory and Applications
388
2
int rad
room
tt
t
+
= , (16)
where t
int
is the inside room temperature, n is the number of elements the body exchanges
radiant energy with and f
j
are the shape factors
j
j
A
f
A
=
(A
j
– area of the j'th element, A –
exchange area).
The level of comfort is optimal when the room temperature is equal to the comfort
temperature prescribed by hygienists. According to Bradke (in Săvulescu, 1984), an inside
air temperature
o
21 C
int
t = must have a radiant temperature correspondent
o
,
16.3 C
rad adm
t =
and a comfort temperature one of
o
18.7 C
comf
t = .
Fig. 10. Temperature of the passive wall and global solar radiation versus hour.
The shape factors f
j
and the average temperatures
j
t of the walls of the room heated by the
passive wall, the average radiant temperature
rad
t and the room temperature
room
t are given
in Table 2.
Radiant element
f
j
j
t (°C)
rad
t (°C)
room
t (°C)
Eastern wall 0.09 16
Southern wall 0.24 26
Western wall 0.09 18
Northern wall 0.24 18
Ceiling 0.16 14
Floor 0.16 13
17.9 19.5
Table 2. Thermal comfort inside the room.
The Trombe wall produces a room temperature by 0.8
o
C higher than the comfort
temperature prescribed by hygienists.
The thermal comfort factor, according to Van Zuilen (in (Săvulescu, 1984)), is given by
(
)
(
)
1/2
int int
0.25 0.1 0.1 37.8
rad
BC t t x t v=+ − + − − , (17)
T[K]
G[W/m
2
]
8
11
14
17
20
300
310
320
330
100
200
300
400
Hour
1
2
3
4
Applications Oriented Research on Solar Collectors at the "Politehnica" University of Timişoara
389
with x – absolute humidity inside, 12
g
/k
g
x
=
; C – constant depending on the season,
10.6C =− in this case; v – velocity of the air.
Depending on B, the thermal sensation of comfort may be optimal 0B
=
, satisfactory
1B =± , or discomforting 3B
=
± . In our case we have 0.325B
=
− , meaning that comfort
reaches an optimal state.
4. Solar collectors from recyclable materials
Applications of Solar Energy in urban areas are facilitated by the existing infrastructure.
However, in isolated locations, additional preparations that raise the costs of installations
are necessary. Therefore, the possibility of using waste materials, resulted from
demolishment of old buildings and from old appliances for devising low cost, small size
solar collectors has been studied in our laboratory (Luminosu, 2007a). Transforming waste
into raw material for a useful application has both a favorable impact on prices and on
ambient. The main mechanisms of this impact are: decrease in the quantity of polluting
waste; decrease in the demand for metal and glass from industry; decrease of energy
consumption from classical sources; raise in the quality of life by the availability of low cost
and ambient friendly energy in isolated locations; economy in transportation costs, as
discarded materials are often available at the place were the collectors are built (e.g.
following demolishments of old buildings); and economy in fabrication costs, as materials
are often preprocessed and already cut into usable shapes, so that the collectors may be
realized in modest mechanical workshops.
4.1 Solar collector from old glass plates
A first solar collector has been realized from glass plates, Fig. 11. The represented elements
are: metallic frame – 1; vertical glass plates oriented towards south – 2; heated water – 3;
cold water tank – 4; taps – 5, 6; mechanical support – 7; expansion bowl – 8; solarimeter – 9.
Water is stored between the glass plates. One plate is transparent, while the other plate is
painted in black, in order to absorb the solar radiation. The hot water is removed through
Fig. 11. Collector with glass plates.
1
2
3
4
5
6
7
8
9
8
Solar Collectors and Panels, Theory and Applications
390
the tap 5. The collector is filled with water contained in the tank 4, by the principle of
communicating vessels, through the tap 6. The collector is positioned vertically in order to
avoid breaking of the glass plates. The dimensions of the plates are 40 × 70 cm. The
dimensions of the collector and the quantity of water stored between the glass plates must
be kept reasonably low, by mechanical reasons related to the resistance to bending of the
glass. The thickness of the water layer is 1.5 cm and the mass of water is m=4.2 kg.
The collector has been experimentally tested. Solar radiations has been measured with a
solar wattmeter built in our laboratory (Luminosu et al., 2010). The water temperature T
w
and the ambient temperature T
a
have been monitorized. The water has been heated in time
intervals comprised between 0.5 and 5.5 hours, symmetrically placed around noon.
Measurements have been taken every 0.5 hours. It has been found that, under clear sky
conditions, the water temperature raised by approximately 32
o
C with respect to the ambient
temperature so that the water could be used for domestic purposes. The obtained average
efficiency of the collector has been
33.3%
η
=
.
4.2 Solar collector based on the heat exchanger of an old refrigerator
A second design consisted of a solar collector built around some parts of an old refrigerator.
These parts are frequently available following the current replacement of old, heavy energy
consuming refrigerators with modern, ecological ones. The disclosed heat exchangers and
polystyrene sheets from the old refrigerators may be used for building small sized solar
collectors, with favourable effects on the ambient.
The design of a collector that uses parts from an old "Arctic" refrigerator is presented in Fig. 12.
Fig. 12. Collector with pipes from an old refrigerator.
The elements in Fig. 12 are: mechanical support – 1; tap for cold water – 2; heat exchanger –
3; tap for hot water – 4; container with warm water – 5. The heat exchanger is 0.90 m long
and 0.45 m wide, the pipes circulating the working fluid are spaced by 6 cm and the
collecting area is 0.405 m
2
. The collector is oriented towards south, at a tilt angle of 45 deg. A
greenhouse effect is created by means of a glass plate, 3 mm thick. The hot water is
accumulated in a Dewar pot. A coefficient of thermal losses
-2 -1
6.453 Wm KU = and an
absorbtion – transmission equivalent product
(
)
0.847
τα
= have been determined. The
collector has been studied in open circuit.
For large flow rates of the water, of up to 3.60 kg/h and for densities of the solar flux of
500 600 W/m
2
, the raise of the water temperature may reach up to 30
o
C and the efficiency
1
2
3
4
5
Applications Oriented Research on Solar Collectors at the "Politehnica" University of Timişoara
391
may be larger than 50%. In this way, the temperature of the water in the Dewar pot reaches
50 60
o
C, a temperature that allows the domestic use.
In conclusion, the use of recyclable materials for devising small sized thermal solar
collectors has favourable impacts both on the way of life in isolated places and on the
ambient.
5. The "Politehnica" solar house
Solar houses are equipped with thermal solar systems that maintain the inside temperature
at a comfortable level and produce hot water for domestic use. As maximum solar radiation
and energy need are not synchronous events, several types of thermal solar installations,
which complement the classical ones, have been conceived. Some examples from the
literature include: a hybrid solar system with heat pump, plane collectors and storage tank
with CaCl
2
·6H
2
O (Çomakli, 1993); thermal solar system with heat pump that relies on the
heat accumulated in the roof of the building (Loveday & Craggs, 1992); and thermal solar
system with plane collectors complementary to the gas installation (Pedersen, 1993). Close
to our laboratory, an experimental Solar House has been built and experimented with.
5.1 The solar house and measuring devices
The building has two rooms, a lobby and an access hall. A "minimal thermal loss enclosure",
situated at the first floor has been defined and provided with a double layered door and a
triple layered window. The dimensions of the room are
3.5 3.5 2.8 m××
, giving a total
volume
3
35 m
r
V = and a total thermal exchange area
2
63.7 m
r
A = . The technical room is
situated at the ground floor. A bedrock thermal accumulator, in the shape of a
parallelopiped of dimensions
1.5 1.5 4 m××
and filled with river stone
(
)
16.6 MJ/KgC = is
deposited in the basement. The concrete walls are 40 cm thick and insulated with mineral
wool. The main side of the building is south oriented.
The energy system shown in Fig. 13 includes the plane collectors – 1, the heat exchanger – 2,
the thermal accumulator – 3, the heated room – 4 and the technical room – 5. The collecting
field consists of twelve "Sadu 1" solar collectors connected in parallel. Each of the plane
collectors is provided with aluminium pipes with inner diameter of 20 mm, facing south
and tilted by an angle
45 de
g
s
=
from horizontal. The dimensions of the collectors are
2.0 1.0 0.12 m×× and they are insulated with a 50 mm thick layer of mineral wool. The case
is made of 0.8 mm steel plates. The heat-transfer fluid is water, activated by a 40 W Riello
TF108 pump at a mass flow rate
300 k
g
/h
w
m
=
. The total collecting surface is
2
24 m
c
A =
and the thermal and optical parameters are
2
3.7 W/m
c
U = and
(
)
0.81
eff
τα
=
.
The heat exchanger is of air-water type with copper coil and it provides a power of 60 W
and a mass flow rate
1154 k
g
/h
a
m
=
. The heat carried by the hot water from the collectors
to the coil of the heat exchanger is transferred to the air and carried to the bedrock. The
direction of the air flow between the heat exchanger, tank and heated room through the
nozzles
C, D and H is determined by the slide dampers mounted at points a, b, c and d (Fig.
13). The heated room (minimum loss enclosure 4) may be heated either by solar means (the
hot airflow comming fron the accumulator through nozzle
H) or electrically from the
radiator
R equipped with a thermostat. The temperatures at points A, B, C, D, H (heat
carrying fluid),
F (hall), I (tank), G (exterior) and T (technical room) are read on the electric
thermometer
V with an error of
o
0.5 C± . The thermometer is equipped with 1N4148 diode
Solar Collectors and Panels, Theory and Applications
392
Fig. 13. Simplified chart of the energy system of the Solar House
sensors. The intensity of the solar radiation G is read on the pyrheliometer J with an error of
2
1W/m± . The flow rate is obtained by dividing the volume recorded with the AEM BN5
water gauge, with an error of
3
25 cm± , at point M, by the recording period of time. The air
velocity is measured with a FEET anemometer at point
N, with an error of 0.5 m/s
±
, so that
the air flow rate may be evaluated from
3
895 m /h
aaa
VAv== (A
a
is the area of the orifice of
the nozzle). The electric energy used by the radiator
R for heating is read on the AEM
1CM4A meter at point
K1, with an error
3
510kWh
el
Q
Δ
−
=± × and the energy used by the
pumps is read on a similar meter at point
K2. A βM135 temperature detector is mounted at
point
L. The detector triggers a control circuit that starts the pumps if the water at the
collectors output has a temperature over 50
o
C.
5.2 Analytic model for the solar house
The heat loss per time unit through walls, ceiling, and through window and door openings
is given by (De Sabata & Luminosu, 1993)
L
M
2
3
5
R
H
d
J
1
s
4
G
E
kWh
K1,K2
F
V
Air
Water
T
A
B
a
c
b
N
C
D
I
Air
Air
Accumulator
Corridor
Technical
Room
Heated Enclosure
Applications Oriented Research on Solar Collectors at the "Politehnica" University of Timişoara
393
2
1
1
i
ii
i
i
T
QmA
R
Δ
=
=
∑
(18)
where
1 FG
TTT
Δ
=− and
2 FE
TTT
Δ
=
− ; m – thermal mass coefficient,
1
0.90m
=
for the walls
and
2
1.2m = for the window and the door; A
i
- the corresponding surface areas and R
i
–
global thermal resistances.
The heat per time unit required to warm up the air infiltrated through the shutters of the
window and the door may be expressed as
()
4/3
2
door
QEiL Q
ν
=+
(19)
where
E=1 (first floor), i – air infiltration coefficient i=0.081 Ws
4/3
m
1/3
K
-1
, L – lengths of the
shutters,
L
door
=5.4 m, L
window
=4.4 m; v – wind velocity, v=3.4 m/s (typical value).
The thermal resistance is given by
3
1
11
j
j
int
j
ext
d
R
k
α
α
=
=+ +
∑
(20)
where
,int ext
α
- surface thermal exchange coefficients,
-2 -1
8Wm K
int
α
= ,
-2 -1
22.8 Wm K
ext
α
= ;
d
j
– thicknesses of the successive layers of materials that forms the walls; k
j
– heat
conductivity of the layers [Wm
-1
K
-1
].
The heat loss per time unit for the room is the sum
12L
QQQ=+
. (21)
The hourly heat loss is 3600
hL L
QQ=
and the daily heat loss
1
n
dL hL
QQ=
∑
(n – number of
hours).
The heat lost by the room is compensated through solar and electric gains:
dL H F el
QQ Q
→
=+ (22)
Hourly measurements have been carried out over several series of 3-4 days during spring
(March, April, May) and autumn (September, October, November), 2000. In order to obtain
average insolation characteristics, the experimental data have been statistically processed as
described below.
The measurement period has been split into 12 h intervals, successively numbered 1, 2, ,
n;
then,
12
nn n=+, n
1
– number of intervals with significant insolation, n
2
– number of
intervals without solar radiation (night time and days with overcast sky). The hourly and
daily average energy have been calculated with:
1
1
1
3600 ,
hhcch h
n
HGAH H
n
==
∑
(23)
1
p
dh
j
i
HH
=
=
∑
(24)
p – number of 1 h intervals in an insolation day, 1 8p = .
Solar Collectors and Panels, Theory and Applications
394
The hourly average temperatures at points shown in Fig. 13 have been calculated using the
equation
1,2
1
1,2
1
, ,,, ,,,, ,
n
hq hqi
i
tt
q
ABCDEFGHI
n
=
==
∑
. (25)
The elements of the energy system have been labeled as follows (Fig. 13):
j=0 – collecting
area;
j=1 – collectors, between A and B; j=2 – heat exchanger, between C and D; j=3 –
accumulator, between
I and H; j=4 – room, between H and F. The hourly and daily average
heat have been calculated for each segment using
()
3600 ,
h
j
xx h
j
d
j
h
j
p
QmCtQQ
Δ
==
∑
(26)
(e.g.
1hhAhB
ttt
Δ
=−); the subscript x identifies the nature of the fluid: xa
=
– air, xw= –
water.
The average efficiencies of the successive links have been calculated with
,1
,
dj
j
d
j
Q
Q
η
+
= . (27)
For example, for the collectors we have
()
8
,1
1
,0 1
3600
,
w w hA hB
d
dd
dd
mC t t
Q
QH
HH
η
−
===
∑
.
The average efficiency of the system is given by:
3
1
s
y
st
j
j
η
η
=
=
∏
. (28)
5.3 Experimental results
The hourly variation of the quantity
h
H versus hour of the average day is represented in
Fig. 14 (Luminosu, 2003b).
The daily average of the radiant energy has been
= 389.8 MJ
d
H . The average hourly
temperatures at points
A, B, C, D and I versus hour are represented in Fig. 15.
The average temperature at
A, at noon has been 83
o
C. The highest temperature at A, i.e.
87
o
C, has been reached during May and September. During March and November, the same
point has reached the lowest temperature, 61
o
C.
The maximum average temperature of the air in the heat exchanger has been of 52
o
C. The
temperature of the accumulator has been carefuly maintained above 30
o
C all throughout the
measurement period
(
)
=
o
,
30 C
min st
t . The average increase in the temperature of the tank
during the daily loading period has been
Δ=
o
11 C/da
y
t . The average decrease in
temperature during the extraction of heat from the bedrock has been of 4.5
o
C/day. The
average temperature inside the heated room has been kept at
()
±
o
20 1 C for an ambient
(exterior) temperature variation between 4 and 15
o
C. The average daily heat transferred by
the collectors to the heat exchanger has been
→
==
,1
291.6 MJ
dA B d
QQ . An efficiency
η
=
1
0.75
for the collecting field has been obtained.
Applications Oriented Research on Solar Collectors at the "Politehnica" University of Timişoara
395
Fig. 14. Hourly averaged parameters
h
H ,
,1h
Q and
,2h
Q versus hour.
Fig. 15. Hourly averaged temperatures at points
A, B, C, D and I.
The daily average heat swept away by the air curent from the coil conected between
A and B
(Fig. 13) has been
→
==
,2
239.4 MJ
dD C d
QQ , so that the average efficiency of the heat
exchanger resulted as
η
=
2
0.82 . The average quantity of heat transferred from the air
current to the bedrock has been
→
==
,3
183.7 MJ
dI H d
QQ and the corresponding efficiency
η
=
3
0.77
ld
. The room had a solar gain
→
==
,4
115.7 MJ
dH F d
QQ , so that the efficiency of the
heat extraction from the storage environment resulted as
η
=
3
0.63
ds
. The global efficiency of
accumulation and storage of heat could then be calculated:
η
ηη
=
=
333
0.49
ld ds
.
By using (28), one gets for the efficiency of the system
η
=
0.30
syst
.
The daily power consumption of the pumps is
=
,
5.2 MJ
el pumps
Q .
The average heat lost daily in the heated enclosure has been
=
4
186.6 MJ
dl
Q , which is
compensated by solar energy
4d
Q given above and by the energy provided by the electric
radiator
=
,,
70.9 MJ
delheat
Q . The solar energy ratio for room heating is
,h
q
t
(
o
C)
40
60
20
Hour
,hA
t
,,hBC
t
,,hDI
t
9
11
13
15
17
h
H
[MJ/h]
50
h
H
,h
j
Q
[MJ/h]
,1h
Q
,2h
Q
30
10
9
11
13
15
17
50
30
Hour
Solar Collectors and Panels, Theory and Applications
396
4,
4
100 59%
delpump
dL
p
Q
−
=×=
. (29)
5.4 Discussion
The solar system has an efficiency of 30% with respect to the incident solar energy. The
thermal energy produced by the energy chain of the residence could provide 60% of the
needs of the minimum loss enclosure. As the global efficiency is the product of individual
ones, a possibility to increase the efficiency is o decrese the number of elements in the series
conection.
A typical value for the southern side of the roof of an average residence is
=
2
'40mA . This
collecting area would give each year, at the location with solar conditions similar to those
considered above, a quantity of heat as high as
=
=' ' 3977 kWh
uyu
QqA .
The present study might be extrapolated to thermal systems that do not contain heat
exchangers. In this case, the water collector has to be replaced with air collectors. The hot air
may be directed both towards the room and towards the thermal storage tank.
As a conclusion, the development of passive and active solar architecture in the Euroregion
might be beneficial for both private residences and institutional buildings.
6. Thermal system for drying ceramic blocks
Solar collectors may be used with good results as complementary sources of heat in
technological processes that take place at moderate thermal levels. Such applications lead to
the reduction of conventional fuel consumption and have favourable impact on the
environment.
Air solar collectors are used worldwide in complex installations for the climatization of
buildings and for drying industrial and agricultural products. In the case of plane solar
collectors with air and bedrock between the absorbing and transparent plates, the rocks in
the current tube increase the turbulence of the air flow, so that the coefficient of thermal
transfer and consequently the efficiency are also increased (Choudhury & Garg, 1993). Air
solar collectors with thermosyphoning and rocks in the fluid current tube are used for
heating social buildings during daytime (Lo et al., 1994). Solar installations optimized
through exergetic analysis are used in Mexico for drying mango fruits (Torres-Reyes et al.,
2001).
At the Physics Department from the "Politehnica" University of Timişoara, a thermal system
with plane collectors designed for drying ceramic blocks has been realized. The system
relies on hot air from the collectors during the daytime and on heat accumulated in water
tanks in the night time.
6.1 Description of the system
The thermal system has been placed on the roof of an industrial hall belonging to the Plant
for Ceramics Products from Jimbolia, near Timişoara. The hall was 12 m long and had a
volume
=
3
312.5 m
h
V , Fig. 16, (De Sabata et al., 1994).
A common practice for drying ceramic blocks relies on the Johnson burner with fuel oil. At
the place, the power was
P=770 kW. Hot gases resulted after the burning process are blowed
with a ventilator over the drying hall.
Applications Oriented Research on Solar Collectors at the "Politehnica" University of Timişoara
397
Fig. 16. Hall for drying ceramic products.
The hall was divided into 10 corridors; each corridor contained
1
8000n
=
(hollow) bricks
posed on mobile shelves. The drying process consists of removing a quantity of water
2
0.5 k
g
m =
from each brick, such the humidity decreases below 5% (Luminosu, 1993).
The minimum quantity of heat needed for a drying cycle is
10
25 10 J
cycle
Q =× . The average
quantity of water that must be evacuated in a 10 day cycle is
167 k
g
/hM = . The variation
in humidity of the air is
3
510x
Δ
−
=× kg of water per kg of air. The air in the hall must be
renewed N=9 times per hour. As the working temperature varies between 40 and 60
o
C, a
fraction of the heat Q
cycle
may be obtained by solar conversion.
The longitudinal axis of the hall was oriented in the E-W direction. On the south oriented
roof, a plane solar collector with air has been posed. The collectors were tilted by an angle
30 de
g
s = and the total collecting surface was
2
600 m
C
A = .
The path of the air current is presented in Fig. 17. The air was blown with fans placed in
each corridor, having a power of 100 W.
The quality of the ceramic products is determined by the uniformity of the drying process.
Consequently, the storage of thermal energy of solar origin for subsequent use during
periods without sun is important.
Fig. 17. Air current tube
A storage system of thermal energy as sensible heat has been designed to supply the
requirements of the drying process during nighttime or for one or two days with low solar
radiaton. Water collectors of type Sadu1 have been mounted on the roof of a neighboring
hall, having a collecting area =
2
' 360 m
C
A . The average hourly specific power of the
Input,T
a
Output, T
o
Corridor
Solar Collectors and Panels, Theory and Applications
398
collectors has been
3-21
2.09 10 kJ m hq
−
=
×⋅⋅. The average hourly captured thermal energy
has been
51
' 7.524 10 kJ h
h
Q
−
=× ⋅. The flow rate of the water through the storage installation
has been
=
900 k
g
/h
w
m . The thermal energy has been stored as sensible heat in a storage
tank having a volume =
3
'54mV . The hot water has been circulated with a pump at a flow
rate of 800 l/h through radiators with horizontal pipes during nighttime. The air has been
blown over the radiators by using fans and then the heated air was directed to the drying hall.
6.2 Experimental results
The drying procedure has been applied to ceramic blocks of dimensions 24 12 8 cm
×
× . The
density of the burnt material was 1300 kg/m
3
.
Experiments at an industrial scale have been performed in the period April – September
1999. The drying process has been divided into cycles and it consisted of 3 cycles per month
with a duration of 6 8 days/cycle. Several physical quantities have been monitorized: the
solar radiation intensity G had a variation in the interval 460 920 W/m
2
; the ambient
temperature t
a
(23 33
o
C); the air temperature at the hall entrance t
in
(40 60
o
C); the water
temperature at the output of the water collector t' (40 73
o
C); the flow rate of the working
fluid v
()
33
2.2 2.6 10 m /h× ; the relative humidity of the air in the hall (30 35%).
The solar system has been used for heating the circulated air for 8 hours per day, in the
interval 8 am – 4 pm. From the accumulation tank, heat has been extracted for time periods
comprised between 8 and 16 hours per day. The Johnson burner has been used in parallel to
the solar system in order to provide an air temperature at the input of the drying system of
40 60
o
C and the prescribed air humidity of 30 35%.
Cylindrical samples with radii of 2 cm and heights of 8 cm have been periodically extracted
from the blocks. The samples have been weighted and compared with the burnt material in
order to determine the mass of water from the ceramic block. The drying process was
considered completed when the mass of water from the block was below 150 g.
The drying periods have been found as follows: n=6 days in June and July; n=7 days in May
and August; n=8 days in April and September.
The following quantities have been determined:
a.
the heat injected in the drying hall by the air collectors:
8
1
air air air j
j
QmCt
Δ
Δτ
=
=
∑
(30)
where
jj
a
ttt
Δ
=−, t
j
is the temperature of the air heated by the collectors and
Δτ
corresponds to the 8 hours interval when the air solar collectors were used;
b.
the heat injected into the hall from the storage system:
16
1
storage air air i
i
QmCt
Δ
Δτ
=
=
∑
(31)
where
iia
ttt
Δ
=−, t
i
is the temperature of the air heated by the storage system and
Δτ
corresponds to the 16 hours interval when the storage system was used for heating;
c.
the heat provided by the thermal solar system
s
y
st air stora
g
e
QQQ
=
+ ; (32)
Applications Oriented Research on Solar Collectors at the "Politehnica" University of Timişoara
399
d. the heat provided by the Johnson burner
J
J
Qm
q
=
(33)
where m
J
is the mass and 42 MJ/k
g
q
=
is the calorific power of the fuel oil;
e.
the total heat used for heating the hall:
nec s
y
st J
QQQ
=
+ ; (34)
f.
the total energy cosumed for the hall
nec electric
WQ W=+
(35)
where W
electric
is the electric energy that could be read on a meter;
g.
the fraction of heat of solar origin from the total energy used for the hall:
s
y
st
Q
f
W
=
. (36)
h.
The efficiencies of the solar installations have been calculated by dividing the heat they
provided by the solar energy incident on the collecting surfaces.
The monthly averages of these quantities are presented in Table 3.
Month April May June July August September
n (days/cycle) 8 7 6 6 7 8
G (W/m
2
) 741 833 864 849 780 656
<Q
syst
> (GJ/cycle) 80 91 84 82 81 72
<Q
J
> (GJ/cycle) 173 161 166 170 173 190
<Q
nec
> (GJ/cycle) 253 252 250 252 254 262
<W
electric
>(GJ/cycle) 0.51 0.45 0.38 0.38 0.45 0.51
<f> (%) 32 36 34 33 32 27
η
air
(%)
53 56 60 60 57 54
η
storage
(%)
34 37 40 41 38 35
Table 3. Monthly averaged quantities that characterize the drying process.
The results presented in Table 3 for one year show that the solar thermal system may
provide approximately one third of the thermal energy needed for the process of industrial
drying of ceramic blocks. The calculated efficiencies might change from year to year
following solar radiation and weather variability.
Experiments revealed that the presented system provided a uniform distribution of
temperature so that a reduction by 10% of the number of blocks broken during the burning
process with respect with other drying systems used within the same plant resulted.
The energy chain could be built with inexpensive and readily available materials and parts,
produced by the local industry.
Solar Collectors and Panels, Theory and Applications
400
7. Solar heater for bitumen melting
7.1 Experimental installation
The extension of the applications field of solar energy is possible by identifying new
industrial activities for which the thermal solar conversion is appropriate, efficient and
cheap. Low and medium temperature thermal solar installations (50-80
o
C) have the largest
efficiencies (40-50%).
Bitumen has many applications in civil engineering industry and road and highway
construction. In industry, bitumen is heated by classical means in a three-phase process:
heating up to 50-65
o
C for melting; heating up to 100-125
o
C for the asphalt mixture;
maintaining the thermal level during inactive periods.
The D80/100 bitumen used in road construction has the following physical properties:
penetration at 25
o
C of 0.0085 m, a melting point at 47.5
o
C, a ductility at –25
o
C of 1.30 m and
a density at 25
o
C of 1050 kg/m
3
. As the melting temperature is sufficiently low, it is possible
to use low and medium temperature thermal solar installations in the first phase of the
heating process.
At the present time, the literature on this subject is rare. At the Physics Department of the
"Politehnica" University of Timişoara, an experimental setup has been devised in an outdoor
laboratory in order to test the possibility of using solar energy for bitumen preheating
(De Sabata & Nicoara, 1984; Mihalca & al., 1988; De Sabata, 1986c). The results have been
encouraging, although the thermal conductivity of the bitumen
-1 -1
0.174 Wm K
bi
λ
= is much
smaller than the thermal conductivity of water
-1 -1
0.651 Wm K
w
λ
= (at 60
o
C). Further
research in this direction is still necessary in order to find the optimal solution.
The experimental installation is presented in Fig. 18. The elements are: cylinder of iron plate
– 1; mechanical support for the envelope – 2; insulating support for the cylinder – 3;
envelope made of glass plates – 4; thermometer – 5, indicating the temperature in the
collector, T
c
and the ambient temperature T
a
; device for the variation of the tilt angle of the
axis of the cylinder with respect to the horizontal – 6. The cylindrical tank has a length of
0.30 m, a diameter of 0.15 m a mass of 1.17 kg and it contains 6.4 kg of bitumen. The
installation is facing south and the axis of the tank is tilted by an angle of 30 deg with
respect to the horizontal (Luminosu & al., 2007b).
Fig. 18. Installation with semicylindrical glass envelope; (a) front view; (b) side view.
The results reported in Table 4 below have been obtained by measurements performed in
2003. The following quantities are considered: t
bi,k,av
– the hourly average temperature of the
3
2
Solaris
5
4
1
(a)
6
s
1
3
(
b
)
5
2
4
(T
a
)
(T
c
)
Applications Oriented Research on Solar Collectors at the "Politehnica" University of Timişoara
401
bitumen at hour k; t
a,k,av
- the ambient hourly average temperature at hour k; G
k,av
– average
hourly irradiance; G
d,av
- average daily irradiance; p – specific power; η – efficiency.
The experimental results show that the bitumen may be heated by solar means up to a
temperature of 50-65
o
C. The thermal field in the bitumen mass is influenced by the solar
radiation, the geometry of the installation and the ambient. The achieved efficiency of the
laboratory installation for bitumen heating has been between 8.1 and 9.1%. The results have
been favourable enough to suggest trying industrial applications.
Hourly interval
Δτ[h]
08-
09
09-
10
10-
11
11-
12
12-
13
13-
14
14-
15
15-
16
16-
17
17-
18
18-
19
t
bi,k,av
[
o
C] 21,0 24,5 30,0 36,0 42,5 47,5 50,5 54,0 56,5 56,5 53,5
t
a,k,av
[
o
C] 18,5 19,5 21,0 24,5 26,5 28,5 30,0 32,5 32,5 31,0 28,5
G
k,av
[W/m
2
] 344 438 760 863 978 960 747 684 431 386 297
p [W/m
2
] 65,6
G
d,av
[W/m
2
] 721
η [%] 9,1
Table 4. Hourly values of the quantities t
bi,k,AV
, t
a,k,AV
, G
k,AV,
I
d,AV
, p and η.
7.2 Industrial thermal solar system for bitumen preheating
The diagram of the solar system for bitumen preheating that has been realized at Săcălaz,
near Timişoara, in cooperation with the Roads and Highways Regional Direction is
presented in Fig. 19 (Luminosu et al., 2007b).
The solar installation has been placed on an existing construction. The elements in Fig. 19
are: solar collector, with a surface of 300 m
2
; roof made of iron plates – 2; pipes penetrating
the bitumen – 3; compartment with bitumen preheated at 90-100
o
C - 4; heat exchanger with
oil – 5; tank for bitumen heating at 100-150
o
C - 6; metallic meshes distanced by 0.5 m
(mounted in order to homogenize the temperature in the solar trap) – 7; thermometers – 8;
fire place – 9. An iron plate, having a thickness of 0.75 mm is placed between the glass plate
Fig. 19. Diagram of the industrial installation for bitumen preheating.
1
2
3
A1
5
6-tank
4-bitu
m
e
n
Hot
Bitume
n
Sout
h
Nord
(I)
(II)
7
8
8
7
7
A2
9
oil
Solar Collectors and Panels, Theory and Applications
402
and the surface of the bitumen. The solar installation accomplishes the bitumen heating up
to 50-55
o
C, with the favourable consequence of saving conventional fuel.
Financing conditions allowed only for preliminary measurements. The temperature has
been measured in the volume in between the surface of the bitumen and the roof (the solar
trap). We present as examples, in Table 5, the hourly averages of the temperatures of the
bitumen t
Bi
and ambient t
a
.
The maximum average temperature of the bitumen, 54-56
o
C has been obtained around
14h30. In the daytime when measurements have been performed, the maximum average
temperature in the solar trap has been larger than the ambient temperature by 27
o
C. It has
been evaluated a saving of approximately 80 kg conventional fuel for 1 m
2
collecting surface
per year. A further saving of fuel is obtained if the bitumen extraction is made around 4-
5 pm from the upper portion of the tank.
Hour 9h30min 10h30min 12h30min 14h30min 16h30min 18h30min
<t
a
>
[
o
C]
27,5 28,5 34,0 35,0 33,5 31,0
<t
Bi
>
[
o
C]
38.0 47,5 55,5 56,5 55,0 52,5
Table 5. Average temperatures in the solar trap.
8. Conclusion
Research in solar energy has been approached at the "Politehnica" University of Timişoara in
1976, motivated by economical and ecological problems related to classical fuels.
Solar collectors have been conceived and realized and several thermal solar installations for
producing hot air and water have been devised and applied in industry. Solar energy
technology has also been applied to waste water cleaning and to building climatization. A
part of this experience has been presented in this chapter. The installations have been
realized and tested in Timişoara, Romania. The obtained results are relevant for the south-
eastern part of Europe.
The experimentally determined efficiencies of the solar installations have been comparable
with efficiencies of similar installations produced in other European countries. This proves
the possibility of implementing solar energy applications in the region based on the local
industry and on locally devised solutions. However, a further involvement of the local
industry in the field of solar energy in particular and of renewable energy in general, as well
as the education of the population in this spirit are actions to be considered in the near
future.
9. References
Athanasouli, G. & Massouporos, P. (1999). A model of the thermal restoration transient state
of an opaque wall after the interruption of solar radiation. Solar Energy, Vol. 66, No.
1, (May 1999) pp. (21-31), ISSN 0038-092X.
Chouhury, C. & Garg. H. P. (1993). Performance of air-heating collectors with packed air-
flow passage. Solar Energy, Vol. 50, No. 3, (March 1993), pp. (205-221), ISSN 0038-
092X.
Applications Oriented Research on Solar Collectors at the "Politehnica" University of Timişoara
403
De Beni, G.; Friesen, R. & Olmo, M. (1994). Utilization of solar thermal energy in mountain
refuges through an innovative system. Solar Energy, Vol. 52, No. 2, (February, 1994),
pp. (221-224), ISSN 0038-092X.
De Sabata C.; Marcu, C. & Luminosu, I. (1994). Some industrial utilization of solar energy in
South-West Romania. Renewable Energy. Vol. 5, No. 1-4, (August 1994), pp. (387-
389), ISSN 0960-1481.
De Sabata, C. & Luminosu, I. (1993). Complex experimental base for the study of heat
conversion and solar energy storage. Solar Energy in Romania. Vol. 2, No. 1-2, (July
1993), pp. (115-116).
De Sabata, C.; Luminosu, I.; Mihalca, I. & Ercuţa, A. (1986a). Thermal phenomena in the
active part of some T-M wall models. Scientific Bulletin of the "Politehnica" University
of Timişoara, Trans. Math. - Phys. Vol. 31(45), No. 1, (May, 1986), pp. (81-84), ISSN
1224-6069.
De Sabata, C.; Luminosu, I.; Ercuţa. A. & Baea, R. (1986b). Experimental study on a Trombe
wall efficiency concerning dwelling climatization. Scientific Bulletin of the
"Politehnica" University of Timişoara, Trans. Math. - Phys. Vol. 31(45), No. 1, (May,
1986), pp. (117-120), ISSN 1224-6069.
De Sabata, C. (1986c). Contributions to the use of nonconventional energy in construction of
roads and highways; Ptischea (Roads), Vol. 25, No. 2, (February, 1986), pp. (1-4),
ISSN n/a (in Bulgarian).
De Sabata, C. & Nicoară, L. (1984). Use of solar energy for bitumen preheating in tanks.
Revue générale des routes et des aerodromes. No. 614, (December, 1984), pp. (69-71),
ISSN 0035-3191 (in French).
De Sabata, C.; Marcu, C. & Luminosu, I. (1983). On the energy flow rate in a plane solar
collector that produces industrial hot air. Scientific Bulletin of the "Politehnica"
University of Timişoara, Trans. Math. - Phys. Vol. 28(42), No. 2, (November, 1983), pp.
(99-102), ISSN 1224-6069 (in Romanian).
De Sabata, C.; Mihailovici, D.; Baea, R.; Luminosu, I. & Gangăl, M. (1981). Use of solar
energy for bitumen heating in high capacity cylindrical tanks. Scientific Bulletin of
the "Politehnica" University of Timişoara, Trans. Math Physics. Vol. 26(40), No. 2,
(November, 1981), pp. (65-72), ISSN 1224-6069 (in Romanian).
Folkerts, L.; van Orshoven, D.; Pavic, D. & Mack, M. (1996). A new design tool for collectors
with transparent insulation (TIM), Proceedings of EuroSun '96, Book 1, pp. 171-175,
ISBN n/a, Frieburg, October 1996, DGS Sonenenergie GmbH Pub., Frieburg
Haberl, R.; Frank, E. &Vogelsanger, P. (2008). Cost/Benefit ratio analysis of a maximum lean
solar combisystem. Proceedings of EuroSun 2008. Part: Domestic and Services Water
Heating, (USB – 8 pages), ISBN n/a, Lisabona, (October 2008), ISES Pub., Lisabona
Çomakli, Ö.; Kaygusuz, K. & Ayhan, T. (1993). Assisted heat pump and energy storage for
residential heating. Solar Energy. Vol. 51, No. 5, (November 1993), pp. (357-366),
ISSN 0038-092X
Lo, S., N., G.; Deal, C., R. & Norton, B. (1994). A school building reclad with
thermosyphoning air panels. Solar Energy. Vol. 52, No. 1, (January 1994), pp. (49-
58), ISSN 0038-092X
Loveday, D., L. & Craggs, C. (1992). Stochastic modelling of temperatures affecting the in
situ performance of a solar – assisted heat pump: the univariate approach. Solar
Energy. Vol. 49. No. 4, (October 1992), pp. (279-287), ISSN 0038-092X
Solar Collectors and Panels, Theory and Applications
404
Luminosu, I.; De Sabata, C. & De Sabata, A. (2010). Research in Solar Energy at the
"Politehnica" University of Timişoara". Thermal Science. Vol. 14, No. 1 , (January
2010), pp. (157-169), ISSN 0354-9836.
Luminosu, I. (2007a). Thermal Phenomena and Applications of Thermal Solar Conversion.
"Politehnica" Pub., ISBN 978-973-625-423-9, Timişoara (in Romanian).
Luminosu, I.; De Sabata, C. & But, A. (2007b). Solar equipment for preheating bitumen.
Thermal Science. Vol. 11, No. 1, (January 2007), pp. (127-136), ISSN 0354-9836.
Luminosu, I. (2003a). Experimental studies and economic considerations on a living space
heated through a passive solar gain and through electric power. Thermal Science.
Vol. 7, No. 1, (January 2003), pp. (47-61), ISSN 0354-9836.
Luminosu, I. (1993). Raising of plane solar collectors efficiencies by study of physical
phenomena that occur in thermal conversion. PhD Thesis, "Politehnica" University
of Timişoara, 1993.
Luminosu., I. (1983). Study upon temperature performance of a flat plane solar collector in
view of obtaining technological hot air. Scientific Bulletin of the "Politehnica"
University of Timişoara, Trans. Math. - Phys. Vol. 28(42), No. 1, (May, 1983), pp. (79-
82), ISSN 1224-6069.
Mihalca, I.; Luminosu, I.; Ercuţa, A. & Damian, I. (1988). Thermal field in solar energy
heated bitumen mass. Scientific Bulletin of the "Politehnica" University of Timişoara,
Trans. Math. - Phys. Vol. 28(42), No. 1, (May, 1988), pp. (116-118), ISSN 1224-6069.
Ohanession, P. & Charteres, W. (1978). Thermal simulation of a passive solar house using a
Trombe Michelle wall structure. Solar Energy. Vol. 20, No. 3, (March 1978), pp.
(275-281), ISSN 0038-092X
Pedersen, P., D. (1993). Experience with a large solar DHW system in Denmark – The Nordic
Solar Heating Demonstration Project. Solar Energy. Vol. 50, No. 3, (March 1993), pp.
(259-266), ISSN 0038-092X
Rommel, M.; Kohl, M.; Graf, W.; Brucker, F. & Lustig, K. (1996), Development of flat-plate
collectors with selectively coated polymer. Proceedings of EuroSun '96, Book 1, pp.
330-335, ISBN n/a, Frieburg, October 1996, DGS Sonenenergie GmbH Pub.,
Frieburg.
Săvulescu, T., D. (1984). Ventilation and Heating Installations. "Ed. Tehnică" Pub., ISBN n/a,
Bucureşti (in Romanian).
Stahl, W.; Voss, K. & Goetzberger, A. (1994). The self-sufficient solar house in Frieburg. Solar
Energy, Vol. 52, No. 1, (January 1994), pp. (111-127), ISSN 0038-092X
Torres-Reyes, E.; Cervantes de Gortari, J., G.; Ibarra-Salazar, B., A. & Pico-Nunez, A. (2001).
A design method of flat-plate solar collectors based on minimum entropy
generation. Exergy Int. J., Vol. 1, No. 1, (January 2001), pp. (46-52), ISSN 1742-8297
19
Thermal Performance of Photovoltaic
Systems Integrated in Buildings
D. Bigot, F. Miranville, A. H. Fakra, I. Ingar, S. Guichard and H. Boyer
University of Reunion
France
1. Introduction
1.1 History of photovoltaic systems …
Photovoltaics is one of the leading chains of "sustainable development". Indeed, when one
observes the development programs of energy systems in the countries or nations that move
towards sustainable development, we find that the solar (and through it the production of
energy through photovoltaics) represents the main axis of development.
One might at first believe that knowledge of the photovoltaic effect is recent. In fact, we
must go back to 1839 with the French physicist Edmund Becquerel who first discovered the
photovoltaic effect. It was during the period between the second half of the 19th and the
Second World War (1945) that scientific knowledge related to solar phenomena were
mastered. Thus, in 1875, Werner von Siemens presented to the Academy of Sciences in
Berlin an article on the photovoltaic effect in semiconductors and it was Albert Einstein who
first was able to explain the photovoltaic principle, thereby won the Nobel Prize for Physics
in 1923.
After the Second World War, when the world gets in another war called "cold war" between
the East Block in the West Block, the simmering conflict reached its apogee in the arms race
and especially in the space conquest. The space industry is now rapidly finding new and
innovative solutions that would power satellites into space. This was a boon for the
photovoltaic sector and will help structure an industry.
Thus, in 1954, with the developed of a high efficiency photovoltaic cell for the time (6%) and
in 1958, the rise of the yield to 9% and above, VANGUARD, the first satellite equipped with
photovoltaic cells was sent to the space.
The oil shocks of the 1970s allowed the industry to begin its development in civilian
applications in 1973 with the construction of the first house powered by solar cells at the
University of Delaware. The next step was the construction of the first car equipped with a
photovoltaic energy, which in 1983 covered a distance of 4000 km in Australia.
Yet in 1980, while the industry is launched commercially, the following years have seen its
development focus mainly on rural electrification as well as some isolated houses for
professional use (refuges, measuring stations, etc.) and for many villages in developed
countries.
Since 1990, awareness of the phenomenon of global warming induced the development of
the concept of sustainable development, with effect of boosting the photovoltaic and allows
it to pass a critical level.