Woven Fabric Engineering Part 7 potx
Bạn đang xem bản rút gọn của tài liệu. Xem và tải ngay bản đầy đủ của tài liệu tại đây (2.41 MB, 30 trang )
Prediction of Fabric Tensile Strength by Modelling the Woven Fabric
165
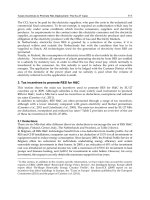
Fig. 4. Comparison of modelling methods
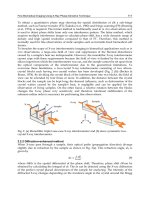
The final stage of the new modelling methodology is to make a verification of finding the
optimum fabric strength with GA-ANN hybrid modelling technique as the best
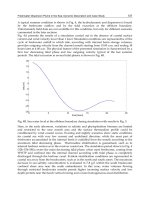
methodology. Warp density as the most important factor affecting the fabric strength is
found with the Taguchi Design of Experiment Methodology and whether there have been in
interval values of optimum parameter setting is tested by increasing from 33 to 38. The
verification of TDOE results with GA-ANN hybrid modelling technique for interval values
of warp density from 33 (warp/cm) to 38 (warp/cm) is shown in figure 5.
Verification of TDOE results with GA-ANN
1250
1300
1350
1400
1450
1500
1550
1600
1650
33 34 35 36 37 38
Warp Density
Fabric Strength
Variance of Warp
Density
Fig. 5. Interval values of warp density
4. Conclusion
In this study, traditional and computational modelling techniques are compared between
each other to predict woven fabric strength that is one of the main features for the
characterization of woven fabric quality and fabric performance. Compared the other
Woven Fabric Engineering
166
classical modelling techniques, computational modelling methodology seems to have been
more robust and appropriate. This study made in a textile Factory producing jacquard
woven bedding fabric in Turkey has many benefits for textile manufacturers to reduce waste
and scrap ratio before and during manufacturing. Firstly, production planning function in
the plant will be able to predict the woven fabric strength easily to be known optimal
parameter setting before manufacturing. Secondly, The significant parameter in the
manufacturing was found as Warp Density. Thirdly, after finding the optimum parameter
setting with TDOE, interval values of the sensitive parameters in the production was found
with ANN approach. According to the data collected from manufacturing Process of factory
in Zeydan’s paper (2008), Taguchi Design of Experiment methodology was applied to find
the most significant parameters. Seven significant parameters affecting the Woven Fabric
tensile strength was considered. Warp density was found the most important factor
affecting the Fabric strength by using S/N Ratio. The main purpose of this study is
modelling the woven fabric strength by comparing different modelling techniques.
However, any research about comparing ANN, TDOE, multiple regression and ANN-GA in
the literature hasn’t been conducted on the strength prediction of woven fabric from fibre,
yarn and fabric parameters using woven fabric modelling approaches with all together so
far. ANN, GA-ANN hybrid approach, Multiple-Linear regression, TDOE based on RMSE
and MAE modelling performance criteria which is frequently used, are compared with each
other. Finally, GA-ANN hybrid methodology was found as a suitable modelling technique.
At the last stage of modelling methodology, verification of TDOE results with GA-ANN
hybrid modelling technique for interval values of warp density was performed by
increasing from 33 (warp/cm) to 38 (warp/cm). Parameter value giving optimum fabric
strength for Warp Density was determined as 38 (warp/cm).
5. References
Behera, B.K. & Muttagi, S.B.(2004). Performance of Error Back Propagation vis-á-vis Radial
Basis Function Neural Network: Part I: Prediction of Properties for Design
Engineering of Woven Suiting Fabric. Journal of the Textile Institute, Vol. 95, No 1,
283-300
Behera, B. K.& Karthikeyan, B.(2006). Artificial Neural Network-embedded Expert System
for the Design of Canopy Fabrics.
Journal of Industrial Textiles, Vol. 36, No. 2, 111-123
Cheung, S.O.; Wong, P.S.P.; Fung, A.S.Y. & Coffey, W.V. (2006). Predicting project
performance through neural networks.
International Journal of Project Management,
Vol. 24, No. 3, 207–215
Co, H. C. (2008). Confirmation testing of the Taguchi methods by artificial neural-networks
simulation,
International Journal of Production Research, Vol. 46, No. 17, 4671 — 4685
Didier, C.; Forno, G.; Etcheverrigaray, M.; Kratje, R. & Goicoechea H. (2009). Novel
chemometric strategy based on the application of artificial neural networks to
crossed mixture design for the improvement of recombinant protein production in
continuous culture.
Analytica Chimica Acta , Vol. 650, 167–174
Geman, S.; Bienenstock, E. & Doursat, R. (1992). Neural networks and the bias/variance
dilemma.
Neural Computation, Vol.4, 1–58,
Gong, R.H. & Chen, Y. (1999).Predicting the Performance of Fabrics in Garment
Manufacturing with Artificial Neural Networks.
Textile Research Journal, Vol. 69,
No.7, 477-482
Prediction of Fabric Tensile Strength by Modelling the Woven Fabric
167
Hadizadeh, M.; Jeddi, Ali A.A. & Tehran, M. A. (2009). The Prediction of Initial Load-
extension Behavior of Woven Fabrics Using Artificial Neural Network. Textile
Research Journal
, Vol. 79, No. 17, 1599-1609
Haykin, S. (1994
). Neural networks-a comprehensive foundation. Macmillan College Publishing,
ISBN, New York
Heckerling, P. S.; Gerber, B. S.; Tape, T.G. & Wigton, R. S. (2004). Use of genetic algorithms
for neural networks to predict community-acquired pneumonia.
Artificial
Intelligence in Medicine
, Vol. 30, No. 1, 71-84
Hu, J. (2004).
Structure and Mechanics of Woven Fabrics, Woodhead Publishing Limited, 1
85573 904 6 Cambridge
Keshavaraj, R. ; Tock, R.W. & Haycook, D. (1996). Airbag fabric material modeling of nylon
and polyester fabrics using a very simple neural network architecture.
Journal of
Applied Polymer Science
, Vol. 60, No 13, 2329-38
Kim, G H.; Yoon, J E.; An, S H.; Cho, H H. & Kang, K I. (2004). Neural network model
incorporating a genetic algorithm in estimating construction costs,
Building and
Environment
, Vol.39, 1333–1340
Majumdar, A.; Ghosh, A.; Saha, S.S.; Roy, A.; Barman, S.; Panigrahi, D.& Biswas, A. (2008).
Empirical Modelling of Tensile Strength of Woven Fabrics.
Fibers and Polymers,
Vol.9, No.2, 240-245
Lin, H.L.; Chou, C.P.(2008). Modeling and optimization of Nd:YAG laser micro-weld
process using Taguchi Method and a neural network.
International Journal of
Advanced Manufacturing Technology, Vol. 37, 513–522
Liu, Z.; Liu, A.; Wang, C.& Niu, Z.(2004) Evolving neural network using real coded genetic
algorithm (GA) for multispectral image classification
. Future Generation Computer
Systems, Vol. 20, No. 7, 1119–1129
Lo, Y.L. & Tsao C.C. (2002). Integrated Taguchi Method and Neural Network Analysis of
Physical Profiling in the Wirebonding Process
, IEEE Transactions On Components
And Packaging
Technologies, Vol.25, No.2, 270-277
Mohebbi, A.; Taheri, M. & Soltani, A. (2008). A neural network for predicting saturated
liquid density using genetic algorithm for pure and mixed refrigerants,
International
Journal of Refrigeration,
Vol. 31, No. 8, 1317-1327
Noori, R. ; Khakpour A. ; Omidvar, B. ; Farokhnia, A. (2010). Comparison of ANN and
principal component analysis-multivariate linear regression models for predicting
the river flow based on developed discrepancy ratio statistic,
Expert Systems with
Applications, (article in press : doi:10.1016/j.eswa.2010.02.020)
Nunez-Letamendia, L. (2007). Fitting the control parameters of a genetic algorithm: An
application to technical trading systems design
. European Journal of Operational
Research
, Vol. 179, No. 3, 847-868
Ogulata, S.N. ; Sahin, C. ; Ogulata, T.O.& Balci, O. (2006), The prediction of elongation and
recovery of woven bi-stretch fabric using artificial neural network and linear
regression models,
Fibres & Textiles in Eastern Europe, Vol. 14, No. 2(56), 46-9
Park, S.W.; Hwang, Y.G.; Kang, B.C. & Yeo S.W. (2000). Applying Fuzzy Logic and Neural
Networks to Total Hand Evaluation of Knitted Fabrics
. Textile Research Journal, Vol.
70, No. 8, 675-681
Woven Fabric Engineering
168
Purwanto, D. ; Agustiawan, H. & Romlie, M.F.; (2008). The Taguchi-neural networks
approach to forecast electricity consumption. In: IEEE Canadian Conference on
Electrical and Computer Engineering
, pp.1941-1944, 4-7 May 200, Niagara Falls
Saemi, M.; Ahmadi, M. & Varjani, A.Y. (2007). Design of neural networks using genetic
algorithm for the permeability estimation of the reservoir.
Journal of Petroleum
Science and Engineering,
Vol. 59, 97– 105
Sanjari, M. & Taheri, A. K. & Movahedi, M. R. (2009). An optimization method for radial
forging process using ANN and Taguchi method.
The International Journal of
Advanced Manufacturing Technology,
Vol.40, No. 7-8, 776–784
She, F.H.; Kong, L.X.; Nahavandi, S. & Kouzani, A.Z.(2002). Intelligent Animal Fiber
Classification with Artificial Neural Networks
. Textile Research Journal, Vol. 72, No.
7, 594-600
Shopova, E.G.& Vaklieva-Bancheva, N.G.(2006). A genetic algorithm for engineering
problems solution, Comput.
Chem. Eng. Vol. 30, No.8, 1293–1309
Taheri, M. & Mohebbi, A. (2008). Design of artificial neural networks using a genetic
algorithm to predict collection efficiency in venturi scrubbers,
Journal of Hazardous
Materials, Vol. 157, 122–129
Tilocca, A.; Borzone, P.; Carosio, S. & Durante, A. (2002). Detecting Fabric Defects with a
Neural Network Using Two Kinds of Optical Patterns.
Textile Research Journal, Vol.
72, No.6, 545–551.
Torres, M.; Hervás, C. & Amador, F. (2005). Approximating the sheep milk production curve
through the use of artificial neural networks and genetic algorithms,
Computers &
Operations Research, Vol. 32, 2653–2670
Tu, J.V. (1996). Advantages and disadvantages of using artificial neural networks versus
logistic regression for predicting medical outcomes.
Journal of Clinical Epidemiology,
Vol. 49, No. 11, 1225–1231
Valverde Ramirez, M.C. & De Campos Velho, H.F. ; Ferreira, N.J. (2005). Artificial neural
network technique for rainfall forecasting applied to the São Paulo region,
Journal of
Hydrology, Vol. 301 (1-4), 146-162
Versace, M.; Bhat, R.; Hinds, O. & Shiffer M. (2010). Predicting the exchange traded fund
DIA with a combination of genetic algorithms and neural networks.
Expert Systems
with Applications (article in press)
Whitley, D.(1995); Genetic algorithms and neural networks, In: J. Perioux, G. Winter, M.
Galan and P. Cuesta (eds),
Genetic Algorithms in Engineering and Computer Science,
John Wiley & Sons Ltd.
Wu, S.J.; Shiah, S.W. & Yu W.L. (2009). Parametric analysis of proton exchange membrane
fuel cell performance by using the Taguchi method and a neural network.
Renewable Energy, Vol. 34, 135–144
Xu, S. & Chen, L.(2008) A Novel Approach for Determining the Optimal Number of Hidden
Layer Neurons for FNN’s and Its Application in Data Mining.
Proceedings of 5th
International Conference on Information Technology and Applications (ICITA 2008)
, Pp.
683-686, ISBN 978-0-9803267-2-, Cairns, Queensland, 23-26 June 2008, AUSTRALIA
Zeydan, M. (2008), Modelling the woven fabric strength using artificial neural network and
Taguchi methodologies,
International Journal of Clothing, Science and Technology, Vol.
20, No. 2, 104-118
9
Data Base System on the Fabric
Structural Design and Mechanical
Property of Woven Fabric
Seung Jin Kim and Hyun Ah Kim
Yeungnam University and Seoul National University
Korea
1. Introduction
The structure of fabrics is very important, because fabric geometry gives considerable effects
on their physical properties. Therefore, the studies for fabric structure have been carried out
with following areas:
1. prediction of fabric physical and mechanical properties
2. education and understanding related to the fabric structural design
3. the area related to the fabric and garment CAD systems
Among them, the researches for the prediction of fabric physical and mechanical properties
with fabric structure have been performed by many textile scientists. But the education and
understanding related to the fabric structural design have been emphasized on the
theoretical aspects. But the optimum fabric design plan is recently needed with the relevant
fabric shrinkage in dyeing and finishing processes for making the various emotional fabrics
for garment. For responding this need, the difference of fabric design plan such as fabric
density, yarn count and finishing shrinkage has to be surveyed with weaving looms such as
water jet, air-jet and rapier looms, and also has to be analyzed with weave patterns such as
plain, twill and satin. On the other hand, recently, there are many commercial CAD systems
such as fabric design CAD for fabric designers and pattern design CAD including visual
wearing system for garment designers. But there is no fabric structural design system for
weaving factories, so the data base system related to the fabric structural design for weaving
factories is needed. Many fabric weaving manufacturers have some issue points about fabric
structural design. The 1st issue point is that there is no tool about how to make fabric design
according to various textile materials such as new synthetic fibers, composite yarns, and
crossed woven fabrics made by these new fibres and yarns. As the 2nd issue point, they also
don’t have the data about what is the difference of fabric structural design such as fabric
densities on warp and weft directions according to the weaving looms such as WJL, RPL
and AJL. And 3rd issue point is that there is no data about how the difference of fabric
structural design is among weaving factories even though they have same looms and they
use same materials. Therefore, in this topic, a data base system which can easily decide warp
and weft fabric densities according to the various yarn counts, weave construction and
materials is surveyed by the analysis of design plan for synthetic fabrics such as nylon and
PET and worsted and cotton fabrics. Furthermore, the analyses for easy deciding of fabric
Woven Fabric Engineering
170
design from new materials and for making data base related to this fabric structural design
are carried out as the objectives of this topic.
2. Background of fabric structural design
The first study for the fabric structural design was started in 1937 by Peirce paper(Peirce,
1937), which is the Peirce’s model of plain-weave fabrics with circular yarn cross section.
And he also proposed fabric model with an elliptic yarn cross section. In 1958, Kemp
proposed a racetrack model(Kemp, 1958). Hearle and Shanahan proposed lenticular
geometry (Hearle & Shanahan, 1978) for calculation in fabric mechanics by energy method
in 1978. And many researches related to the fabric mechanical properties under the base of
fabric structural model were carried out by Grosberg (Grosberg & Kedia, 1966), Backer
(Backer, 1952) Postle(Postle et al., 1988). Lindberg(Lindberg et at., 1961) extensively studied
fabric mechanical behavior related to the tailorability. Then the sophisticated measurement
system of fabric mechanical properties was developed by Kawabata and Niwa(Kawabata et
al., 1982) which is called KES-FB system. Another fabric mechanical measurement system
called the FAST was developed by CSIRO in Australia(Ly et al., 1991). Recently new
objective measurement systems(Hu, 2004) such as Virtual Image Display System(VIDS) and
Fabric Surface Analysis System(FabricEye
®
) have been developed for the analysis of fabric
geometrical properties. On the other hand, nowadays there are many CAD systems(i-
Designer, Texpro) related to the fabrics design such as weave construction, color and
pattern. And also there is pattern design CAD(Texpro, Harada & Saito, 1986) including
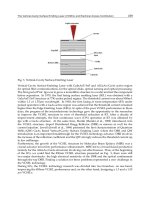
visual wearing system(VWS) for garment designer. But there is no fabric structural design
system related to the decision of the fabric density according to the fibre materials, yarn
linear density, and weave pattern. Therefore, a data base system which can easily decide
warp and weft densities according to the various yarn counts, weave constructions and
materials is required through the analysis of design plan for worsted, cotton, nylon and
polyester fabrics as shown in Figure 1(Kim, 2002).
Fig. 1. Diagram for need of fabric structural design system for weaving factory
Data Base System on the Fabric Structural
Design and Mechanical Property of Woven Fabric
171
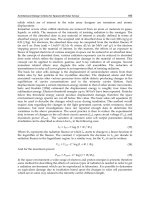
Figure 2 shows milestone of detail analysis steps related to the data-base system of the fabric
structural design in relation with existing fabric design and wearing systems of
garment(Kim, 2005). The final goal of this analysis is aiming to link with virtual wearing
system, pattern design CAD and drape analyzer. As shown in Figure 2, in the 1st step, the
data base of weave pattern and fabric factors has to be made using yarn count, fabric density
and weave pattern from which weave density coefficient (WC) and warp and weft density
distributions are calculated. And weave density coefficient can be analyzed according to
weaving factories and loom types. Furthermore, weave density coefficient and yarn density
coefficient (K) can be analyzed with cover factor of fabrics. In the 2nd step, the data base of
various physical properties of fabrics is made with dyeing and finishing process factors,
which affects fabric hand and garment properties measured by KES-FB and FAST systems.
In the 3rd step, these data bases have to be linked with visual wearing system (VWS),
pattern design CAD and drape analyzer. In this topic, the case study of data-base system of
the fabric structural design in the 1st step shown in Figure 2 is introduced and analyzed
with various kinds of fabric materials and structural factors.
Fig. 2. Detail milestone of analysis steps in relation with existing fabric design and wearing
systems of garment
3. Major issues of the mechanical property of the woven fabric related to the
fabric structural design
Many researches about mechanical property of the woven fabric according to the yarn and
fabric parameters were carried out using KE-FB and FAST systems (Oh & Kim,1993, 1994).
Among them, the PET synthetic fabric mechanical properties according to weft filament
yarn twists, yarn denier and fabric density were analysed and discussed with these yarn and
fabric structural parameters. On the other hand, the worsted fabric mechanical properties
according to the looms such as rapier and air jet were also analysed and discussed with
weaving machine characteristics (Kim & Kang, 2004, Kim & Jung, 2005). Similar studies
Woven Fabric Engineering
172
were also performed using the PET and PET/Tencel woven fabrics (Kim et al., 2004). The
researches related to the fabric mechanical property according to the dyeing and finishing
processes were also carried out (Kim et al., 1995, Oh et al., 1993). These are the discrete
research results such as 1st and 2nd step shown in Figure 2. There are no informations about
how these mechanical properties affect to the garment properties shown on step 3 in Figure
2. This is major issue point of the mechanical property of the woven fabric related to the
fabric structural design. Fortunately, in i-designer CAD system, visual weaving
performance is available by input the fabric mechanical properties measured by KES-FB
system. So, the data base in 1st and 2nd step shown in Figure 2 is needed and these data
bases have to be linked with existing visual wearing system, pattern design CAD and drape
analyzer shown on 3rd step in Figure 2.
4. Current trends of the data base system of the fabric structural design
4.1 Procedure of data base system of the fabric structural design
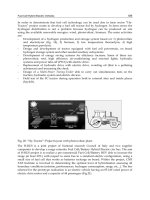
Figure 3 shows the procedure of data base system of the fabric structural design. In Figure 3,
yarn diameter is calculated using yarn count and weave factor is also calculated by weave
structure using number of interlacing point and number of yarn in one repeat weave
pattern. Then the weave density coefficient is decided using yarn diameter, weave factor
and warp and weft densities. And conversely the warp and weft density distribution is
made by yarn diameter, weave factor and weave density coefficient. Peirce(Peirce, 1937)
proposed equation 1 as a fabric cover factor which is recommended to weaving factories by
Picanol weaving machinery company(Picanol, 2005). In equation 1, yarn and fabric
correction factors are shown in Table 1 and 2, respectively.
Fig. 3. Procedure diagram of data base system of the fabric structural design
factorcorrectionfabricfactorcorrectionyarn
Ne
picks/in
Ne
ends/in
××+
⎟
⎠
⎞
⎜
⎝
⎛
(1)
Data Base System on the Fabric Structural
Design and Mechanical Property of Woven Fabric
173
Type of yarn Correction factor
metallic
glass
carbon
cotton, flax, jute, viscose, polyester
acetate, wool
polyamide
polypropylene
0.3
0.6
0.9
1.0
1.1
1.2
1.4
Table 1. Yarn correction factor
Drill/twill weave Satin weave
Pattern Peirce Pattern Peirce
2/1
3/1
2/2
4/1
5/1
6/1
7/1
4/4
0.819
0.769
0.746
0.763
0.714
0.694
0.689
0.671
1/4
1/5
1/6
1/7
1/8
0.709
0.662
0.629
0.599
0.578
Table 2. Fabric correction factor
On the other hand, Prof. M. Walz(Park et al., 2000) proposed equation 2 as a little different
equation form, but which is applicable to the various fabrics made by all kinds of textile
materials. In equation 2, yarn and fabric correction factors are also shown in Table 3 and 4,
respectively.
b×××+= DfDw
2
df)(dwC(%) (2)
,
, :
y
arn diameter(warp, weft)
100
wf
aadtex
where d
Nm
==
where
C(%): cover factor
Dw: warp density (ends/inch)
Df: weft density (picks/inch)
a: yarn correction factor (Table 3)
b: fabric correction factor (Table 4)
Basilio Bona (Park et al., 2000) in Italy proposed empirical equation 3 for deciding fabric
density on the worsted fabrics.
f
DK Nm C=× × (3)
where, D: fabric density (ends/m)
K: density coefficient
Nm: metric yarn count
C
f
: weave coefficient
Woven Fabric Engineering
174
Type of yarn Correction factor
metallic
glass
carbon
cotton, flax, jute, viscose
polyester
acetate, wool
polyamide
polypropylene
0.39
0.71
0.86
0.95
0.92
0.98
1.05
1.17
Table 3. Yarn correction factor
Drill/twill weave Satin weave
Pattern Walz Pattern Walz
2/1
3/1
2/2
4/1
5/1
6/1
7/1
4/4
0.69
0.58
0.56
0.49
0.43
0.41
0.40
0.39
1/4
1/5
1/6
1/7
1/8
0.50
0.45
0.42
0.39
0.38
Table 4. Fabric correction factor
f
C
c
fj
r
R
f
ff
RC
⎛⎞
=×××
⎜⎟
+
⎝⎠
f
c
: cover factor
f
f
: floating factor
f
j
: jumping factor
Equation 3 is modified as equation 4 for the cotton fabrics.
0.0254 1.694
cf
DK Ne C=× ×× × (4)
where, Ne: English cotton count
Kc: Yarn density coefficient (cotton)
where:
∙ Comber yarns : 425~350 (12 ~17 MICRONAIRE)
∙ Sea & Island cotton : 425, American cotton : 375
∙ Card yarns : 350~290 (14 ~22 MICRONAIRE)
But, in synthetic filament yarn fabrics such as nylon and polyester, more effective parameter
is needed. So, weave density coefficient, WC is made by equation 5.
2
25.4
dd
wf
WC D D WF
wf
+
⎡⎤
⎢⎥
=×××
⎢⎥
⎣⎦
(5)
where, d
w,f
: yarn diameter (warp, weft)
Data Base System on the Fabric Structural
Design and Mechanical Property of Woven Fabric
175
WF : weave factor
D
w
,
f
: warp, weft density
In equation 5, assuming that D
w
× D
f
is constant, it becomes as equation 6.
2
25.4
.
WC
DD const
wf
WF d d
wf
⎡⎤
⎢⎥
×= × =
⎢⎥
×
⎣⎦
(6)
WC in equation 5 can be converted to K and Kc in equation 3 and 4, conversely K is
converted to WC and also WC in equation 5 can be compared with cover factor, C given in
equation 1 and 2, which is shown in next case study.
4.2 Calculation of fabric structural parameters
In equation 6, d
w
and d
f
are calculated by yarn linear density, equation 7 as shown in Figure
4. WF is calculated by equation 8 as shown in Figure 5. In Figure 4, calculated yarn diameter
by equation 7 is shown in polyester, nylon and rayon yarns, respectively. As shown in
Figure 5, calculated weave factors by equation 8 are shown according to the various weave
patterns. For plain weave, weave factor (WF) is calculated as 1 using R=2 and Cr = 2. In a
little complicated weave pattern as a derivative weave, weave factor (WF) is calculated as
0.76 using R=4 and Cr=3 as an average value by two types of repeat pattern in the weft
direction. And in a very complicated weave pattern, Moss crepe, weave factor is calculated
as 0.538 using R=120 and Cr=56.06.
2
33 5
.( ) ( / ) ( ) 9 10
4
d
Den g g cm V cm
ff
π
ρρ
=×=×××
(7)
where, d: yarn diameter
ρ
f
: fibre density
Den: denier
V: volume
Fig. 4. Diagram between yarn count and diameter
2
2
R
C
r
WF
R
+
⎡
⎤
=
⎢
⎥
⎣
⎦
(8)
where, WF: weave factor
R: No. of yarn in 1 repeat
Cr: No. of point in interlacing
Woven Fabric Engineering
176
Fig. 5. Diagram of various weave constructions.
4.3 Case study of synthetic fabrics
Design plan sheets of polyester and nylon fabrics woven by various looms were selected as
a specimens from various weaving manufacturers such as A, B, C, D, E and F as shown in
Table 5, respectively, Table 5 shows the distribution of these specimens.
PET fabrics Nylon fabrics
A
company
B
company
C
company
D
company
E
company
Loom WJL RPL AJL+RPL WJL+RPL WJL+RPL
Sub
-total
F
company
Plain 26 4 14 46 5 95 516
Satin 10 41 20 4 8 83 24
Twill 60 28 33 4 9 134 113
Other - 25 51 - 32 108 185
Sub-total 96 98 118 54 54 420 838
Table 5. Distribution of specimens
For calculation weave density coefficient as shown in equation 5, yarn diameter is first
calculated using equation 7.
Data Base System on the Fabric Structural
Design and Mechanical Property of Woven Fabric
177
2
5
910
4
d
Den
f
π
ρ
=× ×× (9)
where, ρ
f
: fibre density (g/cm
3
)
d: yarn diameter (mm)
Den: yarn count (denier)
For polyester filament, yarn diameter, d is 0.01246
Den and for nylon filament, that is
0.01371
Den . On the other hand, weave factor, WF is also calculated using equation 8 and
R, Cr in the one repeat weave pattern of fabrics. Through this procedure, yarn diameter, d
and weave factor, WF are calculated for all the specimens of nylon and polyester fabrics.
Finally weave density coefficient, WC is calculated using d, WF and warp and weft fabric
densities, Dw and Df of the all the nylon and polyester fabrics. And WC is plotted against
various yarn counts using equation 5 and conversely warp and weft density distribution is
presented with various weave density coefficients and weave patterns using equation 6.
1. The distribution of weave density coefficient according to the looms
For four hundreds twenty polyester fabrics, the diameters of warp and weft yarns were
calculated using deniers by equation 7, and weave factor was calculated by one repeat
weave construction. The weave density coefficient was calculated using equation 5. Figure 6
shows the diagram between weave density coefficient and yarn count for the polyester
fabrics woven by water jet loom. And Figure 7 shows that for rapier loom. As shown in
Figure 6, the weave density coefficients of PET fabrics woven by WJL were widely ranged
from 0.2 to 1.8, on the other hand, for rapier loom, was ranged from 0.4 to 1.4 as shown in
Figure 7. And in Figure 6, the values for satin fabrics were ranged from 0.6 to 1.0, which
were lower than those of the plain and twill fabrics. Around the yarn count 150d, 300d and
0.0
0.2
0.4
0.6
0.8
1.0
1.2
1.4
1.6
1.8
0 100 200 300 400 500 600 700 800
Yarn count (w
p
+w
f
denier)
Weave density coefficient
40
20
19
16
4
89
79
77
21
88
86
65
64
49
1
82
4654
56
97
57
91
71
58
55
38
34
90
51
50
96
92
99
95
93
83
73
72
70
69
62
61
59
53
48
35
33
98
81
84
74
52
76
60
11
10
9
3
39
7
6
41
45
30
8
36
15
31
18
12
42
24
78
87
68
44
32
22
66
29
23
47
Twill
Plain
Satin
Fig. 6. The diagram between weave density coefficient and yarn count for PET fabrics (WJL).
( : Plain, : Twill, : Satin)
Woven Fabric Engineering
178
0.0
0.2
0.4
0.6
0.8
1.0
1.2
1.4
1.6
1.8
2.0
0 100 200 300 400 500 600 700
Yarn count (wp+wf denier)
Weave density coefficient
3
4
1
7, 8
10
Satin span
Plain
Twill span
5
11
16
15,18
19
28
53
26,29,30,31
51
45
22
13
14
61
74
47
46
72
73
32
62
71
35
52
49
9
34 65
25
12
24
70
63
58
43,68
69
60
33,36,37,38,39,40,41,42
23
64
Others
Fig. 7. The diagram between weave density coefficient and yarn count for PET fabrics (RPL).
( : Plain, : Twill, : Satin, : Others)
400d for the twill fabrics, it is shown that the weave density coefficients are ranged from 0.4
to 1.0 for 150d, ranged from 0.5 to 1.7 for 300d and also from 0.6 to 1.3 for 400d. This
demonstrates that the weave density coefficients of fabrics woven by water jet loom were
widely distributed according to the end use of fabrics for garment.
2. The comparison of the weave density coefficient between polyester and nylon fabrics
Figure 8 shows the diagram between weave density coefficient and yarn count for polyester
and nylon fabrics woven by water jet loom for the specimens of higher weft yarn count than
warp. As shown in Figure 8, the weave density coefficient of nylon fabrics are widely
ranged from 0.5 to 3.0, and comparing to polyester fabrics, the weave density coefficients of
nylon fabrics are higher than those of PET fabrics. Especially, in polyester fabrics, plain, twill
and satin weave patterns were widely divided to each other on weave density coefficient
and yarn count, on the other hand, in nylon fabrics, it was shown that plain was most
popular and many specimens were concentrated around yarn count 200d region. Figure 9
shows the weave density coefficients of polyester and nylon fabrics according to the
weaving looms. As shown in Figure 9 (a), (b) and (c), the weave density coefficients of
polyester fabrics woven by water jet loom were ranged from 0.4 to 1.5, those woven by air
jet loom are ranged from 0.7 to 2.0 and woven by rapier loom was ranged from 0.5 to 2.8.
And yarn count also showed wide distribution in water jet and rapier looms, but air jet loom
showed a little narrow distribution. This phenomena demonstrate that the versatility of
rapier loom was the highest comparing to the other weaving looms. On the other hand,
comparing Figure 9 (a) with Figure 9 (d), the weave density coefficients of nylon fabrics
were ranged from 0.5 to 3.0, while in polyester fabrics they were ranged from 0.4 to 1.5.
Nylon fabric showed much wider distribution and much larger values of the weave density
coefficient.
Data Base System on the Fabric Structural
Design and Mechanical Property of Woven Fabric
179
0.0
0.5
1.0
1.5
2.0
2.5
3.0
3.5
4.0
0 200 400 600 800 1000
Yarn count(W
p
+ W
f
, denier)
Weave density coefficient
Plain
Satin
Other weaves
Twill
0.0
0.5
1.0
1.5
2.0
2.5
3.0
3.5
4.0
0 200 400 600 800 1000
Yarn count(W
p
+ W
f
, denier)
Weave density coefficient
Plain
Satin
Twill
Other weaves
Fig. 8. Comparison of weave density coefficient between PET and Nylon fabrics (Wp<Wf).
( : Plain, : Twill, : Satin, : Others)
PET
0.0
0.5
1.0
1.5
2.0
2.5
3.0
3.5
4.0
0 100 200 300 400 500 600 700 800
Yarn count(Wp + Wf, denier)
Weave density coefficient
Plain
Satin
Twill
0.0
0.5
1.0
1.5
2.0
2.5
3.0
3.5
4.0
0 100 200 300 400 500 600 700 800
Yarn count(Wp + Wf, denier)
Weave density coefficient
Plain
Satin
Twill
(a) WJL (b) AJL
0.0
0.5
1.0
1.5
2.0
2.5
3.0
3.5
4.0
0 100 200 300 400 500 600 700 800
Yarn count(Wp + Wf, denier)
Weave density coefficient
Plain
Other weaves
Satin
Twill
(c) RPL
Nylon
0.0
0.5
1.0
1.5
2.0
2.5
3.0
3.5
4.0
0 100 200 300 400 500 600 700 800
Yarn count(Wp + Wf, denier)
Weave density coefficient
Twill
Satin
Plain
Other weaves
(d) WJL
Fig. 9. The weave density coefficients of polyester and nylon fabrics according to the
weaving looms. ( : Plain, : Twill, : Satin, : Others)
Woven Fabric Engineering
180
3. The density distribution
Figure 10 shows fabric density distribution calculated and simulated by equation 6 for
polyester and nylon fabrics with 2 kinds of yarn counts. Figure 10 (a) shows warp and weft
density distributions of polyester fabrics with various weave density coefficients and
various weave patterns with warp and weft yarn counts 150 deniers. As shown in this
Figure 10 (a), specimen no. 21 and 29, satin crepe fabrics, have almost same weft density of
fabrics, but warp density of fabrics were different according to the end use of fabric for
garment. And as shown in Figure 10 (b), many specimens of plain fabrics have same weave
density coefficient, but it was shown that warp and weft densities were different one
another according to the end use of fabric for garment. Then it was shown that it was very
convenient to decide warp and weft fabric densities for good hand of fabrics.
(a) PET (b) Nylon
Fig. 10. The diagram between fabric density of PET and Nylon fabrics
4. Comparison between weave density coefficient and cover factor
Figure 11 shows the diagram of weave density coefficient (WC), cover factors by Picanol and
Prof. Walz which are calculated by equation 5, equation 1 and equation 2 using the
specimens shown in Table 5, respectively. As shown in Figure 11(a), weave density
coefficients of PET plain fabrics are widely ranged from 0.5 to 3.0. On the other hand, stain
fabrics are distributed from 0.5 to 1.5, and for twill fabrics, ranged from 0.3 to 2.0. This
phenomena demonstrate that plain fabrics show broad and wide distribution of weave
pattern, and satin shows narrow distribution, which means the versatility of plain weave
pattern. And also it is shown that 90% of all specimens’ weave density coefficient is ranged
from 0.5 to 1.5, which shows similar distribution to cover factor shown in Figure 11(b),
proposed by Prof. Walz as equation 2. On the other hand, cover factors proposed by Picanol,
which are calculated by equation 1, are distributed from 25% to 90% as shown in Figure
11(c). It is shown that Picanol’s cover factor is much lower than those of WC and Prof. Walz
equations, And comparing between WC and Prof. Walz equation, WC is about 30% higher
than that of Prof. Walz equation. The reason seems to be due to the yarn correction factor ‘a’
and fabric weave correction factor ‘b’ in equation 2.
Figure 12 shows the same diagram for nylon fabrics. As shown in Figure 12(a), the weave
density coefficients of all Nylon fabric specimens are distributed from 0.5 to 4.0 which are
much wider than those of PET fabrics comparing with Figure 11(a). It is shown that weave
Data Base System on the Fabric Structural
Design and Mechanical Property of Woven Fabric
181
0.0
0.5
1.0
1.5
2.0
2.5
3.0
3.5
4.0
4.5
0 200 400 600 800 1000 1200
Plain Satin Twill
Yarn count(Wp + Wf, denier)
Weave densit
y
coefficient
0
50
100
150
200
250
300
0 200 400 600 800 1000 1200
Plain Satin Twill
Yarn count(Wp + Wf, denier)
Cover factor(%)
(a) Weave density coefficient (b) Cover factor by Prof. Walz
0
50
100
150
200
250
300
0 200 400 600 800 1000 1200
Plain Satin Twill
Yarn count(Wp + Wf, denier)
Cover factor(%)
(c) Cover factor by Picanol
Fig. 11. Comparison among WC, cover factors of Picanol and Prof. Walz for PET fabrics
density coefficients of plain fabrics are widely distributed from 0.5 to 4.0. On the other hand,
the weave density coefficients of twill and satin fabrics are ranged from 0.5 to 1.5, which is
much lower and narrower than that of plain. As shown in Figure 12(b), cover factors by
Prof. Walz are distributed from 50% to 200% which shows lower distribution than that of
weave density coefficient as shown in Figure 12(a). It is shown that cover factor values by
Picanol equation shown in equation 1 are distributed from 30% to 100% which is much
lower than those of WC and Prof. Walz equations. And comparing between PET and nylon
fabrics as shown in Figure 11(b) and Figure 12(b), in nylon fabrics, cover factors of satin and
twill are distributed from 50% to 100%, but plain is widely distributed from 30% to 200% as
shown in Figure 12(b). In PET fabrics shown in Figure 11(b), cover factors of all weave
patterns such as plain, twill and satin are widely distributed from 30% to 150%. This
phenomena demonstrate that plain weave patterns of nylon have higher density than those
of satin and twill weave patterns, in one hand, the density of all weave patterns such as
plain, twill and satin in the PET fabrics has almost same level. The cover factors of the nylon
fabrics proposed by Picanol which are shown in Figure 12(c) ranged from 30% to 100% are
much higher than those of PET fabrics which are shown in Figure 11(c).
Figure 13 shows density coefficient, K of the polyester and nylon fabrics calculated by
equation 3. As shown in Figure 13, the density coefficient, K is distributed between 400 and
1600 both polyester and nylon fabrics. Mario Bona (Park et al., 2000) in Italy is
recommending this value as 800 for synthetic fabrics. Comparing to this recommended
value, both polyester and nylon fabrics show much higher values than recommended value,
Woven Fabric Engineering
182
0.0
0.5
1.0
1.5
2.0
2.5
3.0
3.5
4.0
4.5
0 200 400 600 800 1000 1200
PLAIN SATIN TWILL
Yarn count(Wp + Wf, denier)
Weave densit
y
coefficient
0
50
100
150
200
250
300
0 200 400 600 800 1000 1200
PLAIN SATIN TWILL
Yarn count(Wp + Wf, denier)
Cover factor
(
%
)
(a) Weave density coefficient (b) Cover factor by Prof. Walz
0
50
100
150
200
250
300
0 200 400 600 800 1000 1200
PLAIN SATIN TWILL
Yarn count(Wp + Wf, denier)
Cover factor
(
%
)
(c) Cover factor by Picanol
Fig. 12. Comparison among WC, cover factors of Picanol and Prof. Walz for nylon fabrics
800. As well known to us, the equation 3 proposed By M. Bona is based on density
calculation of the worsted fabrics. Applying to synthetic fabrics as shown in Figure 13, the
density coefficient distribution of the PET fabrics is mainly ranged between 600 and 1000
and for nylon fabrics, which is much more concentrated at this region. This results
demonstrate the validity of the recommended value, 800 by M. Bona.
0
200
400
600
800
1000
1200
1400
1600
1800
0 200 400 600 800 1000 1200
Yarn count (Wp+Wf, denier)
Density coefficient(Wp+Wf)
plain
satin
twill
Others
0
200
400
600
800
1000
1200
1400
1600
1800
0 200 400 600 800 1000 1200
Yarn count (Wp+Wf, denier)
Density coefficient(Wp+Wf)
plain
satin
twill
Others
(a) PET (b) Nylon
Fig. 13. Diagram of K against yarn count of polyester and nylon fabrics
4.4 Case study of worsted and cotton fabrics
Various fabrics woven by worsted and cotton staple yarns were selected as specimens,
respectively. Table 6 shows these specimens. For the worsted fabrics of one hundred
Data Base System on the Fabric Structural
Design and Mechanical Property of Woven Fabric
183
thirteen, density coefficient, K was calculated using equation 3. For the cotton fabrics of four
hundreds seventy nine, density coefficient Kc was calculated using equation 4.
Worsted fabrics Cotton fabric
Materials & Loom
Weave pattern
Sulzer Air-jet
Plain
Twill
Others
35
48
30
243
156
80
Total 113 479
Table 6. Specimens of worsted and cotton fabrics
Figure 14 shows the diagram between density coefficient and yarn count for worsted and
cotton fabrics. It is shown that the density coefficient, K of worsted fabrics is ranged from
600 to 1000, for cotton fabrics, almost same distribution is shown. Comparing to synthetic
fabrics such as polyester and nylon in which were ranged from 400 to 1600, as shown in
Figure 14, natural fabrics such as worsted and cotton show lower values. Figure 15 shows
weave density coefficients, WC calculated by equation 5, of worsted and cotton fabrics. As
shown in Figure 15(a), the weave density coefficients of worsted fabrics are ranged from 0.4
to 0.8, for cotton fabrics, they are ranged from 0.2 to 1.0. Comparing to synthetic fabrics,
which were shown in Figure 11(a) and 12(a) and ranged from 0.5 to 3.0, WC of the worsted
and cotton fabrics show much lower values as below 1.0. Figure 16 shows weave density
coefficient WC calculated by equation 5 and cover factors, calculated by equation 1 and 2 for
worsted fabrics. As shown in Figure 16(a), weave density coefficients of worsted fabrics
show the values below 1.0, and cover factors also show below 100%, especially the cover
factor by Picanol shows lower values than Prof. Walz as below 50%. These values are much
lower than those of synthetic fabrics shown in Figure 11(a) and 12(a). Figure 17 shows the
diagram for cotton fabrics. The same phenomena are shown as worsted fabrics.
0
200
400
600
800
1000
1200
0 20406080100120140
Yarn count(Wp+Wf, Nm)
Density coefficient(Wp+Wf)
Plain
Twill
Others
0
200
400
600
800
1000
1200
0 20 40 60 80 100 120 140
Yarn count(Wp+Wf, Ne)
Density coefficient(Wp+Wf)
Plain Oxford Twill
(a) Worsted (b) Cotton
Fig. 14. Diagram between density coefficients and yarn counts for worsted and cotton fabrics
4.5 Relationship between weave density coefficient and shrinkage of dyeing and
finishing processes
Figure 18 shows relationship between weave density coefficient and finishing shrinkage in
dyeing and finishing processes of PET fabrics woven in the weaving company as shown in
Table 5. The finishing shrinkages are distributed from 2% to 40% as shown in Figure 18. It is
Woven Fabric Engineering
184
0.0
0.2
0.4
0.6
0.8
1.0
1.2
1.4
0 20406080100120140
Yarn count (wp+wf Nm - All DATA)
Weave density coefficient
Plain
Others
Twill
0.0
0.2
0.4
0.6
0.8
1.0
1.2
1.4
0 20406080100120140
Yarn count (wp+wf Ne - All DATA)
Weave density coefficient
Plain Oxford Twill
(a) Worsted (b) Cotton
Fig. 15. Diagram of weave density coefficients of worsted and cotton fabrics
0.0
0.3
0.6
0.9
1.2
1.5
0 200 400 600 800 1000 1200 1400 1600
Yarn count (wp+wf, denier)
Weave density coefficient
Plain Twill Others
0
30
60
90
120
150
0 200 400 600 800 1000 1200 1400 1600
Yarn count(Wp + Wf, denier)
Cover factor(%)
Plain Twill Others
(a) Weave density coefficient (b) Cover factor by Prof. Walz
0
30
60
90
120
150
0 200 400 600 800 1000 1200 1400 1600
Yarn count(Wp + Wf, denier)
Cover factor(%)
Plain Twill Others
(c) Cover factor by Picanol
Fig. 16. Diagram of weave density coefficients and cover factors for the worsted fabrics.
shown that finishing shrinkage varies according to the weave pattern such as plain, twill
and satin. The shrinkages of plain fabric are ranged from 5% to 20%, for twill fabrics, three
types of shrinkages levels are divided, one group is below 8%, 2nd group is ranged from
12% to 20%, 3rd group is ranged from 25% to 40%. The finishing shrinkages of the satin
weaves are ranged from 12% to 23%(Kim et al., 2005). Figure 19 shows finishing shrinkages
distributions from data-base of polyester plain fabrics manufactured by each company
fabrics manufactured in A company is ranged from 5% to 20% and for C company, it is
shown in the Table 5. As shown in Figure 19, the distribution of finishing shrinkage of PET
Data Base System on the Fabric Structural
Design and Mechanical Property of Woven Fabric
185
0.0
0.3
0.6
0.9
1.2
1.5
0 500 1000 1500 2000 2500
Yarn count (wp+wf, denier)
Weave density coefficient
PLAIN TWILL OXFORD
0
30
60
90
120
150
0 500 1000 1500 2000 2500
Yarn count(Wp + Wf, denier)
Cover factor(%)
PLAIN TWILL OXFORD
(a) Weave density coefficient (b) Cover factor by Prof. Walz
0
30
60
90
120
150
0 500 1000 1500 2000 2500
Yarn count(Wp + Wf, denier)
Cover factor(%)
PLAIN TWILL OXFORD
(c) Cover factor by Picanol
Fig. 17. Comparison among WC cover factors by Picanol and Prof. Walz for cotton fabrics
0
5
10
15
20
25
30
35
40
0.0 0.2 0.4 0.6 0.8 1.0 1.2 1.4 1.6 1.8 2.0
Weave density coefficient
Finishing shrinkage(%)
plain
satin
twill
Plain
Satin
Twill
Fig. 18. Diagram between weave density coefficient and fabric shrinkage of PET fabrics
woven in A company
ranged from 10% to 25%. This result gives us important information for fabric quality by
getting finishing shrinkage according to the fabric manufacturers and weave density
coefficients. Figure 20 shows weave shrinkages distributions of nylon fabrics manufactured
by F company shown in Table 5. As shown in Figure 20, the weave shrinkages of nylon
fabrics vary with weave patterns such as plain, satin and twill, which weave shrinkage
Woven Fabric Engineering
186
values are shown as 7%, 8% and 10%. Figure 21 shows weave and finishing shrinkages of
worsted fabrics shown in Table 6. As shown in Figure 21, the weave and finishing
shrinkages of worsted fabrics are also distributed with weave patterns such as plain and
twill, which are ranged from 2% to 10%.
Fig. 19. Diagram between weave density coefficient and finishing shrinkage of PET fabrics
woven by each company.
0.0
0.5
1.0
1.5
2.0
2.5
3.0
3.5
4.0
4.5
024681012
Other weaves
PLAIN
SATIN
TWILL
Weave shrinkage (%)
Weave densit
y
coefficient
Fig. 20. Relationship between weave shrinkage and WC.
0
5
10
15
20
25
30
35
40
0 20 40 60 80 100 120
Yarn count (Wp+Wf, Nm)
Shrinkage (%)
PLAIN(F.S.)
TWILL(F.S.)
Other weaves(F.S.)
PLAIN(W.S.)
TWILL(W.S)
Other weaves(W.S)
TWILL
PLAIN
SAXONY
Fig. 21. Weave and finishing shrinkages according to the yarn count (F.S. : finishing
shrinkage, W.S. : weave shrinkage)
Data Base System on the Fabric Structural
Design and Mechanical Property of Woven Fabric
187
Figure 22 shows finishing and weave shrinkages of cotton fabrics shown in Table 6. As
shown in Figure 22, finishing shrinkages of cotton fabrics are distributed from 2% to 20%, on
the one hand, weave shrinkages are ranged from 1% to 10%. It is shown that these
shrinkages vary with weave patterns.
0
5
10
15
20
25
30
35
40
500 600 700 800 900 1000 1100 1200
Density coefficient(Wp+Wf-All DATA)
Finishing shrinkage(%)
Plain
Oxford
Twill
Oxford
Twill
Plain
(a) Finishing shrinkage
0
5
10
15
20
25
30
35
40
500 600 700 800 900 1000 1100 1200
Density coefficient(Wp+Wf-All DATA)
Weave shrinkage(%)
Plain
Oxford
Twill
Oxford
Twill
Plain
(b) Weave shrinkage
Fig. 22. Diagram between density coefficient and shrinkage of cotton fabrics
5. Future challenges of the data base system for the fabric structural design
Even though a lot of commercial CAD systems(i-Designer, Texpro) for both fabric and
pattern have been introduced, any system for weaving factories has not been developed.
Therefore, a data base system related to the fabric structural design for weaving factory is
needed to be explored. The yarn count, weave pattern and fabric density of 420 polyester
fabrics and 838 nylon fabrics shown in Table 1 were used for making data base system,
which were divided by weave patterns, weaving looms and weaving manufacturers. The
reason why makes data base system according to the weaving manufacturers is explained as
for examining the difference of fabric design according to each weaving factory. Figure 23
shows the diagram from data base between weave density coefficient and yarn count
according to the weaving manufacturers. As shown in Figure 23, weave density coefficient
is easily found according to the weaving manufacturers. It is shown that the distribution of
Woven Fabric Engineering
188
weave density coefficients of PET fabrics manufactured in A company by water jet loom
(WJL) is ranged from 0.2 to 1.8 according to the yarn linear density distributed between 100
and 800 denier. For the PET fabrics manufactured in C company by air-jet loom (AJL) and
rapier loom (RPL), it is distributed between 0.6 and 2.4 according to the yarn linear density
distributed between 100 and 850 denier. On the other hand, the weave density coefficients
for the B, D and E fabric manufacturers are differently distributed with narrow distribution
of the yarn linear density. This result from data base related to the fabric structural design
gives us important information for the weave density coefficients according to the yarn
denier and fabric manufacturers. Figure 24 shows the diagram from data base between
weave density coefficient and yarn count according to the looms. It is shown that the
distribution of weave density coefficients and yarn denier of PET fabrics woven by rapier
Fig. 23. Data base diagram between weave density coefficient and yarn count according to
the weaving company. (PET)
Fig. 24. Data base diagram between weave density coefficient and yarn count according to
the looms. (PET)
Data Base System on the Fabric Structural
Design and Mechanical Property of Woven Fabric
189
loom is the widest and air-jet loom is the narrowest. Figure 25 shows the diagram from data
base between weave density coefficient and yarn count according to the weave pattern of
each weaving manufacturers. It is shown that the distribution of weave density coefficient of
twill fabrics of the A company is ranged from 0.3 to 1.6, and for plain weave pattern, it is
ranged from 0.6 to 1.6, and the distribution of the satin is very narrow. These phenomena as
shown in B, C, D and E company are differently distributed according to the weave pattern.
Figure 26 shows the diagram of shrinkage of polyester fabrics according to the weaving
companies (A, B, C, D and E) and weave patterns (plain, twill and satin) from data base.
This result from data base related to the weave density coefficient gives us important
information for the finishing shrinkage according to the fabric manufacturers and weave
pattern.
(a) A company
(b) B company