Hydrodynamics Natural Water Bodies Part 7 potx
Bạn đang xem bản rút gọn của tài liệu. Xem và tải ngay bản đầy đủ của tài liệu tại đây (2.32 MB, 25 trang )
137
Freshwater Dispersion Plume in the Sea: Dynamic Description and Case Study
A typical summer condition is shown in Fig. 4, the hydrodynamic and dispersion is forced
by the freshwater outflow and by the tidal excursion at the offshore boundary.
Unfortunately field data are not available for this condition, but only for different scenarios
commented in the later sections.
Fig. 4A presents the results of a simulation carried out in the absence of coastal surface
current and wind velocity lower than 1 knot. Simulation conditions are representative of the
cycle of freshwater outfall in which tide, according with internal basin storage volumes,
provides outgoing velocity from the channel mouth starting from 10.00 a.m. and ending 18
hours later at 4.00 a.m. The physical feature of the presented simulation is characterized by a
first low decreasing tidal phase and low outgoing velocity typical of the last summer
periods. The tidal excursion at several tidal phases is shown in Fig. 4B.
20
15
10
swl [cm]
5
0
-5
-10
-15
-20
-25
0
5
10
time [hours]
15
20
25
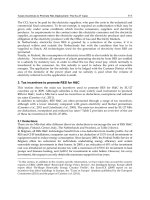
Fig. 4B. Sea water level at the offshore boundary during simulation with results in Fig. 3.
Here, in the early afternoon, variations in salinity and phytoplankton biomass are limited
and restricted to the near mouth area and the surface thermoaline profile could be
conditioned by wind coastal waves. Evening and nightly scenarios show static conditions
for coastal sea with very low current and undefined direction, while the most part of
freshwater accumulated in the internal basin is outfalled from the mouth according to the
maximum tidal decreasing phase. Thermoaline stratification is guaranteed, such as in
internal harbour section as in the receiver coastal sea. The simulation period shown in Fig. 4
(12h-15h-18h) covers the main decreasing tidal phase, when most freshwater, coming from
WWTP and confined into the internal channel according with tidal phase, is completely
discharged through the harbour canal. Evident stratification conditions are represented in
coastal sea away from the breakwaters, such as in the north and south zones. The maximum
decrease in sea salinity concentrations is evaluated in 7-8 g/l within the south breakwater
confined shore area near the south embankment. In this zone, water volumes flowing
through restricted breakwater mouths permit higher incoming surface velocity and low
depth permits near the beach vertical mixing and a more homogeneous areal distribution.
138
Hydrodynamics – Natural Water Bodies
The results also reveal different effects on plume areal dispersion and on thermoaline
profiles between zones confined by continuous breakwaters (north shore) and by
discontinuous breakwater (south shore). Comparing salinity vertical distribution in internal
and external points of the north continue breakwaters, under a surface layer (50-60 cm)
almost corresponding to breakwater submergence (Lamberti et al., 2005), differences in
salinity and oxygen profiles become significant. Freshwater dispersion appears obstructed
in the internal north confined area because continuous breakwaters produce a “wall effect”
for incoming plume with mass exchange reduced for deep layers. Here, in the absence of
north directed sea currents, flows are allowed only from north-south boundary mouths with
vertical mixing limited to the surface layer.
5. Validation of model results with in situ measurement campaigns
In 2009 several field campaigns took place in order to observe the hydrodynamics at the
outfall, to measure the velocities of the flow and the water quality parameters in order to
validate the model. The measurements were performed with the support of a Bellingardo
550 motorboat utilizing a Geo-nav 6sun GPS system, a Navman 4431 ultrasonic transducer
and an YSI556 multi-parameter probe. Morphologic, hydraulic and water quality
measurements were executed into the transition estuary of the harbour canal and near the
mouth. The dispersion area and profile distribution of freshwater outgoing from the
harbour mouth and discharged in the coastal area was investigated and monitored.
Experiments were carried out on June 2009 and September 2009. The surface currents were
observed with the aim of drifters properly designed to follow the surface pollution and oil
(Archetti, 2009). The drifters (Fig. 5) were equipped with a GPS to acquire the geographical
position every 5 minutes and an IRIDIUM satellite system was used to send data to a server.
Simultaneously, tide, waves, wind and rainfall conditions were collected.
.
Fig. 5. Lagrangian drifter in the sea during the experiment.
5.1 Experiment I: June 18, 2009.
The first experiment was carried out on June 18, 2009. The wave conditions were measured
by the wave buoy located 5 nautical miles off the shore of Cesenatico (details on the wave
position and data are available at The significant
Freshwater Dispersion Plume in the Sea: Dynamic Description and Case Study
139
wave height HS was lower than 0.3 m for the whole day. The measured sea water level and
wave conditions on the day of the experiment are plotted in Fig. 6A. The weather conditions
were very mild, without wind and with ascending tide, so we had the opportunity to
monitor a condition driven only by the tidal excursion. Figure 6B shows the swl during the
experiment and the contemporary velocity and direction of the drifters launched 1 km
offshore from the Cesenatico harbour canal.
A
B
Fig. 6. A) Measured swl (top panel), significant wave height (HS), direction and period (TP).
B), drifters' velocity (top panel), direction (central panel) and contemporary swl (bottom
panel).
Clusters of three drifters were launched simultaneously at the offshore boundary. The
launch position of the drifters is the offshore location in Fig. 7A. The first cluster was
launched at about 9:00 a.m. just offshore from the harbour breakwaters, at a distance of 1.2
km from the beach, the second cluster was launched one hour later offshore from the
northern beach and the last cluster was launched at 11:00 am offshore from the southern
beach. The velocity and direction of the drifters during the experiment is plotted in Fig. 6B.
The mean drifter velocity during the experiments was 0.18 m/s, with a direction
perpendicular to the beach.
140
Hydrodynamics – Natural Water Bodies
A
200
400
600
800
[m]
1000
1200
1400
1600
1800
2000
200
400
600
800
1000
1200
1400
1600
[m]
B
Fig. 7. A) Satellite view of the study area and pattern of two drifters launched on June 18,
2009. B). Field for experiment I of surface currents.
The observed condition was simulated by the model; the hydrodynamic was driven only by
sea water tidal oscillation at the offshore boundary condition (condition in Fig. 6A ). The
resulting surface current field during the experiment condition is shown in Fig. 7B, the
current is perpendicular to the shoreline.
The field velocity appears comparable to the drifters’ paths, both in direction and
magnitude, so the model looks well calibrated.
5.2 Experiment II September 1, 2009
During the experiment carried out on September 1, 2009, the drifters were launched in the
water in a plume of sewage water disposal from the canal of Cesenatico harbour. Two
drifters were deployed in the plume centre and two at the plume front. The two drifters
deployed at the plume front followed the plume front evolution during the experiment
lasting 4 hours. Wind speed was approx. 30 m/s, significant wave height 0.5 m (Fig. 8A) and
the tide descending. The plume and the drifters moved in the wind direction at an average
speed of 0.2 m/s (Fig. 8B).
Freshwater Dispersion Plume in the Sea: Dynamic Description and Case Study
141
A
B
Fig. 8. A) Measured swl (top panel), significant wave height (HS), direction and period (TP).
B) Drifters’ velocity (top panel), direction (central panel) and contemporary swl (bottom
panel).
A
142
Hydrodynamics – Natural Water Bodies
B
Fig. 9. A) Satellite view of the study area and pattern of three drifters launched on
September 1, 2009. B). Surface currents’ field for experiment II.
Differently from the previous examined condition, we observe here that the drifters’ paths
are north deviated by the action of the wind on the surface layer with higher velocity (Fig.
9A). The reorientation of the trajectory increases when the drifters approach the coast.
Similar behaviour is observed in the hydrodynamic simulation results (Fig. 9B).
The observed and simulated effect is the result of the composition of the marine current
driven by tidal oscillation, together with surface wind effect. The described condition is
typical in summer in the final hours of the morning.
A model validation was also carried out by comparing simulated and observed salinity
vertical profiles into the plume at section N3 during experiment II. The comparison (Fig. 10)
shows a good agreement between observed and simulated values also in the vertical
profiles. A more extensive comparison of vertical profiles with other parameters and at
other sections will be performed in the future.
salinity [g/kg]
Fig. 10. Vertical salinity behaviour: observed in point N3 (red) and simulated by the model
(blu).
Freshwater Dispersion Plume in the Sea: Dynamic Description and Case Study
143
During the experiments the presence of biological aggregates and foams was observed on
the sea surface interested by the plume (Fig. 11). The presence of biological traces in sea
areas interested by freshwater dispersion is a well known phenomenon. In a few cases
bacterial and dead algae aggregate come directly from internal channels where variation in
water depth provides alternance of photosynthetic and bacterial activity. Here, high aerobic
biomass levels are produced by bacterial synthesis sustained by the production of
photosynthetic oxygen of high growing algae populations. When oxygen, dissolved during
light hours, cannot supply nightly bacteria/algal demand, the water column is interested by
the presence of many species of died organic substances with the associated settling and
floating phenomena. Production of biological foams can occur also when variations in
salinity concentrations increase the mortality of a phytoplankton population growth in a
low salinity environment. In these cases, foam presence is often registered in the last part of
the harbour canal, near the sea mouth, and upon the plume boundary of the sea outfalled
plume.
Two vertical profiles of temperature (Fig. 12A), dissolved oxygen, pH, (Fig. 12B) redox
potential and salinity concentrations (Fig. 12A) were registered and analysed “on site” in
order to check the main plume direction. Fixed investigated points are N1 and S1 focused as
representing the north and south near the sea mouth area (see reference map in Fig. 2).
Parameters are traced with reference to profile P6 at fixed points located on the east
boundary in front of the harbour canal and chosen as indicators of offshore sea conditions.
No appreciable variations on salinity vertical distribution are registered in the south zone,
where measured values appear very similar in S1 (south near mouth) and P6 (offshore sea).
On the contrary, N1 vertical profile presents a salinity distribution which reveals the arrival
in the surface layers of volumes coming from the mouth section enriched by internal
freshwater. A difference of 2 g/l between bottom and surface layers with thermocline from
depth of 60 to 120 cm is registered. Similarly, temperature does not show vertical variations
in the south zone, even if media values appear lower in coastal rather than offshore sea
water (26.5 °C) according with the cooling effects produced in September by internal water
volumes. This is confirmed by the N1 temperature profile which presents lower values in
surface layers (25.6°C) than in the underlying thermocline (26.4 °C) but inversion does not
interrupt stratification which is maintained by variation in density. Similar temperature
values in N1 and S1 points are registered within the thermocline thickness. At thermocline
depths a temperature decrease is appreciable due to the colder masses stored at the bottom
of the harbour canal.
N1, N2, N3 points, interested by the dispersion plume, show a pH vertical profile similar to
temperature profile. Low pH values usually indicate biological organic substance
degradation or nitrification phenomena typically active in waters of internal channels
receiving wastewater. In N1 near the mouth point, higher values are confined in a 1 metre
thickness layer, sited at a 1 metre depth. On this layer, lower pH values confirm the
presence of a plume conditioned by freshwater also indicated by lower temperature.
Fig. 13 and Fig. 14 show the sequence of profiles obtained following the plume trajectory
starting from P1 (internal point corresponding to the slipway) towards to N5 external point
placed on the north boundary investigation area. As expected, freshwater volumes are
progressively mixed with external high salinity volumes proceeding from internal to
external sections. Vertical profiles of salinity behaviour at P1, P2, P3 internal points show
that freshwater plume interests a 2 metre depth surface layer. At the last internal section
(Gambero rosso), turbulence realizes a linear decrease on salinity concentration from 34 g/l
144
Hydrodynamics – Natural Water Bodies
at 2 m depth to 31 g/l at the surface. This layer overflows upon an almost static high
salinity volume placed at the bottom channel. Both P4 and N1 external profiles indicate clear
stratification conditions with a 60 cm floating layer. Here, wastewater presence is
appreciable and thermocline is located into the underlying 60 cm. Measured salinity surface
values together with behaviour of vertical profiles allows the identification of an area
interested by plume dispersion limited to a northerly direction by N3 fixed investigation
point. Similar profiles at points N4 and N5 reveal that in experiment tidal and currents
conditions are typical of offshore sea water volumes.
Fig. 11. View of the floating biological foams observed on the north plume boundary during
the September 1, 2009 experiments. Photo taken from the N3 position (see Fig. 2) beach
oriented.
145
Freshwater Dispersion Plume in the Sea: Dynamic Description and Case Study
A
NORTH vs SOUTH pH PROFILES
7,7
7,6
pH ( )
7,5
7,4
7,3
7,2
0
20 40 60 80 100 120 140 160 180 200 220 240 260 280 300 320 340 360 380
depth (cm)
S1
N1
P6
N3
B
Fig. 12. A) Thermoaline and B) pH profiles at the beginning of the experiment at sections S1,
N1, N3, P6 (see Fig.2).
146
Hydrodynamics – Natural Water Bodies
The sequence of temperature profiles (Fig. 14) reveals very similar vertical trends and values
among all profile sections inside the harbour canal (sections P1, P2 and P3). Perhaps a small
effect of the external sea water’s warmer mass could be noted in the deeper layers at P3
section sited in the proximity of the mouth. Excluding a 40cm sea bottom layer, all points’
indicators of dispersion plume area present temperature values lower at surface (N1). As
just reported in Fig. 12’s comments on comparison of N1 and S1 thermoaline profiles, this
initial thermal inversion which does not yet allow a stratification break, confirms salinity
indications about plume areal extension. N5 profile, located at the northern boundary
investigation area and not interested by colder freshwater coming from the internal basin,
maintains a classic summer temperature profile for Adriatic coastal sea. In this case we
observe a 26.4 °C constant temperature in a 120 cm depth surface layer, a thermocline to a
depth of 240 cm and another 1 metre bottom layer with a constant temperature of 25.2 °C.
Fig. 13. Vertical profiles of salinity measured at the profile points during the experiment
conducted on 1 September, 2009.
Freshwater Dispersion Plume in the Sea: Dynamic Description and Case Study
147
Fig. 14. Vertical profiles of temperature measured at the profile points during experiment
conducted on 1 September, 2009.
Fig. 15. Vertical profiles of dissolved oxygen at the profile points during experiment
conducted on 1 September, 2009.
148
Hydrodynamics – Natural Water Bodies
As expected, oxygen values averaged at each section (Fig. 15) increase, proceeding from
internal to external points. At P1 and P2 profiles, photosynthesis produces maximum values
in a 60 cm surface layer. At the P3 point (internal but near the mouth), a strong influence of
external sea water on bottom layers is confirmed, which shows the same oxygen value,
while at surface layers values are typical of internal waters. No information about plume
dispersion could be obtained at external points where oxygen distribution is characterised
by classic coastal sea profiles with oxygen decreasing values in the direction of deeper layers
where photosynthesis is low and bacterial consumption increases.
Results of simulated salinity concentration (Fig. 16), similar to those presented in Fig. 4B,
indicate a northerly oriented freshwater dispersion, different from the case analysed in Fig.
4B, which presents in the first phases a less oriented dispersion plume and during the
following times (hour 15 – 18) a prevailing orientation to the southern coastal zone. In the
actual case, the plume is west bounded by the continuous breakwaters, this means that the
geometry is well reproduced in the model, and is dispersed to the north, for the effect of the
wind, which was negligible in the previous examined condition.
6h
0
9h
0
200
200
30
400
30
400
25
600
800
800
20
1000
[m]
[m]
25
600
20
1000
15
1200
15
1200
1400
10
1600
1400
10
1600
5
1800
2000
0
5
1800
500
1000
[m]
1500
2000
0
500
1000
[m]
Fig. 16. Simulation of the freshwater plume dispersion during experiment II.
1500
Freshwater Dispersion Plume in the Sea: Dynamic Description and Case Study
149
6. Conclusions
A freshwater dispersion plume in the sea has been described in depth in the present paper
with the aim of producing a 3D numerical model and with the validation of two field
campaigns carried out in different conditions. The investigated area concerns the coastal
zone near Cesenatico (Adriatic Sea, Italy). The fresh water is dispersed by the canal harbour
mouth into the open sea.
The model shows good performance in the application here presented, which is
characterised by the presence of complex sea structures, requiring a very detailed and small
mesh dimension in the geometry description.
Field data were acquired during two field campaigns and are of different typology: surface
lagrangian paths, acquired by innovative properly designed drifters (in both campaigns);
vertical profiles of temperature and salinity and dissolved oxygen acquired by a
multiparameter probe in properly defined fixed points (in the second campaign). During the
first campaign the hydrodynamic was driven only by the tidal oscillation and during the
second also by surface wind, the tested conditions were therefore different and interesting
for understanding the complex dynamics.
Comparison between model results and measurements are good for the surface
hydrodynamic description and for the areal and vertical distribution of concentration, in
particular, the resulting salinity values compared with experimental data have shown a
surprisingly good agreement.
During the second experiment the presence of biological aggregates and foams was
observed on the sea surface interested by the plume. The presence of biological traces in sea
areas interested by freshwater dispersion is a well known phenomenon.
Vertical measurement of thermoaline parameters shows appreciable variations on salinity
vertical distribution in the southern zone, where measured values appear very similar in the
south near mouth and offshore sea. On the contrary, at the northern zone the vertical
profiles present a salinitydistribution which reveals the arrival in the surface layers of
volumes coming from the mouth section enriched by internal freshwater. A difference of 2
g/l between bottom and surface layers with thermocline from depth of 60 to 120 cm is
registered. Similar behaviour was observed for temperature. In fact in the north the
temperature profile presents lower values in surface layers (25.6°C) than in the underlying
thermocline (26.4 °C), but inversion does not interrupt stratification which is maintained by
variation in density. At thermocline depths a temperature decrease is appreciable due to the
colder masses stored at the bottom of the harbour canal.
The points, interested by the dispersion plume, showed a pH vertical profile similar to
temperature profile. Low pH values usually indicate biological organic substance
degradation or nitrification phenomena typically active in waters of internal channels
receiving wastewater. In N1 near the mouth point, higher values are confined in a 1 metre
thickness layer, sited at a 1 metre depth. On this layer lower pH values confirm the presence
of a plume conditioned by freshwater also indicated by a lower temperature.
The methodology proposed in this paper appears to be useful and accurate enough to
simulate the dynamics of the freshwater dispersion at the investigated scale.
The results here presented are original and have allowed a general comprehension of the
thermoaline and hydrodynamic assessment of the dispersion area.
The model now validated can in the future be applied to investigate the dispersion in other
meteo climatic conditions, tides and other canal mouth geometries.
150
Hydrodynamics – Natural Water Bodies
7. Acknowledgements
Authors are grateful to CIRI Edilizia e Costruzioni, UO Fluidodinamica for the financial
support.
8. References
Archetti R. (2009). Design of surface drifter for the oil spill monitoring. REVUE PARALIA.
Coastal and Maritime Mediterranean Conference. Hammamet, Tunisie (2009). 2-5 Dec.
2009. vol. 1, pp. 231 - 234 />Bragadin G.L., Mancini M.L., Turchetto A. (2009). Wastewater discharge by estuarine
transition flow and thermoaline conditioning in shore habitat near Cesenatico
breakwaters. Proceeding of the Fifth International Conference on Coastal Structures.
Coastal Structures 2007-Venice.July 2-4, 2007 (vol.II, pp.1101-1112).
Broche P. Devenon J.L., Forget P., Maistre C., Naudin J. and Cauwet G. (1998). Experimental
study of the Rhone plume. Part I. Physics and dynamics. Oceanol Acta. 21, 725-738.
ISSN: 0399-1784.
Burrage D., J. Wesson, C. Martinez, T. Pérez, O. Möller Jr., A. Piola. (2008). Patos Lagoon
outflow within the Río de la Plata plume using an airborne salinity mapper:
Observing an embedded plume. Continental Shelf Research, 28 (13), 1625-1638. ISSN:
0278-4343.
Di Giacomo P. M., Washburn L., Holt B. and Jones B. H. (2004). Coastal pollution hazards in
southern California observed by SAR imagery: stormwater plumes, wastewater
plumes and natural hydrocarbon seeps. Marine Pollution Bulletin 49 (2004) 1013–
1024. ISSN 0025-326X.
Duran N., Fiandrino A., Frauniè P., Ouillon S., Forget P. and Naudin J. (2002). Suspended
matter dispersion in the Ebro ROFI: an integrated approach. Continental Shelf
Research 22, 267-284. ISSN 0278-4343.
Fichez R., Jickells T. D. and Edmunds H. M. (1992). Algal blooms in high turbidity, a result
of the conflicting consequences of turbulence on nutrient cycling in a shallow water
estuary. Estuary Coast Shelf Sci. 35. 577 – 593. ISSN 0272-7714.
Figueiredo da Silva F., Duck R.W., Hopkins T.S. and Anderson J.M. (2002). Nearshore
circulation revealed by wastewater discharge from a submarine outfall, Aveiro
Coast, Portugal. Hydrology and Earth System Sciences 6(6), 983–989 (2002). ISSN:
1027-5606.
Froidefond J.M., Jegou A.M., Hermida J., Lazure P., Castaing P. (1998). Variability of the
Gironde turbid plume by remote sensing. Effect of climate factor. Oceanol Acta. 21:
191-207. ISSN: 0399-1784.
Garvine R.W. (1987). Estuarine plumes and fronts in shelf waters: a layer model. Journal of
Physical Oceanography 17 (1987), 1877–1896. ISSN: 0022-3670.
Garvine, R.W. (1995). A dynamical system for classifying buoyant coastal discharges.
Continental Shelf Research 15 (13) (1995), pp. 1585–1596. ISSN: 0278-4343.
Grimes C. and Kingford M. (1996). How do riverine plumes of different sizes influence fish
larvae: do they enhance recruitment? Marine Freshwater Research. 47, 191-208. ISSN:
1323-1650.
Freshwater Dispersion Plume in the Sea: Dynamic Description and Case Study
151
Jouanneau J. M. and Latouche C. (1982). Estimation of fluxes to the ocean from mega tidal
estuaries under moderate climates and the problems they present. Hydrobiologia, 91.
23:29. ISSN: 0018-8158.
Kourafalou V.H., Lee T.N., Oey L.-Y. and Wang J.D. (1996). The fate of river discharge on
the continental shelf, 2. Transport of coastal low-salinity waters under realistic
wind and tidal forcing. Journal of Geophysical Research 101 (1996), 3435–3455. ISSN
0148-0227.
Lamberti A., Archetti R., Kramer M., Paphitis D., Mosso C., Di Risio M. (2005). European
experience of low crested structures for coastal management. Coastal Engineering.
Vol. 52.(10-11), 841 - 866 ISSN 0378-3839.
Liu S.K. and Leendertse J.J. (1978). Multidimensional numerical modelling of estuaries and
coastal seas, Advances in Hydroscience, Vol. 11, Academic Press, New York (USA),
1978. ISSN: 0065-2768.
Mestres M., Sierra J.P., Sánchez-Arcilla A. (2007). Factors influencing the spreading of a lowdischarge river plume. Continental Shelf Research, 27, (16-15), 2116-2134. ISSN: 02784343.
Mancini M.L. (2008). Wastewater finishing by combined algal and bacterial biomass in a
tidal flow channel. Modeling and field experiences in Cesenatico. International
Symposium on Sanitary and Environmental Engineering-SIDISA 08 -Proceedings,
ROMA, ANDIS, 2008, pp. 50/1 - 50/8
Mancini M.L. (2009). Wastewater discharge and thermoaline conditioning in south
Cesenatico (I) coastal area near breakwaters. Proceedings of the Ninth International
Conference on the Mediterranean Coastal Environment.-MEDCOAST 09. Sochi-Russia.
10-14 November 2009. vol. 1, 143/1 - 143/7.
Mestres M., Sierra J.P., Sanchez Arcilla, A., Del Rio, J.G., Wolf T., Rodriguez A. and Ouillon
S. (2003). Modelling of the Ebro River plume. Validation with field observations.
Scientia Marina. 67 (4). 379 – 391. ISSN 0214-8358.
Molleri G. S. F., De M. Novo E. M. L., Kampel M. (2010). Space-time variability of the
Amazon River plume based on satellite ocean color. Continental Shelf Research 30
(3-4). 342-352. ISSN: 0278-4343.
Nezlin G.P and DiGiacomo P.M. Satellite ocean color observations of stormwater runoff
plumes along the San Pedro Shelf (southern California) during 1997–2003. (2005).
Continental Shelf Research, 25,(14), 1692-1711. ISSN: 0278-4343.
Ogston A. S., Cacchione D. A., Sternberg R. W., Kineke G. C. (2000). Observations of storm
and river flood-driven sediment transport on the northern California continental
shelf. Continental Shelf Research, 20, (16), 2141-2162.
O’Donnell J. (1990). The formation and fate of a river plume: a numerical model. J. Phys.
Oceanogr. 20, 551-569. ISSN: 1520-0485.
Sherwin T. J., Jonas P. J. C. and Sharp C. Subduction and dispersion of a buoyant effluent
plume in a stratified English bay. Marine Pollution Bulletin, Vol. 34, No. 10, 827-839,
1997. ISSN 0025-326X.
Siegel H., Gerth M. and Mutze A. (1999). Dynamics of the Oder River plume in the southern
Baltic Sea: Satellite data and numerical modelling. Continental Shelf Research 19
(1143 – 1159). ISSN: 0278-4343.
152
Hydrodynamics – Natural Water Bodies
Stumpf R.P., Gefelbaum G. and Pennock J.R. (1993). Wind and tidal forcing of a buoyant
plume, Mobile Bay, Alabama. Continental Shelf Research 13, 1281-1301. ISSN: 02784343.
Yankovsky E. and Chapman D.C. (1997). A simple theory for the fate of buoyant coastal
discharges. Journal of Physical Oceanography 27 (1997), 1386–1401 ISSN: 1520-0485.
Warrick J. A. and Stevens A. W. (2011). A buoyant plume adjacent to a headland—
observations of the Elwha River plume. Continental Shelf Research, 31,85-97. ISSN:
0278-4343.
Part 3
Tidal and Wave Dynamics:
Estuaries and Bays
8
The Hydrodynamic Modelling of
Reefal Bays – Placing Coral Reefs
at the Center of Bay Circulation
Ava Maxam and Dale Webber
University of the West Indies
Jamaica
1. Introduction
Reefal bays are a common type of bay system found along most Caribbean coasts including
the Jamaican coastline. These bay systems are associated with and delimited by arching
headland with sub-tending reef arms broken by a prominent channel. Traditionally, these
bays are termed “semi-enclosed” as their limits are defined by the sand bar or reef partially
cutting off waters behind them from open sea (Nybakken, 1997). Yet, it has been shown that
circulatory patterns emanating from the lee of reef structures can persist beyond the forereef (Prager, 1991; Gunaratna et al., 1997). This raises the possibility of re-characterizing
these systems where the reef is defined as the centre of a dynamic bay, inducing a
continuous re-circulation of the inside waters beyond the traditional limit (Figure 1). In this
study, hydrodynamic modelling, particle tracking and a novel gyre analysis method were
used to assess the reefal bay’s signature spatial and temporal patterns in circulation, with
the goal of characterizing the reefal bay as unique in its function. This was carried out on the
Hellshire southeast coast of Jamaica where four of seven bays are typical reefal bays.
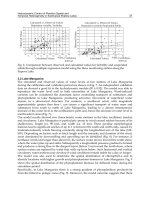
Fig. 1. A number of hypothetical bays are presented where A represents the open bay, B the
traditional definition of the reefal bay, and C the reef proposed as circulatory centre of the
reefal bay system.
Reef systems often function to reduce the shoreline wave action and influence sediment
dynamics. They therefore provide the ecological link between land and sea, as nurseries
offering protection for marine life, as recreational sites, and as receiving sites for industrial
156
Hydrodynamics – Natural Water Bodies
and biological effluent. Their distinctive circulatory patterns have, however, been
understudied and not fully characterized. This research aims to describe the signature
circulatory patterns of the subtending reef bay system, including the effects of bathymetry,
wind, tides and over-the-reef flow on this circulatory emanation. Hydrodynamic modelling,
particle tracking and a novel gyre analysis method were utilized to characterize the reefal
bay circulation and determine those features that make this reef-centered bay system
unique.
Reefal bays carry unique patterns of circulation, however, very few reef hydrodynamic
studies have focused on the particular circulation associated with fringing Caribbean reef
systems. One study on a shallow, well-mixed Caribbean type back-reef lagoon in St. Croix
documents that circulation was dominated by wind and over-the-reef flow (Prager, 1991).
Another study on the Grand Cayman Island reefs documented that the outer reef tended to
be dominated by wind-driven currents and the inner by high frequency waves. Deep water
waves and tides, winds and over-the-reef flow controlled the hydrodynamic sub-system
found in the lagoon (Roberts et al., 1988). At the reef crest, wave breaking and rapid energy
transfers resulted in a sea level set-up which drove strong reef-normal surge currents
(Roberts et al., 1992). In both the Grand Cayman and St. Croix reef systems, flow over the
reef was often the dominant forcing mechanism driving lagoon circulation (Roberts, 1980;
Roberts & Suhayda, 1983; Roberts et al., 1988). Whereas previous studies have contributed to
Caribbean reefal hydrodynamics, their application to the reefal bay systems in particular
falls short in a number of ways. The reefal bay dynamics has never been distinguished from
other reef systems as a unique coastal system. It is instead often broadly categorized under
the larger fringing reef system or as a fully enclosed lagoon system. Also, the contribution of
reef-induced eddies to the hydrodynamic make-up is understated. Smaller-scale eddy
features were not examined in these Caribbean studies. These are important features to note,
whether transient or permanent in nature (Sammarco & Andrews, 1989) because of their
ability to trap water, sediments, larvae and plankton around reefs. Sammarco & Andrews
(1989) showed that attenuation of tidal effects within lagoons and tidal anomalies generated
by the reef were responsible for creating or maintaining eddies on isolated systems. More
comprehensive research is now necessary to determine the characteristic circulatory
dynamics and responsible forcing functions.
2. Numerical modelling development and challenges for reef systems
The lagoons formed by coral reefs exhibit some of the most variable bathymetry of coastal
oceanography and present a challenge to understanding their dynamics (Hearn, 2001). The
ideal model must be able to account for all the forcing factors and conditions typical of the
coral reef environment including wave and current propagation and interaction, density
flows, channel exchange, reef topology and reef morphology. The modelling becomes even
more complex when attempts are made to process spatial scales ranging from tens of
kilometers down to sub-meter at the same time. These difficulties continue to confound
localized studies of reef phenomena.
Several numerical models have been applied to lagoon hydrodynamics using onedimensional (Smith, 1985), two-dimensional (Prager, 1991; Kraines et al., 1998) and threedimensional models (Tartinville et al., 1997; Douillet et al., 2001). Wave breaking and
overtopping remain phenomena that are difficult to describe mathematically because the
physics is not completely understood (Feddersen & Trowbridge, 2005; Pequignet, 2008). The
The Hydrodynamic Modelling of Reefal Bays –
Placing Coral Reefs at the Center of Bay Circulation
157
large range of combinations of reef types, shapes, tidal environments and wave climates
makes all existing analyses of wave-generated flow on coral reefs limited in their
applications (Gourlay & Colleter, 2005). Instrument-measured field data, however, confirm
that the wave dynamics is responsible for a significant proportion of the reefal lagoon/bay
hydrodynamics (Symonds et al., 1995; Hearn, 1999, 2001). As the waves break, a maximum
set-up occurs near the reef edge. The maximum set-up on the reef top is proportional to the
excess wave height (Hearn, 2001). The set-up creates the pressure gradient required to drive
the wave-generated flow across the reef (Gourlay & Colleter, 2005). Friction coefficients are
also important to consider and so these are presented as large values in recognition of the
great roughness of reefs (Symonds et al., 1995). In consideration, however, of reefs with
steep faces where waves break to the reef edge, wave set-up is reduced by the velocity head
of the wave generated current. In this case, influence of bottom friction in the surf zone is
ignored. Wave overtopping has been developed and described as two linked functions by
Van der Meer (2002):- one for breaking waves applicable to more intense wave conditions
(here, wave overtopping increases for an increasing breaker parameter), and the other for
the maximum achieved for non-breaking waves applicable to significantly reduced wave
conditions where waves no longer break over the reef.
Three-dimensional models continue to evolve in simulating wave-driven flow across a reef.
An attempt is made in this chapter to simulate the three-dimensional flow associated with
reefal bays by incorporating equations for wave breaking and overtopping at the reef into a
finite element-based model for stratified flow.
3. Reefal bay sites
Southeast of Jamaica, a 15 km stretch of coastline, the Hellshire east sector (Figure 2),
consists of seven bays - four of which are reefal. Three bays were compared for their
circulatory signatures – Wreck Bay, Engine Head Bay and Sand Hills Bay. Two of the three,
Wreck Bay and Sand Hills Bay, have prominent reef parabola stretching between headlands
with a central, narrow channel breaking the reef continuum. Wreck Bay, with its narrower
channel, is more enclosed than Sand Hills Bay. Associated reefs are emergent and exposed,
more so at low tide. Both reefal bays are separated along the coastline by Engine Head Bay,
an open bay with no development of reef arms. Engine Head Bay was therefore considered
as a control given it is non-reefal and its position exposes it to the same conditions as the
two reefal bays.
A diurnal variation in the wind records is typical of the southeast coast of Jamaica (Hendry,
1983) due to the influence of the sea-land regime. The tidal range is microtidal ranging from
0.3 - 0.5 m with an annual mean of 0.23 m (Hendry, 1983) and demonstrating a mixed tidal
regime. Tidally generated currents are therefore small in amplitude compared to winddriven currents. The wave climate of the southeast coast is influenced mainly by trade
wind-generated waves that approach Jamaica from the northeast. Offshore waves impact
the shelf edge off Hellshire from a predominantly east-south-easterly direction after
undergoing southeast coast refraction. Swell waves approach the coast at a typical period
range of 6-9 seconds, but these are soon affected by complex bathymetry. Wave decay
occurs when the land-breeze emanates along the coast. The shelf along which these bays
fringe are made up of basement rock composed of Pliestocene limestone eroded during low
sea levels in the Pliestocene epoch. As a result, bathymetric highs are now shoals, banks,
reefs and cays, and on the inshore, karst limestone relief facilitates freshwater sub-marine
seeps into the bays (Goodbody et al., 1989).
158
Hydrodynamics – Natural Water Bodies
Fig. 2. Map showing the study site of three bays located on the Hellshire South East Coast of
Jamaica. Wreck Bay and Sand Hills Bay are the two reefal bays under investigation, along
with the open bay Engine Head Bay located between the other two.
Environmental stress studies conducted inshore and offshore these bays used plankton
population size and species composition as indicators. Lowest values in biomass, primary
production and density were recorded in the southernmost bays. These bays were therefore
considered generally removed from the effects of the highly productive Kingston Harbour
and Great Salt Pond waters to the north, with the exception of during flood occasions when
elevated levels were recorded in the southernmost bay, Wreck Bay. The authors suggested
the possibility of long retention times due to localized circulation (White, 1982; Webber,
1990). These results were of great interest given the implications presented for the protective
role played by reefal bays as nurseries for the early aquatic stages of marine and terrestrial
species; for the significance of its distance down-shore from the main harbor not inhibiting
its eutrophication; and for sediment transport and exchange along the shoreline. In fact,
physicochemical variables were also robust in characterizing the persistence of bay waters
beyond the reef (Maxam & Webber, 2009). This indicated the need for appropriate
numerical simulations to adequately describe the circulatory patterns in these bays - the
findings of which are presented in this chapter.
4. Methods for Simulating the reefal bay system
Oceanographic and meteorological data were collected for the Hellshire coast and served as
inputs into the hydrodynamic model. Field data were also used for model verification after
executing model simulations under various meteorological conditions. This was followed by
The Hydrodynamic Modelling of Reefal Bays –
Placing Coral Reefs at the Center of Bay Circulation
159
an analysis of bay contraction and expansion due to circulation induced by the presence of
the subtending reef, and ultimately the development of particular circulatory signatures
defining the reefal bay.
4.1 Oceanographic and meteorological data collection
Bathymetric depth points were digitized from Admiralty bathymetric charts for the
Hellshire coastline area and the entire South-East Shelf. For the finer-scale bathymetry
required of the reef and bay areas, water depth (± 0.1 m) was measured to supplement the
Admiralty data using an echo-sounder with Trimble Garmin GPS and post processed to
account for tidal elevation differences from mean sea level. Wind speed (± 0.1 m s-1) and
wind direction (± 0.1°) data were collected from the nearby Normal Manley International
Airport weather center as continuous two-minute averages over the entire sampling period
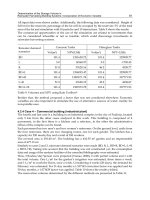
(1999 to 2003). Long-term current measurements for speed (± 0.10 cm s-1) and direction (±
0.1°) were recorded continuously by Inter-Ocean S4 current meters at four sites inside (Table
1) and outside of Wreck Bay.
Mooring
Location
Depth
(m)
1
2
Channel
Channel
4.0
4.0
3
Channel
4.0
4
Channel
5
6
West Back-reef
East Back-reef
Deployment Dates
Duration
(wks)
24 May – 13 Jun 2000
11 Jul – 03 Sep 2000
20 Dec 2002 - 10 Jan
2003
3
7
4.0
14 Mar – 28 Mar 2003
1
2.0
0.7
11 Jul – 03 Sep 2000
20 Jul – 01 Sep 2000
7
1
3
0n / every
5 min / 1 hr
5 min / 1 hr
1 min / 10
min
1 min / 10
min
5 min / 1 hr
5 min / 1 hr
Table 1. Deployment specifications for long-term field current data collection in Wreck Bay.
Hydrodynamic model outputs were compared with these measurements for verification.
Hourly tidal amplitudes (± 1 mm) were calculated using Foreman’s Tidal Analysis
(Foreman, 1977) and Prediction Program, incorporating mean sea-level and tidal amplitude
data over a 40-year period from Port Royal, a nearby tide station. Hourly incident wave
height values (± 1 cm) used in the over-the-reef flow calculations were taken from
Refraction-Diffraction (REFDIF) wave models (Kirby & Dalrymple, 1991) of the shoreline
(Burgess et al., 2005). The deepwater wave climate obtained from JONSWAP (Hasselmann
et al., 1973) analysis was used to run the REFDIF models in order to carry the deepwater
waves from the continental shelf to the shoreline. Near-shore conditions were simulated at
50% occurrence (average conditions) and used as input into the hydrodynamic model.
4.2 Hydrodynamic modelling
A hydrodynamic model, RMA-10, was utilized to simulate the depth-averaged velocity field
of the fore-reef and back-reef along with the shoreline flow under wind and tidal conditions
typical of the Jamaican south-east coastal area. RMA-10 is a three-dimensional finite element
model for simulation of stratified flow in bays and streams (King, 2005). The primary
features of RMA-10 are the solution of the Navier-Stokes equations in three-dimensions; the
use of the shallow-water and hydrostatic assumptions; coupling of advection and diffusion
160
Hydrodynamics – Natural Water Bodies
of temperature, salinity and sediment to the hydrodynamics; the inclusion of turbulence in
Reynolds stress form; horizontal components of the non-linear terms; and vertical
turbulence quantities are estimated by either a quadratic parameterisation of turbulent
exchange or a Mellor-Yamada Level 2 turbulence sub-model (Mellor & Yamada, 1982).
Computations in the model are based on the Reynolds form of the Navier-Stokes equations
for turbulent flows and employ an iterative process that solves simultaneous equations for
conservation of mass and momentum. RMA-10 requires the input of nodal x, y and z data
depicting sea floor bathymetry, parameters for roughness and eddy viscosity, and boundary
conditions of flow discharge. The iterative process computes nodal values of water surface
elevation, flow, depth and layered horizontal velocity components or vertically averaged
velocity components if this option is used.
Two-dimensional depth-averaged approximations were used for the Hellshire bays’
simulations. Depth-averaged results are appropriate given the shallowness of the reefal bay
and the knowledge that this usually presents a well-mixed system. Boundary conditions
were entered into RMA-10 using a list of nodes defined as flow continuity checks simulating
flow over the reefs and also used to specify initial values of salinity concentration (36.0 ppt),
temperature (28.0 °C) and suspended sediment concentration (2.0 gL-1) conditions along
the model east and west open boundaries. Boundary conditions were also read from a wind
velocity and direction file derived from wind data. This was input as hourly averaged wind
velocity and direction and allowed the model to read dynamic wind conditions useful in
examining the influence of a diurnal wind regime. Boundaries were also subject to a tidalgraph of hourly tidal elevation data for interpolation.
Reef parabola were represented by continuity lines where hydrograph data of dynamic flow
over the reef were interpolated. Flow over the reef was calculated as hourly-averaged values
using the wave run-up and overtopping Van der Meer equations (Van der Meer, 2002) as a
base. Wave overtopping is the average discharge per linear meter of width, q, and is
calculated in relation to the height of the reef crest line. The final flow value Q used in the
hydrograph file is given as the length of the reef parabola long axis multiplied by the
average discharge q. For breaking waves (b0 ≤ 2), wave overtopping increases for
increasing breaker parameter 0. Assumptions are made of a fully developed wave at the
reef crest and so the incident wave height is used. Determination of correct wave period for
heavy wave-breaking on a shallow fore-shore is neglected here as this requires complex
wave transformation Boussinesq models (Nwogu et al., 2008) and lies beyond the objectives
of this study. Instead, an average value for the wave period is used. Other influences are
included in the general formula such as roughness on the reef slope and the reef slope itself
(considered here to be equal to or steeper than 1:8 close to the reef crest). The wave
overtopping formula is given as exponential functions with the general form:
q a exp( b.Rc )
(1)
The coefficients a and b are still functions of the wave height, slope angle, breaker parameter
and the influence factors of reef roughness and slope; Rc being the free crest height above
still water line. Wave heights used varied around the predicted value of 0.48 m but were
not simulated for extreme events (<1-year event occurrence). A set of turbulent exchange,
turbulent diffusion and Chezy coefficients was applied at all nodes. The turbulent exchange
coefficient associated with the x and y direction shear of the x and y direction flow was set
The Hydrodynamic Modelling of Reefal Bays –
Placing Coral Reefs at the Center of Bay Circulation
161
as -5.4 Pa s. The turbulent exchange coefficient of the z direction shear of the x and y
direction flow was set at 0.44 Pa s. The turbulent diffusion coefficient associated with the x
and y directions were set at 2.11 m2 s-1 and that associated with the z direction set at 0.21 m2
s-1. The Chezy coefficient of 0.029 m0.5 s-1 was used for all nodes except at the shoreline
where it was reduced to 0.0015.
Particular conditions at the Hellshire coastline led to adding a third variable, Y, to account
for the diurnal effect of the wind regime. It was found that emanation of the land-breeze
significantly reduced wave heights and caused more variation in the flow over the reef than
predicted by the Van de Meer calculations. This variable Y is a function of the southward
wind flow and leads to a large reduction in the q value once the land-breeze emanates. At a
maximum the final overtopping formula becomes:
q
3
gH m0
R
1
0.2 exp(Y ) exp 2.3 c
H m 0 ( f )( b )
(2)
where:
q
g
Hm0
Rc
Y
=
average wave overtopping discharge
(m3 s-1 m-1)
=
acceleration due to gravity
(m s-2)
=
significant wave height
(m)
=
free crest height above still water line
(m)
=
wind y component
=
influence factor for roughness
f
b
=
influence factor for slope
Comparisons between RMA Model results and field-collected current measurements were
tested for significance using the t-test.
The model mesh was built using assemblages of two-dimensional triangular and
quadrilateral elements. The software RAMGEN (King, 2003), a graphics based pre-processor
for RMA-10, was used to form the grid and create the interface file that the RMA software
utilized. The regional mesh covered the entire south-east coastal shelf including Kingston
Harbour to the north, and had two open boundaries - one at the east side and the other
south-west. Courser elements (>1 km2) were created for the offshore shelf areas. Elements
were more refined (<100 m2) closer to the shoreline or in areas where there were
expectations of large changes.
Individual particles were tracked based on the velocity distribution used by the RMATRK
software (King, 2005). This application is designed to track particles released into a surface
water system that have been simulated with the RMA-10 model. It transports discrete
objects through a surface water system defined by the RMA-10 finite element grid. Time
steps were set up so that track increments were drawn for every six minutes in a one-hour
or three-hour time block.
4.3 Gyre analysis
The horizontal expansion and contraction of gyres were measured to quantify the extent of
bay fluctuation. Tracks produced by the RMATRK model were of three categories:
Hourly plotted tracks: where new particles were introduced in the same positions at the
beginning of each hour for as long as the duration of one and a half tidal cycles,
Three-hourly tracks: where new particles were introduced in the same positions at the
beginning of each three-hour time block for as long as the duration of one and a half
tidal cycles, and