Woven Fabric Engineering Part 13 docx
Bạn đang xem bản rút gọn của tài liệu. Xem và tải ngay bản đầy đủ của tài liệu tại đây (2.06 MB, 30 trang )
Composites Based on Natural Fibre Fabrics
339
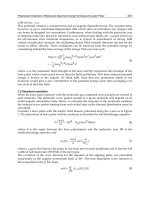
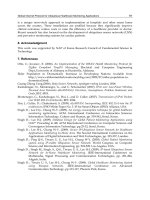
Fig. 28. Weaved fabric (0/90) with twisted yarns
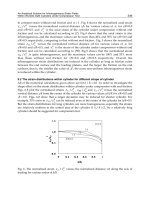
Neat Resin Dried HLU UD HLU 0/90
Experimental
0,658 1,08 3,96 2,94
0
0,5
1
1,5
2
2,5
3
3,5
4
4,5
Tensile Modulus [GPa]
(a) (b)
Fig. 29. Tensile testing of weaved fabrics: Modulus (a), Strength (b)
6. Conclusions
The present chapter was focused on the use of natural fibre fabric as reinforcement for
composite materials. The environmental and cost benefits connected with the use of natural
fibre based fabrics are at the basis of their wide success. However, several limitations must
be overcome in order to exploit the full potential of natural fibres. At first proper fibre
surface treatment should be developed and implemented at industrial scale. Secondly, the
use of mats should be investigated and the hybridization of mats with different textile
further improved by analysing the effects of different layup and manufacturing techniques.
Finally, the use of advanced textile based on twisted yarn should be developed further by
optimising the yarn manufacturing and realising 3D architectures which are still missing
from the market.
7. References
Bledzki AK & Gassan J. (1999). Composites reinforced with cellulose based fibres. J Prog
Polym Sci; 24, 221–74.
Woven Fabric Engineering
340
Magurno A. (1999). Vegetable fibres in automotive interior components. Die Angew
Makromol Chem; 272, 99–107.
John M.J., Francis B., Varughese K.T. & Thomas S. (2008), Effect of chemical modification on
properties of hybrid fiber biocomposites. Composites: Part A – Applied Science and
Manufacturing, 39 (2008) 352-363.
Saheb DN & Jog JP. (1999) Natural fiber polymer composites: A review. Adv Polym.
Technol., 18, 351–63.
Kalia S., Kaith B.S. & Kaura I. (2009), Pretreatments of Natural Fibers and their Application
as Reinforcing Material in Polymer Composites – A Review. Polymer Engineering
and Science, 49, 1253-1272.
Williams G.I. & Wool R.P.(2000), Composites from Natural Fibers and Soy Oil Resins.
Appl.Compos. Mater., 7, 421.
Bogoeva-Gaceva G., Avella M., Malinconico M., Buzarovska A., Grozdanov A., Gentile G. &
Errico M.E. (2007), Natural Fiber Eco-Composites. Polymer Composites, 28, 98-107.
Rong. M.Z., Zhang M.Q., Liu Y., Yang G.C. & Zeng H.M. (2001), The effect of fiber treatment
on the mechanical properties of sisal-reinforced epoxy composites.
Compos.Sci.Technolo., 61, 1437.
Nair KCM, Kumar RP, Thomas S, Schit SC & Ramamurthy K. (2000) Rheological behavior of
short sisal fiber-reinforced polystyrene composites. Composites Part A. 31, 1231–40.
Heijenrath R. & Peijs T. (1996), Natural-fibre-mat-reinforced thermoplastic composites based
on flax fibres and polypropylene, Adv. Comp. Let, 5, 81-85.
Berglund L.A. & Ericson M.L. (1995), Glass mat reinforced polypropylene in: Polypropylene:
Structure, blends and composites, Vol 3, J. Karger-Kocsis (ed.), 202-227, Chapman
& Hall, London.
Van den Oever M.J.A, Bos H.L. & van Kemenade M.J.J.M. (1995), Influence of the physical
structure of flax fibres on the mechanical properties of flax fibre reinforced
polypropylene composites, Appl. Comp. Mat. 7, 387-402.
Paiva MC, Cunha AM, Ammar I & Ben Cheikh R. (2004), Alfa fibres: mechanical,
morphological, and interfacial characterisation, In: Proceedings of ICCE-11, pag. 8–
14 USA, August 2004.
Baiardo M, Zini E & Mariastella S. (2004), Flax fibre-polyester composites. Composites: Part
A ; 35, 703–10.
Goutianos, S. & Peijs, T. (2003) The optimisation of flax fibre yarns for the development of
high performance natural fibre composites. Adv. Compos. Lett. 12, 237–241.
Baley, C. (2002) Analysis of the flax fibres tensile behaviour and analysis of the tensile
stiffness increase. Composites A, 33, 939–948.
Goutianos S., Peijs T. & Nystrom B. (2006), Development of Flax Fibre based Textile
Reinforcements for Comnposite Applications, Appl. Compos. Mater., 13, 199-215.
John M.J. & Anandjiwala R.D. (2008), Chemical modification of flax reinforced
polypropylene composites, Polym. Compos., 29, 187.
Bledzki AK & Gassan J. (1996), Natural fiber reinforced plastics. Kassel, Germany:
University of Kassel; 1996.
Rodriguez E.S., Stefani P.M. & Vazquez A. (2007), Effects of Fibers’Alkali Treatment on the
Resin Transfer Moulding Processing and Mechanical Properties of Jute-Vinylester
Composites, Journal of Composite Materials, Vol. 41, No. 14.
Composites Based on Natural Fibre Fabrics
341
Le Troedec M., Sedan D., Peyratout C., Bonnet J.P., Smith A., Guinebretiere R., Gloaguen V.
& Krausz P. (2008), Influence of various chemical treatments on the composition
and structure of hemp fibres, Composites- Part A: applied science and
manufacturing, 39, 514-522.
Sgriccia N., Hawley M.C. & Misra M. (2008), Characterization of natural fiber surfaces and
natural fiber composites, Composites- Part A: applied science and manufacturing,
39, 1632-1637.
Andersson M. & Tillman A.M. (1989), Acetylation of jute: Effects on strength, rot resistance,
and hydrophobicity, J. Appl. Polym. Sci., 37, 3437.
Murray J.E. (1998), Acetylated Natural Fibers and Composite Reinforcement, 21st
International BPF Composites Congress, Publication Number 293/12, British Plastics
Federation, London.
Rowell R.M. (1991), Natural Composites, Fiber Modification, in International Encyclopedia of
composites, 4, S.M. Lee, Ed., VHC, New York,.
Rowell R.M. (1998), Property Enhanced Natural Fiber Composite Material based on
Chemical Modification, in Science and Technology of Polymers and Advanced Materials,
Prasad P.N., Mark J.E., Kendil S.H. & Kafafi Z.H Eds., pag. 717-732, Plenum Press,
New York.
Matsuda H. (1996), Chemical Modification of Solid Wood in Chemical Modification of
Lignocellulosic Materials, D. Hon Ed., pag. 159, Marcel Dekker, New York.
Sreekala M.S., Kumaran M.G., Joseph S., Jacob M & Thomas S. (2000), Appl. Compos.
Mater., 7, 295.
A. Paul, K. Joseph, and S. Thomas, Compos. Sci. Technol., 57, 67 (1997).
M.S. Sreekala, M.G. Kumaran, and S. Thomas (2002), Compos. Part A: Appl. Sci. Manuf., 33,
763.
Joseph K., Mattoso L.H.C., Toledo R.D., Thomas S., de Carvalho L.H., Pothen L., Kala S. &
James B. (2000), Natural Fiber Reinforced Thermoplastic Composites in Natural
Polymers and Agrofibers Composites, Frollini E., Leao A.L. & Mattoso L.H.C. Eds., 159,
San Carlos, Brazil, Embrapa, USP-IQSC, UNESP.
Kaith B.S. & Kalia S. (2008), Polym. Compos., 29, 791.
Soo-Jin Park & Joong-Seong Jin (2001), Effect of Silane Coupling Agent on Interphase and
Performance of Glass Fibers/unsaturated Polyester Composites, Journal of Colloid
and Interface Science, 242, 174-179.
Li Hu, Yizao Wana, Fang He, H.L. Luo, Hui Liang, Xiaolei Li & Jiehua Wang (2009), Effect of
coupling treatment on mechanical properties of bacterial cellulose nanofibre-
reinforced UPR ecocomposites, Materials Letters, 63: 1952–195.
Mishra S.,. Naik J.B &. Patil Y.P (2000), Compos. Sci. Technol., 60, 1729.
Agrawal R., Saxena N.S., Sharma K.B. (2000), Thomas S. &. Sreekala M.S, Mater. Sci. Eng. A,
277, 77.
Coutinho F.M.B., Costa T.H.S. & Carvalho D.L. (1997), J. Appl. Polym. Sci., 65, 1227.
Gonzalez L., Rodriguez A., de Benito J.L.& Marcos-Fernandez A. (1997), J. Appl. Polym. Sci.,
63, 1353.
Sreekala M.S., Kumaran M.G., Joseph S., Jacob M. & Thomas S. (2000), Appl. Compos. Mater.,
7, 295.
Woven Fabric Engineering
342
Kokta B.V., Maldas D., Daneault C. & Beland P. (1990), Polym Plast. Technol. Eng., 29, 87.
Wang B., Panigrahi S., Tabil L. & Crerar W. (2007), J. Reinf. Plast. Compos., 26, 447.
Young R., Rowell R., Shulz T.P. & Narayan R. (1992), Activation and Characterization of
Fiber Surfaces for Composites in Emerging Technologies for Materials and Chemicals
from Biomass, Eds., American Chemical Society, pag.115 Washington D.C., 115.
Goring D. & Bolam F. (1976), Plasma-Induced Adhesion in Cellulose and Synthetic Polymers
in The Fundamental Properties of Paper Related to its uses, Ed., Ernest Benn Limited,
pag.172, London.
Cicala G., Cristaldi G., Recca G., Ziegmann G., ElSabbagh A. & M.Dickert (2009). Properties
and performances of various hybrid glass/natural fibre composites for curved
pipes, Materials & Design, 30, 2538-2542.
18
Crashworthiness Investigation and
Optimization of Empty and
Foam Filled Composite Crash Box
Dr. Hamidreza Zarei
1
and Prof. Dr Ing. Matthias Kröger
2
1
Aeronautical University, Tehran,
2
Institute of Machine Elements, Design and Manufacturing,
University of Technology Freiberg,
1
Iran
2
Germany
1. Introduction
Metallic and composite columns are used in a broad range of automotive and aerospace
applications and especially as crash absorber elements. In automotive application,
crashworthy structures absorb impact energy in a controlled manner. Thereby, they bring the
passenger compartment to rest without subjecting the occupant to high decelerations. Energy
absorption in metallic crash absorbers normally takes place by progressive buckling and local
bending collapse of columns wall. A distinctive feature of such a deformation mechanism is
that the rate of energy dissipation is concentrated over relatively narrow zones, while the other
part of the structure undergoes a rigid body motion. In comparison to metals, most composite
columns crush in a brittle manner and they fail through a sequence of fracture mechanism
involving fiber fracture, matrix crazing and cracking, fiber-matrix debonding, delamination
and internal ply separation. The high strength to weight and stiffness to weight ratios of
composite materials motivated the automobile industry to gradual replacement of the metallic
structures by composite ones. The implementation of composite materials in the vehicles not
only increases the energy absorption per unit of weight (Ramakrishna, 1997) but also reduces
the noise and vibrations, in comparison with steel or aluminum structures (Shin et al., 2002).
The crashworthiness of a crash box is expressed in terms of its energy absorption E and
specific energy absorption SEA. The energy absorption performance of a composite crash box
can be tailored by controlling various parameters like fiber type, matrix type, fiber
architecture, specimen geometry, process condition, fiber volume fraction and impact velocity.
A comprehensive review of the various research activities have been conducted by Jacob et al.
(Jacob et al., 2002) to understand the effect of particular parameter on energy absorption
capability of composite crash boxes.
The response of composite tubes under axial compression has been investigated by Hull (Hull,
1982). He tried to achieve optimum deceleration under crush conditions. He showed that the
fiber arrangement appeared to have the greatest effect on the specific energy absorption.
Farley (Farley, 1983 and 1991) conducted quasi-static compression and impact tests to
investigate the energy absorption characteristics of the composite tubes. Through his
Woven Fabric Engineering
344
experimental work, he showed that the energy absorption capabilities of Thornel 300-fiberite
and Kevlar-49-fiberite 934 composites are a function of crushing speed. He concluded that
strain rate sensibility of these composite materials depends on the relationship between the
mechanical response of the dominant crushing mechanism and the strain rate. Hamada and
Ramakrishna (Hamada & Ramakrishna, 1997) also investigate the crush behavior of composite
tubes under axial compression. Carbon polyether etherketone (PEEK) composite tubes were
tested quasi-statically and dynamically showing progressive crushing initiated at a chamfered
end. The quasi-staticlly tested tubes display higher specific energy absorption as a result of
different crushing mechanisms attributed to different crushing speeds. Mamalis et al.
(Mamalis et al., 1997 and 2005) investigated the crush behavior of square composite tubes
subjected to static and dynamic axial compression. They reported that three different crush
modes for the composite tubes are included, stable progressive collapse mode associated with
large amounts of crush energy absorption, mid-length collapse mode characterized by brittle
fracture and catastrophic failure that absorbed the lowest energy. The load-displacement
curves for the static testing exhibited typical peaks and valleys with a narrow fluctuation
amplitude, while the curves for the dynamically tested specimens were far more erratic. Later
Mamalis et al. (Mamalis et al., 2006) investigated the crushing characteristics of thin walled
carbon fiber reinforced plastic CFRP tubular components. They made a comparison between
the quasi-static and dynamic energy absorption capability of square CFRP.
The high cost of the experimental test and also the development of new finite element codes
make the design by means of numerical methods very attractive. Mamalis et al. (Mamalis et
al., 2006) used the explicit finite element code LS-DYNA to simulate the crush response of
square CFRP composite tubes. They used their experimental results to validate the
simulations. Results of experimental investigations and finite element analysis of some
composite structures of a Formula One racing car are presented by Bisagni et al.( Bisagni et
al., 2005) . Hoermann and Wacker (Hoermann & Wacker, 2005) used LS-DYNA explicit code
to simulate modular composite thermoplastic crash boxes. El-Hage et al. (El-Hage et al.,
2004) used finite element method to study the quasi-static axial crush behavior of
aluminum/composite hybrid tubes. The hybrid tubes contain filament wound E glass-fiber
reinforced epoxy over-wrap around an aluminum tube.
Although there is several published work to determine the crash characteristics of metallic
and composite columns, only few attempts have been made to optimize those behaviors.
Yamazaki and Han (Yamazaki & Han, 1998) used crashworthiness maximization techniques
for tubular structures. Based on numerical analyzes, the crash responses of tubes were
determined and a response surface approximation method RSM was applied to construct an
approximative design sub-problems. The optimization technique was used to maximize the
absorbed energy of cylindrical and square tubes subjected to impact crash load. For a given
impact velocity and material, the dimensions of the tube such as thickness and radius were
optimized under the constraints of tube mass as well as the allowable limit of the axial
impact force. Zarei and Kroeger (Zarei & Kroeger, 2006) used Multi design objective MDO
crashworthiness optimization method to optimize circular aluminum tubes. Here the MDO
procedure was used to find the optimum aluminum tube that absorbs the most energy
while has minimum weight.
This study deals with experimental and numerical crashworthiness investigations of square
and hexagonal composite crash boxes. Drop weight impact tests are conducted on
composite crash boxes and the finite element method is used to reveal more details about
crash process. Thin shell elements are used to model the tube walls. The crash experiments
Crashworthiness Investigation and Optimization of Empty and Foam Filled Composite Crash Box
345
show that tubes crush in a progressive manner, i.e. the crushing starts from triggered end of
the tubes, exhibit delamination between the layers. Two finite element models, namely
single layer and multi layers, are developed.
In the single layer model, the delamination behavior could not be modeled and the
predicted energy absorption is highly underestimated. Therefore, to properly consider the
delamination between the composite layers, the tube walls are modeled as multi layer shells
and an adequate contact algorithm is implemented to model the adhesion between them.
Numerical results show that in comparison to the one layer method, the multi layer method
yield more meaningful and accurate experimental results. Finally the multi design
optimization MDO technique is implemented to identify optimum tube geometry that has
maximum energy absorption and specific energy absorption characteristics.
The length, thickness (number of layers) and width of the tubes are optimized while the
mean crash load is not allowed to exceed allowable limits. The D-optimal design of
experiment and the response surface method are used to construct sub-problems in the
sequentially optimization procedure. The optimum tube is determined that has maximum
reachable energy absorption with minimum tube weight. Finally the optimum composite
crash box is compared with the optimum aluminum crash box. Also the crash behaviour of
foam filled composite crash boxes are investigated and compared with empty ones.
2. Experimental and numerical results
Axial impact tests were conducted on square and hexagonal composite crash boxes. The
nominal wall thicknesses of the composite tubes are 2 mm, 2.4 mm and 2.7 mm. Square
tubes with length of 150 mm and hexagonal tube with the length of 91 mm are used, see
Figure 1. The specimens are made from woven glass-fiber in a polyamide matrix,
approximately 50% volume fiber. Equal amount of fibers are in the two perpendicular main
orientations. They are produced by Jacob Composite GmbH. Similar tubes are used in the
bumper system of the BMW M3 E46 as well as E92 and E93 model as crash boxes.
A 45 degree trigger was created at the top end of the specimens. Generally injection
moulding can be used to produce complex reinforced thermoplastics parts with low fiber
length/fiber diameter aspect ratio. With increasing aspect ratio the crush performance
increases but the flow ability of the material decreases. For this reason continuous reinforced
thermoplastic have to be thermoformed. In this way and by using other post processing
technologies like welding, complex composite parts with an excellent crush performance
can be realized (Hoermann & Wacker, 2005). Here, the crash boxes are produced from
thermoplastic plates by using thermoforming technique. The square specimens have overlap
in one side and the overlaps have been glued by using a structural adhesive. The hexagonal
crash boxes consist of two parts that are welded to each other.
The experimental tests have been conducted on the drop test rig, see Fig. 2, which is
installed in the Institute of Dynamics and Vibrations at the Leibniz University of Hannover.
This test rig has an impact mass which can be varied from 20 to 300 kg. The maximum drop
height is 8 m and maximum impact speed is 12.5 m/s. The force and the displacement are
recorded with a PC using an AD-converter. The force is measured using strain gauges and
laser displacement sensors provide the axial deformation distance of the tubes. Here an
impact mass of 92 kg was selected. The interest in this study is the mean crashing load P
m
and the energy absorption E. The mean crash load is defined by
Woven Fabric Engineering
346
()
0
1/
m
PPd
δ
δ
δδ
=
∫
(1)
where P(δ) is the instantaneous crash load corresponding to the instantaneous crash
displacement d. The area under the crash load–displacement curve gives the absorbed
energy. The ratio of the absorbed energy to the crush mass of the structure is the specific
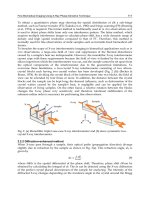
energy absorption. High values indicate a lightweight absorber. Figure 1 shows the
geometry of the specimens.
Fig. 1. (a) Square crash box (b) hexagonal crash box
Fig. 2. Test rig
Numerical simulations of crash tests are performed to obtain local information from the
crush process. The modeling and analysis is done with the use of explicit finite element
h
max
=8 m
v
max
=12.5 m/s
Specime
n
Laser displacement
sensor
Mass=20-300 k
g
Measurement of load
PC + AD
Convertor
Crashworthiness Investigation and Optimization of Empty and Foam Filled Composite Crash Box
347
code, LS-DYNA. The column walls are built with the Belytschko-Tsay thin shell elements
and solid elements are used to model the impactor. The contact between the rigid body and
the specimen is modeled using a node to surface algorithm with a friction coefficient of μ=
0.2. To take into account the self contact between the tube walls during the deformation, a
single surface contact algorithm is used. The impactor has been modeled with the rigid
material. The composite walls have been modeled with the use of material model #54 in LS-
DYNA. This model has the option of using either the Tsai-Wu failure criterion or the Chang-
Chang failure criterion for lamina failure. The Tsai-Wu failure criterion is a quadratic stress-
based global failure prediction equation and is relatively simple to use; however, it does not
specifically consider the failure modes observed in composite materials (Mallick, 1990).
Chang-Chang failure criterion (Mallick, 1990) is a modified version of the Hashin failure
criterion (Hashin, 1980) in which the tensile fiber failure, compressive fiber failure, tensile
matrix failure and compressive matrix failure are separately considered. Chang and Chang
modified the Hashin equations to include the non-linear shear stress-strain behavior of a
composite lamina. They also defined a post-failure degradation rule so that the behavior of
the laminate can be analyzed after each successive lamina fails. According to this rule, if
fiber breakage and/or matrix shear failure occurs in a lamina, both transverse modulus and
minor Poisson’s ratio are reduced to zero, but the change in longitudinal modulus and shear
modulus follows a Weibull distribution. On the other hand, if matrix tensile or compressive
failure occurs first, the transverse modulus and minor Poisson’s ratio are reduced to zero,
while the longitudinal modulus and shear modulus remain unchanged. The failure
equations selected for this study are based on the Chang-Chang failure criterion. However,
in material model #54, the post-failure conditions are slightly modified from the Chang-
Chang conditions. For computational purposes, four indicator functions e
f
, e
c,
e
m,
e
d
corresponding to four failure modes are introduced. These failure indicators are based on
total failure hypothesis for the laminas, where both the strength and the stiffness are set
equal to zero after failure is encountered,
(a) Tensile fiber mode (fiber rupture),
22 2
aa f aa t ab
0 faild
0, and e=(/x) (/S)1
0elastic
c
σσζσ
≥⇒
⎧
⎪
>+−
⎨
⎪
>⇒
⎩
(2)
Where ζ is a weighting factor for the shear term in tensile fiber mode and 0<ζ<1.
E
a
=E
b
=G
ab
=υ
ab
=υ
ba
=0 after lamina failure by fiber rupture.
(b) Compressive fiber mode (fiber buckling or kinking),
22
aa c aa c
0faild
0, and e =( /x ) 1
0 elastic
σσ
≥⇒
⎧
⎪
>−
⎨
⎪
>⇒
⎩
(3)
E
a
=υ
ab
=υ
ba
=0 after lamina failure by fiber buckling or kinking.
(c) Tensile matrix mode (matrix cracking under transverse tension and in-plane shear),
22 2
bb bb t ab c
0 faild
0, and e =( /y ) ( /S ) 1
0elastic
m
σσζσ
≥⇒
⎧
⎪
>+−
⎨
⎪
>⇒
⎩
(4)
Woven Fabric Engineering
348
E
a
=G
ab
=υ
ab
=0 after lamina failure by matrix cracking
(d) Compressive matrix mode (matrix cracking under transverse compression and in-plane
shear),
22 2 2
bb d bb c bb c bb c
0faild
0, and e =( /2S ) (y /2 ) 1 /y ( /2S ) 1
0 elastic
cc
S
σσ σσ
≥⇒
⎧
⎪
⎡⎤
>+−+−
⎨
⎣⎦
⎪
>⇒
⎩
(5)
E
b
= υ
ab
=υ
ba
=0→ G
ab
=0 after lamina failure by matrix cracking
In Equations (2)–(5), σ
aa
is the stress in the fiber direction, σ
bb
is the stress in the transverse
direction (normal to the fiber direction) and σ
ab
is the shear stress in the lamina plane aa-bb.
The other lamina-level notations in Equations (2)–(5) are as follows: x
t
and x
c
are tensile and
compressive strengths in the fiber direction, respectively. Y
t
and y
c
are tensile and
compressive strengths in the matrix direction, respectively. S
c
is shear strength; E
a
and E
b
are
Young’s moduli in the longitudinal and transverse directions, respectively. Here, to model
the trigger, two elements with progressively reduced thicknesses were placed in the triggers
zone. The tied surface to surface contact algorithm has been used to glue the overlapping
walls.
Tables 1 and 2 show the test results of the square and hexagonal composite tubes . Here, the
area under crush load-displacement curve is considered as energy absorption E. The
maximum crush load P
max
is a single peak at the end of the initial linear part of the load
curve. The mean crush load P
m
has been determined with the use of Equation (1). The
maximum crush displacement S
max
is the total displacement of the impactor after contact
with the crash box. The values of specific energy absorption SEA, which is the energy
absorption per crush weight, and the crush load efficiency η, which is the ratio of the mean
crush load and maximum crush load, are also presented in these tables.
Figure 3 shows the specimen (S-67) and (S-75) after crush, respectively. Relatively ductile
crush mode can be recognized. The tubes are split at their corners. This splitting effect is
initiated at the end of the linear elastic loading phase, when the applied load attains its peak
value P
max
. The splitting of the corners of the tube is followed by an immediate drop of the
crush load, and propagation parallel to the tube axis results in splitting of the tube in several
parts. Simultaneous of splitting, some of these parts are completely splayed into two fronds
which spread outwards and inwards and some parts are split only partially. Subsequent to
splitting, the external and internal fronds are bended and curled downwards and some
additional transverse and longitudinal fracture happened.
Photographs from high speed camera for different impact moments are presented in
Figures 4 and 5. Here it can be seen that local matrix and fiber rupture results in a formation
of pulverized ingredients material just after initial contact between impactor and crash
boxes. As compressive loading proceeds, further fragments are detached from the crash box.
Furthermore, the crush performance of tests has been simulated with the use of LS-DYNA
explicit code. Figure 6 shows the experimental and simulated crush load-displacement and
energy absorption-displacement curves of tests (S-67) to (S-69).
The same results for hexagonal crash boxes, tests (S-75) to (S-77), are presented in Figure 7.
The crush-load displacement curves indicate that the mean crush load of simulation is
obviously lower than experimental results. The numerical simulation can not cover the
experiments very good.
Crashworthiness Investigation and Optimization of Empty and Foam Filled Composite Crash Box
349
Test No.
V
[m/s]
t
[mm]
P
max
[kN]
P
m
[kN]
S
max
[mm]
E
[J]
SEA
[J/kg]
η
[%]
S-67 10.3 2.4 77.2 40.6 126.9 4956 41844 53
S-68 10.4 2.4 75.3 46.03 118.9 5053 45533 61
S-69 10.2 2.4 83.7 43.3 117.3 4923 44967 52
S-70 10.4 2.7 82.2 58.7 86.2 5075 55542 71
S-71 10.4 2.7 92.3 59.3 84.7 5024 55957 64
Table 1. Experimental dynamic test on square composite tube
Test No.
V
[m/s]
t
[mm]
P
max
[kN]
P
m
[kN]
S
max
[mm]
E
[J]
SEA
[J/kg]
η
[%]
S-72 7.3 2.0 51 42.6 72.8 3103 35681 83
S-73 7.3 2.0 55 45.5 68.3 3109 35750 83
S-74 7.3 2.0 46 37.9 78.2 2964 34083 82
S-75 8.4 2.4 72 53.7 76.95 4133 39604 75
S-76 8.4 2.4 81 69.4 61.03 4235 40582 86
S-77 8.9 2.4 72 65.6 71.4 4683 44875 91
S-78 8.3 2.7 83 66.9 59.96 4012 34173 81
S-79 8.3 2.7 80 68.4 58.6 4008 34139 86
S-80 8.8 2.7 84 58.8 75.5 4442 37836 70
Table 2. Experimental dynamic test on hexagonal composite tube
Fig. 3. Crush pattern of square tube S-67 (left) and hexagonal tube S-75 (right)
Woven Fabric Engineering
350
Fig. 4. Crush pattern of a square composite tube (S-67) for different crush moments
Fig. 5. Crush pattern of a hexagonal composite tube (S-75) for different crush moments
The energy absorption E and specific energy absorption SEA of the experiments and
simulations at the same crush length (80 mm for square tubes and 60 mm for hexagonal
ones) are presented in Table 3. Here, index S indicates simulation results. Again, it can be
seen that the numerical simulations highly underestimate the tube crush behavior. The
numerical crush patterns show the tube experiences the progressive crushing with some
damages in tube walls instead of splitting and spreading, see Figure 8 and 9. It is evident
that the total energy absorption of the composite tube is the sum of the energy needed for
splitting of the tube corners, delamination and spreading of tube walls into two inwards and
outwards fronds, bending and curling of each fronds, fracture and damage created in fronds
during bending, fragmentations of tube walls and friction between the impactor and
inwards and outwards fronds. The single layer finite element model does not have the
capability to consider all aspects of crushing damages observed experimentally. Therefore, a
new finite element model has to be developed to overcome this problem.
Crashworthiness Investigation and Optimization of Empty and Foam Filled Composite Crash Box
351
0
10
20
30
40
50
60
70
80
90
0 50 100 150
Displacement [mm]
Crush Load [kN]
Test No. S-67
Test No. S-68
Test No. S-69
Simulation
0
1
2
3
4
5
6
0 50 100 150
Displacement [mm]
Energy Absorption [kJ]
Test No. S-67
Test No. S-68
Test No. S-69
Simulation
Fig. 6. Comparison between experimental and numerical (single layer method) crush load-
displacement curves (left) and energy absorption-displacement curves (right) of square
composite tubes
Test No. E [J] SEA [J/kg] Es [J] SEAS [J/kg] Difference [%]
S-67 3259 43647 2686 35973 -17.6
S-68 3682 49313 - - -27.1
S-69 3520 47143 - - -23.7
S-75 3718 54035 2890 42002 -22.3
S-76 4170 60604 - - -30.7
S-77 3930 57116 - - -26.5
Table 3. Comparison between experimental and numerical (single layer method) energy
absorption and specific energy absorption of the square and hexagonal tubes
Fig. 7. Comparison between experimental and numerical (single layer method) crush load-
displacement curves (left) and energy absorption-displacement curves (right) of hexagonal
composite tubes
0
0.5
1
1.5
2
2.5
3
3.5
4
4.5
5
0 20406080100
Displacement [mm]
Energy Absorption [kJ]
Test No. S-75
Test No. S-76
Test No. S-77
Simulation
0
20
40
60
80
100
0 20406080100
Displacement [mm]
Crush Load [kN]
Test No. S-75
Test No. S-76
Test No. S-77
Simulation
Woven Fabric Engineering
352
3. Advanced finite element model
The numerical crush behavior of the composite crash box are shown above for tube walls
modeled with only one layer of shell elements, simulated crush pattern are quite different
from experiment. The delamination, a main energy absorption source of composite crash
boxes, can not be modeled and, therefore, the predicted energy absorption by the simulation
is highly underestimated. Several methods have been used by the researchers to model the
delamination growth in composite materials, including the virtual crack extension technique
(Farley & Jones, 1992), stress intensity factor calculations (Hamada & Ramakrishna, 1997),
stresses in a resin layer (Kindervater, 1995), and, the virtual crack closure technique
(Fleming & Vizzini, 1996).
Fig. 8. Crush pattern of single layer finite element model of square composite tube
Fig. 9. Crush pattern of single layer finite element model of hexagonal composite tube
However, choices for modeling delamination using conventional finite element crush codes
are more limited. Good correlations are obtained in many cases using models that do not
fully capture all aspects of crushing damage observed experimentally. They only provide
sufficient attention to the aspects of crushing that mostly influence the response. Models of
Crashworthiness Investigation and Optimization of Empty and Foam Filled Composite Crash Box
353
composite structures using in-plane damaging failure models to represent crushing
behavior are used in (Haug et al., 1991), (Johnson et al., 1996 and 1997), (Feillard, 1999) and
(Kohlgrueber & Kamoulakos, 1998). These models appear to be effective for structures
whose failure modes are governed by large-scale laminate failure and local instability.
However, crushing behavior in which wholesale destruction of the laminate contributes
significantly to the overall energy absorption cannot be accurately modeled by this
approach (Fleming, 2001). Further, if delamination or debonding forms a significant part of
the behavior, specialized procedures must be introduced into the model to address this
failure mechanism . Kohlgrueber and Kamoulakos (Kohlgrueber & Kamoulakos, 1998)and
Kerth et al. (Kerth et al., 1996) used tied connections with a force-based failure method to
model the delamination in composite materials. By this method, nodes on opposite sides of
an interface where delamination is expected are tied together using any of a variety of
methods including spring elements or rigid rods. If the forces produced by these elements
exceed some criterion, the constraint is released. The primary disadvantage of this method is
that there is no strong physical basis for determining the failure forces. Reedy et al. (Reedy
et al., 1997) applied cohesive fracture model for the same reason. This method is similar to
the previous method. However, instead of relying on simple spring properties the force-
displacement response of the interfacial elements is based on classical cohesive failure
behavior. Virtual crack closure technique is often used by researchers in the area of fracture
mechanics. Energy release rates are calculated from nodal forces and displacements in the
vicinity of a crack front. Although the method is sensitive to mesh refinement, but not so
sensitive like the other fracture modelling techniques, those requiring accurate calculation of
stresses in the singular region near a crack front. Further, the use of conventional force and
displacement variables obviates the need for special element types that are not available in
conventional crash codes.
In this study for the delamination, tube walls are modeled with two layers of shell elements.
The thickness of each layer is equal to the half of the tube wall thickness [130]. To avoid
tremendous increase of the required simulation time, a larger number of layers is avoided.
The surface to surface tiebreak contact is used to model the bonding between the bundles of
plies of the tube walls. In this contact algorithm the tiebreak is active for nodes which are
initially in contact. Stress is limited by the perfectly plastic yield condition. For ties in
tension, the yield condition is
22
nsp
[( 3| |)/ ] 1
σσε
√
+≤ (6)
Where ε
p
is the plastic yield stress and σ
n
and σ
s
are normal and shear stresses, respectively.
For ties in compression, the yield condition is
2
sp
[(3| |)/ ] 1
σε
√
≤
(7)
The stress is also scaled by a damage function. The damage function is defined by a load
curve with starts at unity for crack width of zero and decays in some way to zero at a given
value of the crack opening (Hallquist, 1998)], see Figure 10. The surface to surface tied
contact is implemented between the overlapped walls and single surface contact is used for
each layer. The node to surface contact is applied between rigid impactor and composite
layers. To model the rupture at the corners of the tube, the vertical sides of the tube have
offset 0.5 mm and deformable spot-welds are used to connect the nodes of the vertical sides.
Woven Fabric Engineering
354
The spot-welds are defined by the use of material number #100 in LS-DYNA
(MAT_SPOTWELD). Based on this material model, beam elements, based on Hughes-Liu
beam formulation, are placed between the tube walls and contact-spotweld algorithm ties
the beam elements to the tube shell elements. The normal strength of spot-welds is
calculated from the transverse tensile strength of the composite material.
Critical crack length
0
0.2
0.4
0.6
0.8
1
00.511.5
Normalized Crack Length
Damage Function
Fig. 10. Variation of damage function
To account for the reduced strength of the composite material at the corners, material
strength is reduced by 50%. The shear strength is considered as half of the normal strength.
In order to model the trigger, the length of the outer layer of the composite tube is a little bit
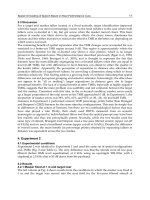
smaller than the inner layer. The crush patterns of the multi layer square and hexagonal
crash boxes are presented in Figures 11 and 12. Here it is possible to see the delamination
which starts in some tube walls and propagates during the crush process.
Fig. 11. Crush pattern of multi layer finite element model of square composite tube
Crashworthiness Investigation and Optimization of Empty and Foam Filled Composite Crash Box
355
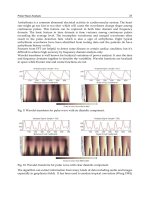
The Figures 13 and 14 left compare the crush load-displacement curves of experimental and
numerical impact on square and hexagonal crash boxes, respectively. Acceptable
correlations are reached between experiments and simulations. In addition the experimental
and numerical energy absorption is presented in Figure 13 and Figure 14 right. The multi
layers method can predict the energy absorption of the crash box very well.
Fig. 12. Crush pattern of multi layer finite element model of hexagonal composite tube
0
10
20
30
40
50
60
70
80
90
0 50 100 150
Displacement [mm]
Crush Load [kN]
Test No. S-67
Test No. S-68
Test No. S-69
Simulation
0
1
2
3
4
5
6
0 20 40 60 80 100 120 140
Displacement [m]
Energy Absorption [kJ]
Test No. S-67
Test No. S-68
Test No. S-69
Simulation
Fig. 13. Comparison between experimental and numerical (multi layers method) crush load-
displacement curves (left) and energy absorption-displacement curves (right) of square
composite tubes
4. Multi design optimization of crush behavior of square composite crash box
There are high interests to find the effect of composite tube geometry on its energy
absorption capability. Generally, variation in tube geometry influences the fracture
mechanisms and, therefore, the energy absorption capability. Thornton and Edwards
(Thornton and Edwards, 1982) investigated the crush performance of square, rectangular
and circular composite tubes. They concluded that for a given fiber lay up and tube
geometry, circular tubes have the highest specific energy absorption followed by square and
Woven Fabric Engineering
356
rectangular tubes. Farley (Farley, 1986) investigated the effect of geometry on the energy
absorption capability of the composite tubes. He conducted a series of quasi-static crash
tests of Graphite/Epoxy and Kevlar/Epoxy composite tubes with the ply orientation of ±45
degree. He found that the tube diameter to wall thickness ratio d/t has significant effects on
the energy absorption capability. The energy absorption was found to be a decreasing
nonlinear function of tube d/t ratio. A reduction in d/t ratio increases the specific energy
absorption of the tube. Similar result has been reported by Farley and Jones (Farley & Jones,
1992) for elliptical composite tubes.
0
20
40
60
80
100
120
0 20406080
Displacement [mm]
Crush Load [kN]
Test No. S-75
Test No. S-76
Test No. S-77
Simulation
0
0.5
1
1.5
2
2.5
3
3.5
4
4.5
5
0 20406080100
Displacement [mm]
Energy Absorption [kJ]
Test No. S-75
Test No. S-76
Test No. S-77
Simulation
Fig. 14. Comparison between experimental and numerical (multi layers method) crush load-
displacement curves (left) and energy absorption-displacement curves (right) of hexagonal
composite tubes
Zarei and Kroeger (Zarei & Kroeger, 2006) used Multi design objective MDO
crashworthiness optimization method to optimize circular aluminum tubes. Here, the same
optimization procedure is used to find optimum composite crash box. The finite element
method is used to calculate the absorbed energy and specific absorbed energy of the tubes.
The design variables are the tube thickness (number of layers), width and length of the
composite tubes. The composite tubes with the thickness between 1 mm and 4 mm are
selected while the tube width is varied between 70 mm and 120 mm and the tube length
between 100 mm and 350 mm. Here 0.5 mm thickness is considered for each layer of
composite tube. To have acceptable crush performance in oblique crash conditions, the tube
width lower than 70 mm is not considered. An impact force constraint is usually required to
reduce the occupant injury when passenger vehicles are considered. Therefore, in the
optimization process, the mean crush load P
m
should not exceed the allowable limit P
ma
i.e.:
g= Pm/Pma-1≤0. (8)
Where Pma=68.5 kN is selected in this research. The optimization problem can be rewritten
as follows
Maximize energy absorption E and specific energy absorption SEA of tube
Subjected to
0.5 mm ≤ t ≤ 3.0 mm,
100 mm ≤ l ≤ 350 mm,
50 mm ≤ d ≤ 120 mm,
P
m
≤ 68.5 kN.
Crashworthiness Investigation and Optimization of Empty and Foam Filled Composite Crash Box
357
The optimization procedure which is presented in Figure 15 is applied to the maximization
of absorbed energy and specific absorbed energy of the composite tube under axial impact
load. Since the interest is to find the crush behavior of tubes up to the final effective crush
length, all tubes are encountered with a large amount of impact energy. Here 75 percent of
tube length is considered as effective crush length. In order to reduce the optimization time,
the single layer finite element models are used to find the energy absorption of composite
tubes in every subproblem and the final optimum tube is modeled as a multi layer
composite tube.
Fig. 15. Flowchart of the optimization process
Table 4 shows the final optimum composite tube that absorbs maximum energy with
minimum weight. Here it can be seen that the optimum tube thickness t is 3 mm (N
l
=6
layers). The thicker tube will have mean crush load higher than allowable limit. The variable
d coincides with the lower bound which shows an increase of the crashworthiness efficiency
by reduction of tube width. But here values lower that 70 mm are not allowed to guarantee
enough bending resistance of the composite crash box in oblique crash conditions. The tube
length coincides with the upper bound but in order to avoid global buckling, longer tubes
are not considered. Previously the MDO procedure was used to find optimum aluminum
tubes. There, to avoid global buckling in the aluminum tubes the maximum allowed tube
length to width ratio is set to l/d≤3 based on experimental observations (Mamalis et al.,
2005) and (Hanssen et al., 1999 and 2000). In order to compare crashworthiness behavior of
the optimum composite and aluminum crash boxes, this new optimization constraint is
considered for composite crash tube. Table 5 shows the results of optimum composite and
Define Optimization Problem
Decide Analysis Design Point by D-optimality DOE method
Desi
g
n-o
f
-Ex
p
eriment
Carr
y
out Crash Simulation
Construct Approximated Response Surfaces RSM
Optimize Design Parameter Based on RSM
Judge on
Convergenc
No
Yes
Stop
Confirmation for Optimal Desi
g
n
Add Design
Points/ Reconstruct
RSM
Woven Fabric Engineering
358
aluminum crash boxes. It can be seen that the composite tube absorbs about 17 percent more
energy than aluminum crash box while it has about 27 percent lower weight.
Tube type
T; N
l
[mm; -]
d
[mm]
l
[mm]
E
[J]
SEA
[J/kg]
Square composite 3; 6 70 350 15316 35580
Table 4. Optimum square composite tube
Tube Type
t
[mm]
d
[mm]
l
[mm]
E
[J]
Increase
[%]
SEA
[J/kg]
Increase
[%]
Square aluminum 2.1 70 210 7602 - 26124 -
Square composite 3 70 210 9198 17.4 35716 26.9
Table 5. Comparison between optimum composite and optimum aluminum crash boxes
5. Crush performance investigation of foam-filled composite crash box
Here, Alporas aluminum foam with a relative density of 0.085 is used to produce foam filled
square composite crash box. Dynamic compression tests were conducted on them. The
composite square tubes with the dimensions which previously presented in Figure 1 are used.
The nominal wall thickness of the composite tubes is 2.4 mm. Dynamic tests were done in
drop weight test rig. Simply support boundary conditions were applied for the tubes. Table 6
shows the results of experimental tests. The crush pattern of test number (F-37) is shown in the
Figure 16. Here, similar to empty composite tubes, the tube is split from its corners. In
comparison to the empty composite tubes, lower delamination area can be seen. The tube is
ruptured from its corners and the foam filler is crushed progressively. Numerical simulations
of crash tests are performed using the explicit finite element code LS-DYNA. The new
developed finite element model in this study is used to describe the composite square tubes,
see section 4. The foam filler is modeled with solid elements and rigid body elements are used
to model the rigid impactor. The contact between the rigid body and the specimen is modeled
using a node to surface algorithm with a friction coefficient of μ=0.2. To account for self contact
between the tube walls during deformation, a single surface contact algorithm is used. The
node to surface contact is implemented between tube walls and foam filler. The composite
walls are modeled with the use of material model #54 in LS-DYNA The aluminum foam was
modeled with the foam model of Dehspande and Fleck (2000) [19] material number #154 in
LS-DYNA. Figure 17 shows that the predicted energy absorption by the simulation is in good
agreement with the experimental one.
Table 7 shows a comparison between energy absorption E and specific energy absorption
SEA of the empty and foam-filled composite square tubes at the 80 mm crash length. Here, it
can be seen that the foam insertion of the composite tube results in higher energy absorption
but unlike the aluminum foam-filled tubes, the specific energy absorption in the composite
filled tubes is decreased in comparison with empty one. As mentioned in the chapter four,
the benefit of using foam inside the crash absorbers is the interaction between foam and
crash absorber walls during crush process. But as one can see in the Figure 16, in the foam-
filled composite tubes, the composite tube is split into four parts and the tube and foam
crushed independently. Here no interaction between tube and foam is taken place. From
Crashworthiness Investigation and Optimization of Empty and Foam Filled Composite Crash Box
359
Figure 3 it can be seen that the empty composite tubes are split into several parts and each
part is splayed into two fronds which spread outwards and inwards. From Figure 16 it is
clear that the foam filler forced the tube parts outward during the crush process and prevent
from splaying of the parts. Therefore no frond is created and delamination between the
composite layers, which is one of the main energy absorption sources of the composite, is
not taken placed. Therefore, the specific energy absorption of the filled composite tube is
lower than empty tubes.
Another interesting result which is extracted from experimental results of dynamic tests on
simple foam filler is that the energy absorption of foam filler is about 4950 J at 80 mm crash
length. That means the some of the energy absorption of the empty composite tube alone
and foam filler alone is higher than energy absorption of the foam-filled composite tube. In
other word not only inserted foam plays no positive roll in the crush process of the filled
composite crash box but also it has destructive effect.
Test
No.
V
[m/s]
t
[mm]
P
max
[kN]
P
m
[kN]
S
max
[mm]
E
[J]
SEA
[J/kg]
η
[%]
F-37 10.4 2.4 85.1 46.9 105.4 4994 34006 55.1
F-38 10.3 2.4 95.1 47.3 97.7 4890 35922 49.7
F-39 10.3 2.4 87.8 46.2 108.5 4954 32770 42.6
Table 6. Experimental dynamic test on foam filed square composite tube
Fig. 16. Crush pattern of foam-filled composite crash box
Test No. Filler type
E
[J]
Increase
[%]
SEA
[J/kg]
Increase
[%]
Average of S-67, S-68, S-69 - 3487 - 46701 -
Average of F-37, F-38-F-39 Foam 3832 9.0 34233 -26.7
Table 7. Comparison between empty and foam-filled composite tubes
Woven Fabric Engineering
360
0
20
40
60
80
100
120
0 50 100
Displacement [mm]
Crash Load [kN]
Test No. F-37
Test No. F-38
Test No. F-39
Simulation
0
1
2
3
4
5
0 50 100
Displacement [mm]
Energy Absorption [kJ]
Test No. F-37
Test No. F-38
Test No. F-39
Simulation
Fig. 17. Comparison between experimental and numerical (multi layers method) crush load-
displacement curves (left) and energy absorption-displacement curves (right) of square
composite foam-filled tubes
6. Conclusion
Experimental crash tests on square and hexagonal composite crash boxes showed that
unlike metallic crash boxes which are crushed in a progressive buckling manner, the
composite tubes are crushed in a progressive damaging manner.
A new multi layer finite element model was developed to simulate the crush process of the
composite crash box.
The MDO procedure was used to find an optimum design of the composite crash box. The
comparison between crashworthiness behavior of the optimum composite and aluminum
crash boxes showed that the composite crash box absorbs about 17 percent more energy
than the aluminum crash box while it has about 27 percent higher SEA.
For light weight crash box or bumper beam designs, low density metal fillers, such as
aluminum honeycomb or foam, are superior to tubes and beams with thicker walls in terms
of achieving the same energy absorption. The crush performance of foam-filled square
composite crash box was investigated experimentally and numerically. The results showed
that the foam insertion results in higher energy absorption but unlike the aluminium foam-
filled tubes, the specific energy absorption of the composite filled tubes is decreased in
comparison with empty one.
7. References
Bisagni, C.; Pietro, GD.; Fraschini, L. & Terletti, D. (2005). Progressive crushing of fiber-
reinforced composite structural component of a formula one racing car.
Compos.
Struct
., Vol. 68, 491–503
Chang, FK. & Chang, KY. (1987). Post-failure analysis of bolted composite joints in tension
and shear-out mode failure.
J. Compos. Mater., Vol. 21, 809–33
Crashworthiness Investigation and Optimization of Empty and Foam Filled Composite Crash Box
361
El-Hagel, H.; Mallick, PK. & Zamani, N. (2004). Numerical modeling of quasistatic axial
crash of square aluminum-composite hybrid tubes.
Int. J. Crashworthiness, Vol. 9,
No. 6, 653–64
Farley, G.L. (1991). The effects of crushing speed on the energy-absorption capability of
composite tubes.
J. Compos. Mater., Vol. 25, No. 10, 1314–29.
Farley, G.L. (1983). Energy absorption of composite materials.
J. Compos. Mater., Vol. 17, No.
3, 267–79
Farley, GL. (1986). Effect of specimen geometry on the energy absorption capability of
composite tubes.
J. Compos. Mater., Vol. 20, 390–400
.
Farley, GL. & Jones, RM. (1992). Prediction of the energy-absorption capability of composite
tubes.
J. Compos. Mater., Vol. 26, No. 3, 388–404
Fleming, DC. & Vizzini, AJ. (1996). Off-axis energy absorption characteristics of composites
for crashworthy rotorcraft design.
J. American Helicopter Soc., Vol. 41, No. 3, 239–46
Fleming, DC. (2001). Delamination modeling of composite for improved crash analysis.
J.
Compos. Mater
., Vol. 35, No. 19, 1777–92
Feillard, P. (1999). Crash modeling of automotive structural parts made of composite
materials,
Proceedings of the SAE international congress and exposition, March 1–4,
Detroit, MI
Jacob, GC.; Simunovic, JFS. & Starbruk, JM. (2002). Energy absorption in polymer composite
for automotive crashworthiness.
J. Compos. Mater., Vol. 36, No.7, 813–50
Johnson, AF.; Kindervater, CM.; Kohlgrueber, D. & Luetzenburger, M. (1996). Predictive
methodologies for the crashworthiness of aircraft structures,
Proceedings of the 52nd
american helicopter society annual forum
, pp. 1340–52, June 4–6, Washington DC
Johnson, AF. & Kohlgrueber, D. (1997). Modeling the crash response of composite
structures.
J. Phys. IV France, Colloque C3, Supple
´
ment au Journal de Physique III, Vol.
7, C3-981–6 (in English).
Hallquist, JO. (1998).
LS-DYNA theoritical manual. Livermore Software Technology
Corporation
Hamada, H.; Ramakrishna, SA. (1997). FEM method for prediction of energy absorption
capability of crashworthy polymer composite materials.
J. Reinf. Plast. Compos., Vol.
16, No. 3, 226–42
Hanssen, AG.; Langseth, M. & Hopperstad, OS. (1999). Static crushing of square aluminum
extrusions with aluminum foam filler.
Int. J. Mech. Engng., Vol. 41, 967-993
Hashin, Z. (1980). Failure criteria for unidirectional fiber composites.
J. Appl. Mech., Vol. 47,
329–34
Haug, E.; Fort, O.; Tramecon, A.; Watanabe, M. & Nakada, I. (1991). Numerical
crashworthiness simulation of automotive structures and components made of
continuous fiber reinforced composite and sandwich assemblies.
SAE technical paper
series 910152
Hoermann, M. & Wacker, M, (2005). Simulation of the crash performance of crash boxes
based on advanced thermoplastic composite,
Proceedings of the 5th European LS-
DYNA users conference, pp. 25–6, UK, May ,Birmingham
Hull, D. (1982). Energy absorption of composite materials under crash displacement
variables obviates the need for special element types that are not available in crash
Woven Fabric Engineering
362
codes, Proceeding of the 4th international conference on composite materials: progress in
science and engineering of composites
, pp. 861–87, Japan, Tokyo
Kerth, S.; Dehn, A.; Ostgathe, M. & Maier M. (1996) Experimental investigation and
numerical simulation of the crush behavior of composite structural parts,
Proceedings of the 41st international SAMPE symposium and exhibition, pp. 1397–408
Kindervater, CM. (1995). Crash resistant composite helicopter structural concepts thermoset
and thermoplastic corrugated web designs,
Proceedings of the AHS national technical
specialists meeting on advanced rotorcraft structures
, Williamsburg, VA
Kohlgrueber, D. & Kamoulakos, A. (1998). Validation of numerical simulation of composite
helicopter sub-floor structures under crash loading,
Proceedings of the 54th American
helicopter society annual forum
, May 20–22 Washington DC
Mamalis, AG.; Manolakos, DE.; Demosthenous, GA. & Ioannidis, MB. (1997). The static and
dynamic axial crumbling of thin-walled fiberglass composite square tubes.
Composites Part B, Vol.28B, No. 4, 439–51
Mamalis, AG.; Manolakos, DE.; Ioannidis, MB. & Papapostolou, DP. (2005). On the response
of thin-walled composite tubular components subjected to static and dynamic axial
compressive loading: experimental.
Compos. Struct., Vol. 69, 407–20
Mamalis, AG.; Manolakos, DE.; Ioannidis, MB. & Papapostolou, DP. (2006).The static and
dynamic axial collapse of CFRP square tubes: finite element modeling.
Compos.
Struct., Vol. 74, 2213–50
Mallick, PK. (1990)
Fiber reinforced composites. 2nd ed. NY, Marcel Dekker
Ramakrishna, S. (1997). Microstructural design of composite materials for crashworthy
applications.
Mater. Des., Vol.18, 167–73
Reedy, ED.; Mello FJ. & Guess, TR. (1997). Modeling the initiation and growth of
delaminations in composite structures.
J. Compos. Mater., Vol. 31, No. 8, 812–31
Shin, K.C.; Lee, JJ.; Kim, KH.; Song, MC. & Huh, JS. (2002). Axial crash and bending collapse
of an aluminum/GFRP hybrid square tube and its energy absorption capability.
Compos. Struct., Vol. 57, 279–87
Thornton, PH. & Edwards, PJ. (1982). Energy absorption in composite tubes.
J. Compos.
Mater., Vol. 16, 21–45
Yamazaki, K. & Han, J. (1998). Maximization of the crushing energy absorption of tubes.
Struct. Optim., Vol. 16, 37–49
Zarei, HR. & Kroeger, M. (2006). Multiobjective crashworthiness optimization of circular
aluminum tubes.
Thin-Walled Struct. J., Vol. 44, 301–8
Zarei, HR.; Kröger, M. & Albertsen, H. (2007). Crashworthiness investigation of the
composite thermoplastic crash box,
Proceeding of the Sixth Canadian-International
Composites Conference, pp. 1-14, August , Winnipeg
Zarei, HR.; Kröger, M. & Albertsen, H. (2008). An experimental and numerical
crashworthiness investigation of the thermoplastic composite crash boxes.
Comp.
struc. J., Vol. 85, 245-258
19
Effects of the Long-Time Immersion on the
Mechanical Behaviour in Case of Some
E-glass / Resin Composite Materials
Assoc.prof.dr.eng. Camelia CERBU
„Transilvania” University of Braşov, Faculty of Mechanical Engineering,
Romania
1. Introduction
The chapter deals with the actual and difficult problem of analysing the mechanical
structures from the perspective of using composite materials in aggressive environment.
Optimising the mechanical structures, made by composite materials is a great actual and
important problem that includes two of the most modern, difficult and demanded aspects in
mechanical engineering. If we point out this subject, meaning the aggressive environment,
we already have the complete image of an extreme actual, important and special complexity
subject.
The major studies in the field of structural optimising of the components made of composite
materials, followed to obtain structures of components having higher strength and rigidity,
lower weight, under conditions of a lower cost. There have been analysed composite material
components, for which have been varied the material structure for fibre and matrix, the
orientation of the fibres in layers, the shape of component, etc. The present study proposes an
objective and supplementary criterion: the conservation of the mechanical characteristics of
strength and rigidity under the long time action of the aggressive environment factors.
The results presented within this chapter address to the researchers and specialists in the
field of the composite materials, to the ph.d. students and students from master, etc.
Concurrently, reading of this working, may establish a point of start in the researching
activity in this direction because it notes some important remarks regarding the effects of
the aggressive environment (humidity, basic and acid solutions, temperature, thermal
cycles, electrons radiation, UV rays etc) on the degradation of the mechanical characteristics
of some composite materials.
The specialists interested in the field of composite materials will find a rich source of
information by establishing a method of testing the specimens made of composite materials,
subjected to statically forces after maintaining in aggressive environment; recommendations
concerning the polymeric composite structure, having long durability under the action of
the humidity and variations of temperature.
When an organic matrix composite is exposed to humid air or to a liquid, both the moisture
content and temperature of the composite material may change with time. These changes
affect the mechanical characteristics (Corum et al., 2001; Pomies et al., 1995; Cerbu, 2007;
Takeshige et al., 2007).