báo cáo hóa học:" The visual analog rating scale of health-related quality of life: an examination of end-digit preferences" pot
Bạn đang xem bản rút gọn của tài liệu. Xem và tải ngay bản đầy đủ của tài liệu tại đây (211.37 KB, 5 trang )
BioMed Central
Page 1 of 5
(page number not for citation purposes)
Health and Quality of Life Outcomes
Open Access
Research
The visual analog rating scale of health-related quality of life: an
examination of end-digit preferences
Amir Shmueli*
Address: Department of Health Management, The Hebrew University, POB 12272 Jerusalem, Israel
Email: Amir Shmueli* -
* Corresponding author
Visual Analog ScaleEnd-digit preferenceHealth-Related Quality of Life
Abstract
Background: The Visual Analog Scale (VAS) has been extensively used in the valuation of health-
related quality of life (HRQL). The objective of this paper is to examine the measurement error
(rounding) explanation for the higher prevalence of VAS scores ending with a zero, and to provide
an alternative interpretation.
Methods: The analysis is based on more than 4,500 reported VAS valuations of own HRQL,
included in two Israeli health surveys (1993 and 2000). Bivariate and logistic regression analyses are
used.
Results: The results show that reporting VAS scores ending with a 0 ( 20, 0,10,20 ) decreases
and scores ending with a 5 ( 15,-5,5,15,25, ) and with any other integer ( 12, -11, 1,2, ,92, 99)
increases as VAS scores depart from 50, particularly when increasing up to 100. This pattern
remains after controlling for personal characteristics determining the level of VAS.
Discussion: Rounding true HRQL to the nearest 10's or 5's cannot explain the specific pattern
found. It is suggested that this pattern corresponds to a S-shaped value function, where individuals
tend to evaluate their HRQL as "gains" or "losses" relative to a reference point evaluated at 50.
This particular reference score originates from being a traditional "passing threshold" and the
scale's midpoint. Several implications of this interpretation to the measurement of HRQL are
discussed.
Background
Because of its simplicity and practical applicability, the
Visual Analog Scale (VAS) has been widely used to elicit
individuals' health value functions, either through meas-
uring preferences for specific health states [1,2] or through
evaluating their own health-related quality of life (HRQL)
[3-5]. Recently, several studies examined the theoretical
foundation of the VAS in relation to Von-Neumann-Mor-
genstern utility theory, and explored certain measurement
problems such as end of scale aversion and spacing-out
bias [2,6,7].
The present study focuses on end-digit preferences of the
VAS scores, used to evaluate own HRQL. End-digit prefer-
ence in reporting is not new, it was detected in 1940 in
reporting age, and was later detected in blood pressure
Published: 14 November 2005
Health and Quality of Life Outcomes 2005, 3:71 doi:10.1186/1477-7525-3-71
Received: 19 September 2005
Accepted: 14 November 2005
This article is available from: />© 2005 Shmueli; licensee BioMed Central Ltd.
This is an Open Access article distributed under the terms of the Creative Commons Attribution License ( />),
which permits unrestricted use, distribution, and reproduction in any medium, provided the original work is properly cited.
Health and Quality of Life Outcomes 2005, 3:71 />Page 2 of 5
(page number not for citation purposes)
measurement, birth weight recording, and estimated ges-
tational age [8,9]. The relative concentration of reported
VAS scores ending with a 0 has been interpreted, as was
done in the just mentioned studies in other contexts, as
measurement errors, where people "round" their valua-
tions to the nearest 10, while true HRQL is a continuous
variable. However, it is shown that the closer the score is
to 100 (perfect health), the higher the relative frequency
of scores ending with an integer other than 0. Conse-
quently, a different interpretation of the results is based
on the assumption that no rounding is used, and respond-
ents deliberately choose scores ending with 0, 5 or other
integer to accurately reflect their HRQL. That interpreta-
tion, which implies an underlying S-shaped relationship
between the VAS and true HRQL, is discussed.
Methods
The survey data
The data used in this study comes from two full sit-down
health surveys – conducted in 1993 and in 2000 – of the
Israeli Jewish urban population aged 45–75. Stratified (by
settlement size) samples were used to represent the popu-
lation studied. The 1993 survey included 1,999 individu-
als, while the 2000 survey included 2,505 individuals (for
more details see [10]). Preliminary analysis showed that
similar results (see below) are obtained for both years.
Consequently, the final analysis reported below included
the pooled two-year sample.
The measurement of HRQL by the VAS
In both surveys, HRQL was valued in the following way:
A card with a vertical scale ranging from -100 to +100,
with unit marks (1s) and numbers appearing every five
scores (at 5s and 10s), was presented to the respondents.
The respondents were told that zero signifies HRQL asso-
ciated with death, and 100 – HRQL associated with per-
fect health (regardless of age). The interviewers added that
negative values are possible, meaning HRQL worse than
that associated with death. The respondents were asked to
report verbally the number on the above scale, which rep-
resents their general HRQL during the previous month.
The statistical analysis
Bivariate and multivariate logistic regression analyses
were used to show that the probability of VAS scores end-
ing with an integer other than 0 or 5 differs in different
ranges of scores. One may argue that such a pattern origi-
nates from the different characteristics of the respondents
who chose different score ranges rather than from the
scale itself. For example, persons enjoying very high
HRQL might tend to report scores not ending with 0 or 5
more than other individuals. To examine that argument,
selected personal characteristics, which are likely to affect
the reported VAS score, were controlled for. These charac-
teristics included: economic status (a set of 4 dummy var-
iables representing the five categories: excellent, very
good, good, fair and poor), ethnic origin (a set of 3
dummy variables representing the four categories: Asia-
Africa, Europe-America, Israel and post 1990 immigrants
from the former USSR), years of education, gender and
age.
Results
Figure 1 presents the distribution of VAS scores for the two
years combined. The minimum score reported was -20.
The mode of the distribution is 71–80, and the distribu-
tion is skewed to the left. For later reference, note the
somewhat outstanding high frequency of the category 41–
50.
Overall, 89% reported scores ending with 0 ("10s", -20, -
10, 0, 10, ,100), 9% reported scores ending with 5
("5s", -15, -5, 5, 15, 95), and 2% reported a score ending
with another integer ("1s" or all other scores, namely, -19,
-18, 1, 2, 49, 51, 83, 99). Figure 2 presents the
(stacked) percentages of scores ending with 0, 5 and
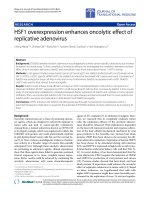
>Proportions of scores ending with 0, 5, and other digits by valuation scoreFigure 2
Proportions of scores ending with 0, 5, and other digits by
valuation score.
75%
80%
85%
90%
95%
100%
<=0
11-20
31-40
51-60
71-80
91-100
10's 5's 1's
The distribution of VAS scoresFigure 1
The distribution of VAS scores.
0%
5%
10%
15%
20%
25%
30%
<=0 11-
20
31-
40
51-
60
71-
80
91-
100
Health and Quality of Life Outcomes 2005, 3:71 />Page 3 of 5
(page number not for citation purposes)
another integer by valuation categories, for the two years
combined. The Figure shows that in the categories "< = 0"
and "41–50", 98–100% of the scores are multiples of 10.
In other words, all the scores below or equal to zero, are -
20, -10 or 0. Similarly, 98% of the scores between (includ-
ing) 41 and 50, equal, actually, 50.
Once the score is greater than 0 and lower than 40, or
greater than 50, the percentages of 10s drop, and the pro-
portions of scores ending with a 5 or another integer
increase. For example, in the category "1–10", 85% of the
scores equal 10, and 15% equal 5. This trend is more pro-
nounced for scores greater than 50: in the 51–60 category,
94% of the scores equal 60, 4.5% equal 55, and 1.2%
equal one of the remaining scores. In the upper category
(91–100), 76% are equal to 100, 15% chose 95, and more
than 9% are other scores in the category (92, 93, etc). The
almost-steady increase in the proportions of scores not
ending with a 0 or with a 5 is clear for scores higher than
40.
In order to test statistically the hypothesis that the propor-
tion of scores ending with 0 is constant across the score-
level categories (as is expected if just rounding was the
issue), a logistic regression of the probability of a score
ending with a 0 was run on the 11 score categories'
dummy indicators. The Likelihood Ratio statistic, testing
the hypothesis that all the score-level categories effects are
equal, was 276.7 (DF = 10), which indicates that the
hypothesis is rejected. Namely, the probabilities of a score
ending with a 0 differ across the score-level categories.
Controlling for the personal characteristics did not change
the results. This means that the variable proportions of
scores ending with a 0 and 5 (and hence of all other
scores) by score range does originate from the VAS prop-
erties and not from the respondents' differing characteris-
tics determining their score category.
Figure 3 shows the same results in terms of deviations of
the actual number of cases from the expected ones, under
a uniform distribution with rates equal the total's propor-
tions of scores ending with a 0, 5 and other scores, by val-
uation score. The actual number of 10s is greater than the
expected one in all scores up to score 80. It increases up to
score range 41–50, and then drops. For score ranges 81–
90 and 91–100, the actual number of 10s is smaller than
the expected one. The deviations in the numbers of scores
ending with a 5 by score range are almost an exact mirror
image of the deviations of the number of 10s. They are
negative and decreasing up to score of 50, and then nega-
tive and increasing up to 70, they continue to increase up
to 90, and drop in the score range 91–100. The pattern of
the deviations in the number of scores not ending with a
0 or 5 is similar to the one of the deviations in the number
of scores ending with a 5, but smoother. Also, the devia-
tions increase steadily from 71–80 up to 91–100.
Discussion
Health-related quality of life (HRQL) is a latent continu-
ous construct. VAS scores provide a measure of that unob-
servable variable. Much experience has shown that the
VAS is easy to obtain, and respondents have no problems
in scoring. The patterns presented above imply a particu-
lar relationship between the VAS reports and HRQL. The
results, as shown in Figure 2 in particular, indicate a dis-
tinctive role for the score of 50. First, it is the score ending
with a 0 with the largest concentration of responses. Sec-
ond, disregarding for a moment negative scores, 98% of
the individual scores within its neighboring score range
are concentrated at its value, the highest concentration
across all score ranges. Consequently, the percentage of
scores ending with an integer other than 0, increases as the
score range furthers away from 50, upward and down-
ward. The score of 50 may be thus considered as an empir-
ical reference or benchmark score (see below for an
interpretation).
Figure 4 presents the relationship between the VAS scores
and true HRQL, which emerges from the above results. In
Figure 4, q
p
, the true HRQL for which the VAS score is 50,
is the true reference point of the scale. Levels of HRQL in
the neighborhood of q
p
are not that different, leading
respondents with HRQL in this range to round their VAS
scores to 50. At that point, the curve is relatively vertical,
since true HRQL is relatively constant. Scores in this range
ending with integers other than 0 (say 41, 42, , 49,
51, 59) indicate approximately the same level of HRQL
– q
p
, so they are almost not reported. It takes 10 units of
the scale (say 40, 60) to indicate a different level of HRQL.
The higher the VAS score (from 50 and up), the larger the
difference in true HRQL (measured horizontally in figure
4) for a given difference in VAS (measured vertically). For
Actual minus expected (under a uniform distribution) number of cases ending with 0, 5, or other digit by valuation scoreFigure 3
Actual minus expected (under a uniform distribution)
number of cases ending with 0, 5, or other digit by valuation
score.
-90
-40
10
60
<=0 11-
20
31-
40
51-
60
71-
80
91-
100
# of cases
10's 5's 1's
Health and Quality of Life Outcomes 2005, 3:71 />Page 4 of 5
(page number not for citation purposes)
VAS>91, each additional point on the score signifies rela-
tively dramatically higher true HRQL. In this category
every point is significant since HRQL is rapidly changing.
For that reason, scores ending with an integer other than
0 are most frequent in this score range. Graphically, this
translates into the curve being relatively flat (put
inversely, the VAS is relatively constant over a relatively
wide range of HRQL), and the curve is concave from
below for HRQL values higher than q
p
.
A similar relationship between the VAS and HRQL holds
for 0<HRQL< q
p
, with the curve being flatter for HRQL
approaching that of death, so that the curve is convex
from below for HRQL lower than q
p
.
A second threshold in the relationship is at HRQL = death,
for which VAS = 0. As was argued above, the VAS for true
HRQL worse than death is quite insensitive to the precise
level of HRQL (scores ending with 0, the curve being
graphically steep), and it takes differences of 10 points to
indicate different levels of true HRQL. This threshold is
defined, however, by the instructions. While the range of
HRQL worse than death is extremely interesting and
important, the analysis of this range is not very reliable, as
only 10 persons (out of 4,504) reported negative scores
on the VAS.
The value function in Figure 4 might represent valuation
in a way similar to the one on which prospect theory is
based [11]. Abstracting from uncertainty issues, prospect
theory suggests that individuals do not evaluate states
(e.g. levels of wealth) in their absolute value (as in Fried-
man-Savage utility theory) but as deviations (monetary
gains or losses) relative to some reference point (e.g. the
present level of wealth). Furthermore, the value function
is concave (diminishing marginal value) for positive devi-
ations (gains) and convex (increasing marginal value) for
negative ones. Finally, the value function is steeper at each
level of negative deviation than at the positive equal devi-
ation. The value function depicted in Figure 4 following
the empirical characteristics of the VAS reports, matches
these characteristics. For non-negative HRQL, individuals
evaluate their HRQL in relation to the reference value q
p
,
which is the level of HRQL evaluated as 50. For HRQL bet-
The implied shape of VAS scores as a function of true health-related quality of lifeFigure 4
The implied shape of VAS scores as a function of true health-related quality of life.
100
50
VAS
HRQL
0
q
p
Perfect
Health
Death
Health and Quality of Life Outcomes 2005, 3:71 />Page 5 of 5
(page number not for citation purposes)
ter than q
p
, individuals consider the difference (HRQL-q
p
)
as a "gain", and report a VAS value accordingly, with
diminishing marginal value. For HRQL worse than q
p
,
individuals consider the difference (HRQL-q
p
) as a "loss",
and report a VAS value accordingly, with increasing mar-
ginal value. As is clear from Figure 2, the value function in
Figure 4 is steeper for negative deviations (HRQL< q
p
)
than for equal but positive deviations (HRQL> q
p
).
The distinctive role of the reference point q
p
evaluated by
50 is suggested by the data. Nevertheless, what can be the
interpretation of these values? Two explanations can be
offered. First, in Israel, as in many other education sys-
tems, the evaluation of the pupils' achievements is done
by a grade on a 0–100 scale. On this scale, a grade of 50 is
usually considered a "passing grade", where lower grades
indicate a failure (in Israel, failing grades are commonly
called "negative grades", reflecting the "loss" with respect
to the passing grade 50 as a reference point recorded as 0).
A second explanation sees 50 as simply the midpoint on
the positive 0–100 scale. The psychometric importance of
scales' midpoint is well known, e.g., the "midpoint bias",
where (too) many respondents tend to choose the mid
category from among an odd number of options.
The significance of q
p
evaluated as the mid-scale 50 is
closely related to the "bisection procedure", where
respondents matched, by a sequence of bisections, a
number (magnitude) to brightness and loudness. This
procedure was found to agree fairly closely with matching
done by magnitude estimation (where numbers are
directly matched to stimuli). Furthermore, for the magni-
tude estimation procedure, it is clearly stated that: " [ ]
stimuli should be presented in a different irregular order
to each subject, but the first stimulus is usually chosen
from among those in the middle region " ([[12], p. 428],
emphasis added).
Conclusion
A critical assumption of all studies using VAS-derived val-
uations is that the VAS is a proper interval scale, namely,
the passage from 2 to 4 (2 points), for example, bears the
same cardinal meaning as the passage from 56 to 58, and
from 98 to 100 (as with a thermometer), with 0 and 100
arbitrarily chosen as reference points. If that assumption
holds true, the analysis in this paper showed that the VAS
valuation scores represent a value function as depicted in
figure 4, with actual reference point at q
p
(valued at 50),
and not a straight line diagonal connecting 100 (HRQL of
perfect health) and 0 (HRQL of death).
The implications for HRQL measurement are that the ver-
bal valuation is done in a relative way, with regard to a ref-
erence level of HRQL valued at 50. The exact level of
HRQL, which is valued as 50, is unknown, and may vary
across individuals. If it does vary across individuals, the
comparison of VAS scores between individuals is prob-
lematic, since though the 0 and 100 anchors are well
defined, they are actually used by the respondents to
define the effective reference point q
p
evaluated as 50.
Naturally, it does not mean that the S-shaped VAS score
over- or under-estimate true HRQL relative to the com-
mon interpretation of VAS, since true HRQL is unknown.
It does exclude, however, the notion of a reference point
being the mean score in the population. The end-digit
properties of written VAS evaluations done with the aid of
a marked ruler are expected to be similar.
A straightforward test of the argument advanced in this
paper would be to examine the distribution of VAS evalu-
ations of own HRQL with respect to scores ending with 0,
5 and other integer by score-ranges in other populations,
in particular where the traditional educational achieve-
ment scales are based on other scales, e.g., the A, B, C, F
grading system.
Acknowledgements
The research was partly funded by a grant from the National Institute for
Health Policy Research in Israel. The comments of Zvi Adar on an earlier
draft were very helpful.
References
1. Torrance GW: Social preferences for health states: an empirical eval-
uation of three measurement techniques. Socio-Economic Planning Sci
1978, 10:129-138.
2. Bleichrodt H, Johannesson M: An experimental test of a theoret-
ical foundation for rating scale valuations. Med Decis Making
1997, 17:208-216.
3. Lundberg L, Johannesson M, Isacson DGL, Borgquist L: Health state
utilities in a general population in relation to age, gender and
socioeconomic factors. Eur J Pub Health 1999, 9:211-217.
4. Shmueli A: Subjective health status and health values in the
general population. Med Decis Making 1999, 19:122-127.
5. EuroQol – A new facility for the measurement of health-
related quality of life. The EuroQol Group. Health Policy 1990,
16:199-208.
6. Robinson A, Loomes G, Jones-Lee M: Visual analog scales, stand-
ard gambling and relative risk aversion. Med Decis Making 2001,
21:17-27.
7. Torrance GW, Feeny D, Furlong W: Visual Analog Scales: Do
they have a role in the measurement of preferences for
health states? Med Decis Making 2001, 21:329-334.
8. Denic S, Khatib F, Saadi H: Quality of age data in patients from
developing countries. J Public Health 2004, 26:168-171.
9. De Lusignan S, Belsley J, Hague N, Dzregah B: End-digit preference
in blood pressure recordings of patients with ischemic heart
disease in primary care. J Hum Hypertens 2004, 18:261-265.
10. Shmueli A: Israelis evaluate their health care system before
and after the introduction of the National Health Insurance
Law. Health Policy 2003, 63:279-287.
11. Kahnemann D, Tversky A: Prospect theory: an analysis of deci-
sion making under risk. Econometrica 1979, 47:263-291.
12. Stevens SS: Issues in psychophysical measurement. Psychological
Review 1971, 78:426-450.