báo cáo hóa học:" Health-related quality of life in patients waiting for major joint replacement. A comparison between patients and population controls" pot
Bạn đang xem bản rút gọn của tài liệu. Xem và tải ngay bản đầy đủ của tài liệu tại đây (259.11 KB, 7 trang )
BioMed Central
Page 1 of 7
(page number not for citation purposes)
Health and Quality of Life Outcomes
Open Access
Research
Health-related quality of life in patients waiting for major joint
replacement. A comparison between patients and population
controls
Johanna Hirvonen*
1,2
, Marja Blom
1,3,4
, Ulla Tuominen
1,2
, Seppo Seitsalo
5
,
Matti Lehto
6
, Pekka Paavolainen
5,7
, Kalevi Hietaniemi
4
, Pekka Rissanen
8
and
Harri Sintonen
2
Address:
1
National Research and Development Centre for Welfare and Health, Helsinki, Finland,
2
University of Helsinki, Finland,
3
Academy of
Finland,
4
HUCH, Jorvi Hospital, Espoo, Finland,
5
Orton Orthopaedic Hospital, Helsinki, Finland,
6
Coxa, Hospital for Joint Replacement, Medical
Research Fund of Tampere University Hospital, Finland,
7
HUCH, Surgical Hospital, Helsinki, Finland and
8
University of Tampere, Finland
Email: Johanna Hirvonen* - ; Marja Blom - ; Ulla Tuominen - ;
Seppo Seitsalo - ; Matti Lehto - ; Pekka Paavolainen - ;
Kalevi Hietaniemi - ; Pekka Rissanen - ; Harri Sintonen -
* Corresponding author
Abstract
Background: Several quality-of-life studies in patients awaiting major joint replacement have focused on the
outcomes of surgery. Interest in examining patients on the elective waiting list has increased since the beginning
of 2000. We assessed health-related quality of life (HRQoL) in patients waiting for total hip (THR) or knee (TKR)
replacement in three Finnish hospitals, and compared patients' HRQoL with that of population controls.
Methods: A total of 133 patients awaiting major joint replacement due to osteoarthritis (OA) of the hip or knee
joint were prospectively followed from the time the patient was placed on the waiting list to hospital admission.
A sample of controls matched by age, gender, housing and home municipality was drawn from the computerised
population register. HRQoL was measured by the generic 15D instrument. Differences between patients and the
population controls were tested by the independent samples t-test and between the measurement points by the
paired samples t-test. A linear regression model was used to explain the variance in the 15D score at admission.
Results: At baseline, 15D scores were significantly different between patients and the population controls.
Compared with the population controls, patients were worse off on the dimensions of moving (P < 0.001),
sleeping (P < 0.001), sexual activity (P < 0.001), vitality (P < 0.001), usual activities (P < 0.001) and discomfort and
symptoms (P < 0.001). Further, psychological factors – depression (P < 0.001) and distress (P = 0.004) – were
worse among patients than population controls. The patients showed statistically significantly improved average
scores at admission on the dimensions of moving (P = 0.026), sleeping (P = 0.004) and discomfort and symptoms
(P = 0.041), but not in the overall 15D score compared with the baseline. In patients, 15D score at baseline (P <
0.001) and body mass index (BMI) (P = 0.020) had an independent effect on patients' 15D score at hospital
admission.
Conclusion: Although patients' HRQoL did not deteriorate while waiting, a consistently worse HRQoL was
observed in patients waiting for major joint replacement compared with population controls.
Published: 19 January 2006
Health and Quality of Life Outcomes 2006, 4:3 doi:10.1186/1477-7525-4-3
Received: 23 November 2005
Accepted: 19 January 2006
This article is available from: />© 2006 Hirvonen et al; licensee BioMed Central Ltd.
This is an Open Access article distributed under the terms of the Creative Commons Attribution License ( />),
which permits unrestricted use, distribution, and reproduction in any medium, provided the original work is properly cited.
Health and Quality of Life Outcomes 2006, 4:3 />Page 2 of 7
(page number not for citation purposes)
Background
The OECD Waiting Times project [1] on waiting time var-
iations for elective surgery across OECD country showed
waiting times to be "a significant health policy concern"
in almost half of all OECD countries. Finland and the
United Kingdom were the countries with the highest wait-
ing times.
In Finland, major joint replacements are surgical proce-
dures with high volume and relatively long waiting times.
In 2003, almost 8 800 hip replacement patients (169 per
100 000) and 6 800 knee replacement patients (131 per
100 000) were operated in Finnish hospitalss [2]. Between
1987 and 2002, the THR rate rose on average by 5% annu-
ally and the TKR rate by 12% [3]. Comparing waiting
times among Finnish THR and TKR patients shows signif-
icant regional differences and a trend towards longer wait-
ing times within the last ten years. In 2003, for patients
with primary THR, the median waiting time was 155 days,
and for patients with TKR 205 days [2].
To ensure the availability of care in Finland, the Council
of State initiated in 2001 a national project to secure the
future of health care. Guidelines for the implementation
of a nationwide system for assessing health care needs and
for the treatment criteria were prepared by the end of
2003. The national principles of access to hospital treat-
ment within six months or less came into force in March
2005.
Several studies have assessed health-related quality of life
(HRQoL) among patients who have undergone major
joint replacement and shown that patients experience
substantially more pain and restrictions in physical func-
tion than the general population [4-6]. Still, relatively few
of them have examined the change in HRQoL that occurs
while waiting for surgery. Studies have mostly focused on
the outcomes of surgery, reported improvements in phys-
ical function, vitality and mental health and reductions in
pain, or have shown that total knee arthroplasty (TKA)
and total hip arthroplasty (THA) are beneficial and effec-
tive [7-13]. However, the interest in examining the rela-
tionship between HRQoL and time spent waiting for
surgery has been on the increase since the beginning of
2000. The results have shown no consistent evidence that
HRQoL is worse in patients having to wait longer [14-16].
However, a prospective Canadian study concluded that
patients who wait 6 months at the most realize greater
gains in HRQoL than those waiting longer [17]. Further, a
prospective study of patients waiting for total hip arthro-
plasty (THA) found that patients in a later phase of disease
did not reach the same level after THA as those with better
preoperative function [4].
Although the principle of equal access to surgeries and
other health services has been promoted by health policy
in many western health care systems, practices do not
totally equate to policy targets. A common view is that
delayed access to care may impose a variety of costs such
as welfare losses during the waiting period [18]. Still, evi-
dence of the effect of waiting on patients' health status is
mixed.
The purpose of this study is to assess HRQoL in patients
awaiting major joint replacement and to compare the
HRQoL of patients with that of population controls. The
data collected for this analysis is part of long-term follow-
up data for patients in a prospective multi-centre study
aimed at assessing the costs and effects of waiting.
Methods
Data collecting
Patients were enrolled into this study in three Finnish hos-
pitals (HUCH Surgical Hospital, Helsinki; HUCH Jorvi
Hospital, Espoo and Coxa Hospital for Joint Replacement,
Tampere) in two hospital districts (Hospital District of
Helsinki and Uusimaa and Pirkanmaa Hospital District).
Two hospitals provide surgical services for municipalities
in the capital area. The third hospital is specialised in
endoprosthetic surgery which provides services for munic-
ipalities, local and central hospitals, as well as for patients
paying the costs themselves.
Patients were recruited into the study through regular con-
tact with the orthopaedic surgeons and practice staff. The
Ad hoc recruitment began in August 2002 and finished in
November 2003.
The inclusion criteria were: need for a primary total joint
arthroplasty due to osteoarthritis (OA) of the hip or knee
joint (excluding rheumatoid arthritis, fractures, haemo-
philia and deformity) as evaluated by the hospital sur-
geon, a patient aged 16 years or older was placed on the
waiting list in a research hospital, and the patient was will-
ing and mentally able to participate in the study. Each
patient provided a signed informed consent. The study
had ethical approval from the Helsinki University Central
Hospital (HUCH) Surgery Ethics Committee.
Patients completed a self-administered questionnaire at
two specific points in time: 1) when placed on the waiting
list (baseline), and 2) at hospital admission. The ques-
tionnaires were distributed to patients at hospital. Return
of the questionnaires was via postal means. Common
guidelines for administering the questionnaires were pro-
vided at each hospital.
For each patient, two population controls matched by age,
gender, housing (living alone vs. living with someone)
Health and Quality of Life Outcomes 2006, 4:3 />Page 3 of 7
(page number not for citation purposes)
and home municipality were obtained from the National
Population Register of Finland. To minimise the loss of
participants, two controls per patient were selected. Thus
control subject who did not return the questionnaire was
replaced with the other control of the same patient. In the
autumn of 2003, controls were mailed a self-administered
questionnaire similar to the patients' questionnaire.
HRQoL instrument
We assessed HRQoL using 15D. The 15D is a generic and
standardised HRQoL instrument consisting of 15 dimen-
sions: moving, seeing, hearing, breathing, sleeping, eat-
ing, speech, elimination, usual activities, mental function,
discomfort and symptoms, depression, distress, vitality
and sexual activity. For each dimension, the respondent
must choose one of the five levels that best describes his/
her state of health at the moment (best level = 1; worst
level = 5) [19,20]. The single index (15D score) on a 0–1
scale, representing the overall HRQoL, is calculated from
the health state descriptive system by using a set of popu-
lation-based preference or utility weights. Such a weight
for each level of each dimension is obtained by multiply-
ing the level value by the importance weight of the dimen-
sion at that level [21]. The level values on a 0–1 scale,
reflecting the goodness of the levels relative to no prob-
lems on the dimension (= 1) and to being dead (= 0), and
the importance weights summing up to unity, have been
elicited from representative population samples. The 15D
has been/is being utilised among different patient groups
(e.g. patients undergoing hip or knee arthroplasty) to
assess outcomes from health care interventions
[13,20,22]. In most of the important properties (eg.
responsiveness, sensitivity, reliability and validity), the
15D compares favourably with other instruments of the
same kind, such as EQ-5D, HUI3, SF-6D and AQoL
[20,21,23-25].
The interpretation on the minimum clinically important
difference in the 15D score is a difference ± 0.03 or more
(on a scale 0–1) in the sense that people can feel the dif-
ference in health status [26].
Statistical analysis
Data were analysed using SPSS for Windows, version
12.0.1. Descriptive statistics were used to describe demo-
graphic characteristics. Comparative analyses of demo-
graphic characteristics between patients and population
controls were computed using either the independent
samples t-test or the Chi-squared test depending on the
levels of measurement.
Univariate analyses were conducted to determine a) the
differences in the 15D score and dimensions between
patients and population controls, and b) the differences
between the baseline and admission measurements
within the patient group. Mean group scores were com-
pared using the paired samples t-test test within the
patient group, and independent samples t-test between
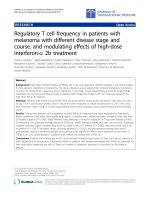
Table 1: Characteristics of patients and population controls
Characteristic Patients
n = 133
Population controls
n = 129–133
b
Patients excluded
n = 61–64
b
P value
c
P value
d
Age, years (mean ± SD) 67.6 (8.8) 67.6 (8.8) 66.0 (13.2) 1.000 0.375
Females [n, (%)] 83 (62.4) 81 (60.9) 43 (67.2) 0.801 0.513
Home municipality [n, (%)] 0.900 0.534
Capital area 72 (54.1) 71 (53.4) 38 (59.4)
Other urban area 36 (27.1) 39 (29.3) 18 (28.1)
Rural area 25 (18.8) 23 (17.3) 8 (12.5)
Housing, living alone [n, (%)] 39 (29.3) 40 (30.3) 29 (47.5) 0.862 0.014
Professional examination, yes [n, (%)] 45 (33.8) 61 (47.3) 23 (37.7) 0.027 0.600
Employment status [n, (%)] 0.229 0.066
Employed 17 (12.8) 27 (20.3) 16 (26.2)
Retired 112 (84.2) 101 (75.9) 43 (70.5)
Other 4 (3.0) 5 (3.8) 2 (3.3)
Comorbidity, yes [n, (%)] 89 (66.9) 98 (73.7) 48 (78.7) 0.227 0.095
BMI
a
(mean ± SD) 29.0 (4.4) 26.8 (4.4) 28.3 (4.7) <0.001 0.280
Waiting time, days [Md, range] 71 (8–600)
Months waiting for surgery [n, (%)]
0–3 months 94 (70.7)
> 3–6 months 20 (15.0)
> 6 months 19 (14.3)
a
BMI, body mass index (wt/ht
2
)
b
Number of observations varies due to missing values.
c
Between patients and population controls
d
Between the patients who completed the questionnaires (baseline and admission, n = 133) and those excluded (n = 64)
Health and Quality of Life Outcomes 2006, 4:3 />Page 4 of 7
(page number not for citation purposes)
patients and population controls. Two-sided P-values
were calculated in all tests. A P-value < 0.05 was consid-
ered statistically significant.
A multiple linear regression (MLR) model on the patient
data was constructed to determine the relationships
between the independent variables (waiting time, BMI,
affected joint, 15D score at baseline, gender, age, educa-
tion, housing) and 15D score at admission. Waiting time
was skewed and thus included in the model as a categori-
cal variable (over 3–6 months, over 6 months and 0–3
months as a reference level). All available independent
variables were included in the model. The results are pre-
sented in the form of unstandardised β-coefficients.
Missing values for the 15D dimensions were predicted
with the responses on the other dimensions, age and gen-
der as explanatory variables [19]. The missing value was
substituted if a minimum 80% of dimensions were
present.
Results
Patient and population controls characteristics
Of the 197 eligible patients recruited into the study, 30
were excluded because their controls declined to partici-
pate. In addition, 6 patients did not complete the baseline
and 28 did not complete the admission questionnaire and
were excluded. The analysis presented here focuses on 133
pairs with completed questionnaires.
The average age of the study population including
patients and age matched population controls was 67.6
years (range, 36–86 years) (Table 1). Of patients, 73
(55%) were waiting for primary THR and 60 (45%) were
waiting for primary TKR. The majority (54%, n = 143) of
the participants (including patients and population con-
trols) were from capital area. A total of 75 (28%) partici-
pants were from other urban area and 48 (18%) from
rural area.
A comparison between patients and population controls
showed that controls had more often professional educa-
tion than patients and patients were heavier than controls.
Of patients, 21 (16%) had a normal BMI (<25) and 112
(84%) were overweight or obese (BMI ≥ 25). Of popula-
tion controls, 45 (34%) had a normal BMI, and 86 (66%)
were overweight or obese.
For the patients, the waiting time from the surgeon
appointment to the surgery was skewed such that a total
of 94 (71%) patients waited for surgery 0–3 months, 20
(15%) waited > 3–6 months and 19 (14%) waited over 6
months. Two patients waited over one year.
A comparison between patients who completed the ques-
tionnaires (baseline and admission) and those who were
excluded showed that those who were excluded were
more often living alone than the completers (X
2
= 6.1, P =
0.014). There was, however, no statistically significant or
clinically important difference in the baseline 15D score
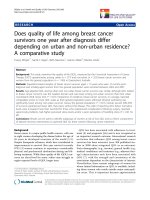
Table 2: The average 15D scores and dimension level values between patients and population controls
Health outcome Patients Population controls Mean difference
b
(95% CI)
15D dimension
a
Moving 0.565 (0.127) 0.883 (0.172) 0.317*** (0.281, 0.354)
Seeing 0.909 (0.176) 0.943 (0.140) 0.034ns (-0.004, 0.073)
Hearing 0.914 (0.142) 0.941 (0.143) 0.027ns (-0.007, 0.062)
Breathing 0.866 (0.204) 0.867 (0.219) 0.001ns (-0.050, 0.052)
Sleeping 0.685 (0.224) 0.803 (0.186) 0.117*** (0.068, 0.167)
Eating 0.992 (0.053) 0.992 (0.053) 0.000ns (-0.013, 0.013)
Speech 0.989 (0.057) 0.978 (0.079) -0.011ns (-0.028, 0.005)
Elimination 0.848 (0.202) 0.876 (0.193) 0.028ns (-0.020, 0.076)
Usual activities 0.655 (0.217) 0.870 (0.199) 0.214*** (0.164, 0.264)
Mental function 0.864 (0.178) 0.897 (0.170) 0.033ns (-0.009, 0.075)
Discomfort and symptoms 0.473 (0.236) 0.784 (0.204) 0.311*** (0.258, 0.364)
Depression 0.829 (0.177) 0.902 (0.138) 0.074*** (0.035, 0.112)
Distress 0.831 (0.188) 0.892 (0.155) 0.061** (0.019, 0.102)
Vitality 0.748 (0.172) 0.852 (0.152) 0.104*** (0.065, 0.143)
Sexual activity 0.731 (0.273) 0.869 (0.239) 0.138*** (0.076, 0.200)
15D score 0.778 (0.091) 0.883 (0.103) 0.105*** (0.082, 0.129)
n = 133
a
Data are mean (SD) scores. The scale is 0–1, worst to best.
b
Baseline scores between patients and population controls. Positive difference indicates better score and negative difference indicates worse score
for population controls than for patients. ns, non-significance
* P < 0.05, ** P < 0.01, *** P < 0.001
Health and Quality of Life Outcomes 2006, 4:3 />Page 5 of 7
(page number not for citation purposes)
between the completers and those excluded (0.778 and
0.777, respectively; ∆0.001, t = 0.03, P = 0.980).
HRQoL among patients and population controls
At the time the patients were placed on the waiting list, the
average (SD) 15D score was 0.778 (0.091) (Table 2).
Among the population controls, the mean (SD) 15D score
was 0.883 (0.103). The difference was statistically signifi-
cant and clinically important. The difference between the
groups remained statistically significant and clinically
important when patients' HRQoL at admission was com-
pared with the HRQoL among the population controls. At
baseline, patients had statistically significantly lower
scores on the dimensions of moving, sleeping, usual activ-
ities, discomfort and symptoms, depression, distress,
vitality and sexual activity compared to population con-
trols.
Change in patients' HRQoL while waiting
In patients, the 15D score improved while waiting, but the
change was not statistically significant or clinically impor-
tant (∆0.008, t = 1.6, P = 0.123, 95% confidence interval,
CI: 0.002–0.019). The patients showed, however, statisti-
cally significantly improved average scores at admission
for moving (∆0.032, t = 2.2, P = 0.026, 95% CI: 0.004–
0.060), sleeping (∆0.042, t = 3.0, P = 0.004, 95% CI:
0.014–0.071) and discomfort and symptoms (∆0.038, t =
2.1, P = 0.041, 95% CI: 0.002–0.075) compared with the
baseline measurement (not shown).
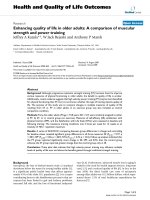
Patients' HRQoL at admission
The results of the MLR analysis indicated that BMI (β = -
0.003, P = 0.020) and the 15D score at baseline (β =
0.752, P < 0.001) were significantly associated with the
15D at admission (Table 3). A higher BMI when placed on
the waiting list was associated with the worse 15D score at
admission and the higher 15D score at baseline was asso-
ciated with higher HRQoL at admission. The length of
waiting was unrelated to the 15D score at admission.
Discussion
The aim of this multi-centre study was to assess HRQoL in
patients awaiting major joint replacement and to compare
the HRQoL of patients with that of population controls.
Patients were recruited into the study in three large Finn-
ish hospitals across two hospital districts and were pro-
spectively followed from the time the patient was placed
on the waiting list to the time of admission, with waiting
times calculated exactly. HRQoL was measured by the
15D, which is a generic, standardised, self-administered
measure and has been utilised in clinical economic evalu-
ations and population studies [20].
Some previous studies have reported that those awaiting
hip or knee replacement have a significantly poorer qual-
ity of life – especially in physical and social life – than a
general population [5,27]. The results of this study are in
line with those studies. Our first main finding was that at
both measurement points, patients awaiting major joint
replacement suffered from a significantly poorer HRQoL
– especially in moving, sleeping, usual activities, discom-
fort and symptoms, depression, distress, vitality and sex-
ual activity – compared to the population controls.
However, mental function seemed unaffected by the dis-
ease. This finding seems to be in line with an English case-
control study of patients awaiting hip replacement for
Table 3: Multiple linear regression coefficient estimates for the patients' 15D score at admission
Explanatory variables β
a
95% CI for β P value
Waiting time
0–3 months Reference
> 3–6 months 0.013 -0.016, 0.043 0.381
> 6 months 0.017 -0.014, 0.047 0.286
BMI -0.003 -0.005, -0.0004 0.020
Affected joint (0 = hip, 1 = knee) 0.013 -0.009, 0.035 0.232
15D score at baseline 0.752 0.637, 0.867 <0.001
Gender (0 = female, 1 = male) -0.008 -0.032, 0.015 0.479
Age -0.0004 -0.002, 0.001 0.539
Professional education (0 = no, 1 = yes) -0.0003 -0.023, 0.022 0.976
Housing (0 = living alone, 1 = living with someone) 0.009 -0.016, 0.034 0.469
Constant 0.301
R square 0.613
F 21.430***
n133
A positive value indicates improvement in the 15D score, and a negative value indicates worsening.
a
multivariate unstandardised linear regression coefficient
*** P < 0.001
Health and Quality of Life Outcomes 2006, 4:3 />Page 6 of 7
(page number not for citation purposes)
osteoarthritis [5], but in contrast to a recent Australian
study by Ackerman et al. [28] who found that patients
waiting for joint replacement suffered significantly higher
psychological distress compared with the general popula-
tion.
Our second main finding was that patients' overall
HRQoL improved while waiting although the improve-
ment was not statistically significant or clinically impor-
tant. The patients showed, however, statistically
significantly improved average scores at admission for
moving, sleeping and discomfort and symptoms com-
pared with the time when placed on the waiting list. This
is somewhat paradoxical and may reflect patients' expec-
tations on the coming surgical intervention that is sup-
posed to relief the disabling symptoms and to improve
function.
Multivariate analysis found that baseline HRQoL and BMI
were associated with HRQoL at admission. An increased
BMI was associated with a poorer HRQoL and better
HRQoL at the time of listing for surgery predicted a better
HRQoL at admission. We found, however, no association
between the length of waiting time and HRQoL at admis-
sion. This result is partially in line with the studies [14-
17,27] that have found no significant differences in
HRQoL between patients with short waits and those with
longer waits. The explanations are various and should be
analysed in more detail. For example, it might be possible
that after making a decision to operate, the certainty of
treatment has a positive impact on health status. Nilsdot-
ter et al. [15] have talked about "regression to the mean",
in that with the decision, the health status may even
improve. In addition, Achat et al. [29] have found that
optimism in older patients is associated with better gen-
eral health perception. Although patients' HRQoL did not
seem to decrease while waiting and no association
between waiting time and poorer HRQoL at admission
was found, this does not, however, affect our general con-
clusion that patients awaiting major joint replacement
due to OA suffer from discomfort and symptoms, and
have a clear reduction in moving, usual activities, sleep-
ing, energy, sexual life and some mental aspects (distress,
depression). Although further deterioration in HRQoL
may be limited after placement on the waiting list,
delayed access to surgery impose the burden of disease.
There were some limitations in our study. First, most
patients were residing in the urban area, which may limit
our study's generalizability to rural populations. A previ-
ous study has shown that urban THR patients may differ
from rural patients with respect to pain threshold and per-
ceptions on function [30]. Second, the median length of
waiting time among patients was rather short (72 days)
and thus the sample may have under-represented those
having to wait longer and resulted in an underestimation
of the waiting time effect on HRQoL. As the median wait-
ing times in Finland are longer, the study's finding should
not necessarily be generalised to all patients awaiting THR
or TKR. Further, we measured the time between place-
ment on the waiting list and hospital admission instead of
following patients from general practitioner's consulta-
tion to treatment. Ideally, the whole waiting time from
initial referral to the specialist should be monitored [31].
In prospective studies, it is, however, difficult to collect
waiting time data through the care process from primary
care consultation to treatment. Third, the population con-
trols had more often a professional education compared
to the patients, which may have impacted on the findings
as socioeconomic status (SES) has been shown to be asso-
ciated with health status [30,32].
Conclusion
In these analyses, we found that the length of waiting was
unrelated to the poorer HRQoL at admission. Further,
moving, sleeping and discomfort and symptoms
improved while waiting for surgery. An interesting view
concerning these dimensions is that we do not know the
association of disease specific medication with HRQoL
and reduction in pain during the waiting time. Although
patients' HRQoL measured by the generic 15D instrument
improved minimally while waiting, a consistently worse
HRQoL was observed in patients waiting for major joint
replacement compared with population controls. Thus, it
is essential to identify on the waiting list those in the poor-
est health.
Competing interests
The author(s) declare that they have no competing inter-
ests.
Authors' contributions
JH was the correspondence author of the manuscript and
responsible for the integrity of the work as a whole. She
contributed as a principal researcher and writer including
drafting the article and the analysis and interpretation of
data. MB was the leader of the research project. She made
contributions to conception and design, acquisition and
interpretation of data and participated in the writing proc-
ess by commenting the manuscript. UT made contribu-
tions to design, acquisition, and interpretation of data. HS
and PR contributed as specialists in the field, were
involved in the design of the study and hypothesis forma-
tion and revised the manuscript. SS, ML, PP, KH contrib-
uted as specialists in the field of orthopaedic surgery. They
made contributions to design and acquisition of data and
revised the manuscript. All authors read and approved the
final manuscript.
Acknowledgements
Publish with BioMed Central and every
scientist can read your work free of charge
"BioMed Central will be the most significant development for
disseminating the results of biomedical research in our lifetime."
Sir Paul Nurse, Cancer Research UK
Your research papers will be:
available free of charge to the entire biomedical community
peer reviewed and published immediately upon acceptance
cited in PubMed and archived on PubMed Central
yours — you keep the copyright
Submit your manuscript here:
/>BioMedcentral
Health and Quality of Life Outcomes 2006, 4:3 />Page 7 of 7
(page number not for citation purposes)
This study was financially supported by the Academy of Finland (no. 51871),
Helsinki University Central Hospital Jorvi Hospital, Coxa Hospital for Joint
Replacement, Medical Research Fund of Tampere University Hospital, Hel-
sinki University Central Hospital Surgical Hospital and Orton Orthopaedic
Hospital.
References
1. Siciliani L, Hurst J: Explaining waiting times variations for elec-
tive surgery across OECD countries. OECD Health Working
Papers 2003, 7:.
2. National Research and Development Centre for Welfare
and Health. Operative inpatient services 2003 [http://
www.stakes.info/2/9/hoitojaksot_2003.asp]
3. Mikkola H, Järvelin J, Seitsalo S, Keskimäki I: Orthopedic surgeries
in Finland 1987-2002. Number of surgeries according to the
geographic areas, waiting time and centralization. Duodecim
2005, 121:861-871.
4. Ostendorf M, Buskens E, van Stel H, Schrijvers A, Marting L, Dhert
W, Verbout A: Waiting for Total Hip Arthroplasty. Avoidable
Loss in Quality Time and Preventable Deterioration. J Arthro-
plasty 2004, 19:302-309.
5. Croft P, Lewis M, Wynn Jones C, Coggon D, Cooper C: Health sta-
tus in patients awaiting hip replacement for osteoarthritis.
Rheumatology (Oxford) 2002, 9:1001-1007.
6. Jones CA, Voaklander DC, Johnston DW, Suarez-Almazor ME:
Health related quality of life outcomes after total hip and
knee arthroplasties in a community based population. J Rheu-
matol 2000, 27:1745-1752.
7. Bachmeier CJ, March LM, Cross MJ, Lapsley HM, Tribe KL, Courtenay
BG, Brooks PM, Arthritis Cost and Outcome Project Group: A com-
parison of outcomes in osteoarthritis patients undergoing
total hip and knee replacement surgery. Osteoarthritis Cartilage
2001, 2:137-146.
8. Chiu HC, Mau LW, Hsu YC, Chang JK: Postoperative 6-month
and 1-year evaluation of health-related quality of life in total
hip replacement patients. J Formos Med Assoc 2001, 7:461-465.
9. Brander VA, Malhotra S, Jet J, Heinemann AW, Stulberg SD: Out-
come of hip and knee arthroplasty in persons aged 80 years
and older. Clin Orthop 1997, 345:67-78.
10. March LM, Cross MJ, Lapsley H, Brnabic AJM, Tribe KL, Bachmeier
CJM, Courtenay BG, Brooks PM: Outcomes after hip or knee
replacement surgery for osteoarthritis. A prospective
cohort study comparing patients' quality of life before and
after surgery with age-related population norms. MJA 1999,
171:235-238.
11. McGuigan FX, Hozack WJ, Moriarty L, Eng K, Rothman RH: Predict-
ing quality-of-life outcomes following total joint arthro-
plasty. Limitations of the SF-36 Health Status
Questionnaire. J Arthroplasty 1995, 6:742-747.
12. Salmon P, Hall GM, Peerbhoy D, Shenkin A, Parker C: Recovery
from hip and knee arthroplasty: Patients' perspective on
pain, function, quality of life, and well-being up to 6 months
postoperatively. Arch Phys Med Rehabil 2001, 3:360-366.
13. Rissanen P, Aro S, Sintonen H, Slatis P, Paavolainen P: Quality of life
and functional ability in hip and knee replacements: a pro-
spective study. Qual Life Res 1996, 1:56-64.
14. Brownlow HC, Benjamin S, Andrew JG, Kay P: Disability and men-
tal health of patients waiting for total hip replacement. Ann
R Coll Surg Engl 2001, 2:128-133.
15. Nilsdotter AK, Lohmander LS: Age and waiting time as predic-
tors of outcome after total hip replacement for osteoarthri-
tis. Rheumatology 2002, 41:1261-1267.
16. Kelly KD, Voaklander DC, Johnston DWC, Newman SC, Suarez-
Almazor ME: Change in pain and function while waiting for
major joint arthroplasty. J Arthroplasty 2001, 3:351-359.
17. Mahon JL, Bourne RB, Rorabeck CH, Feeny DH, Stitt L, Webster-
Bogaert S: Health-related quality of life and mobility of
patients awaiting elective total hip arthroplasty: a prospec-
tive study. CMAJ 2002, 10:1115-1121.
18. Martin S, Smith PC: Rationing by waiting lists: an empirical
investigation. J Public Econ 1999, 71:141-164.
19. Sintonen H: The 15D measure of health-related quality of life:
reliability, validity and sensitivity of its health state descrip-
tive system. In Working Paper 41 NCHPE: Australia, Melbourne;
1994.
20. Sintonen H: The 15D instrument of health-related quality of
life: properties and applications. Ann Med 2001, 33:328-336.
21. Sintonen H: The 15-D Measure of Health Related Quality of
Life. II Feasibility and Validity of its Valuation System. In
National Centre for Health Program Evaluation, Working Paper 42 Aus-
tralia, Melbourne; 1995.
22. Rissanen P, Aro S, Slätis P, Sintonen H, Paavolainen P: Health and
quality of life before and after hip or knee arthroplasty. J
Arthroplasty 1995, 10:169-175.
23. Stavem K: Reliability, validity and responsiveness of two multi-
attribute utility measures in patients with chronic obstruc-
tive pulmonary disease. Qual Life Res 1999, 8:45-54.
24. Hawthorne G, Richardson J, Day NA: A comparison of the
Assessment of Quality of Life (AQoL) with four other
generic utility instruments. Ann Med 2001, 33:358-370.
25. Sintonen H: Properties of the health state descriptive system.
[ />].
26. Drummond M: Introducing economic and quality of life meas-
urements into clinical studies. Ann Med 2001, 5:344-349.
27. Derrett S, Paul C, Morris JM: Waiting for elective surgery:
effects on health-related quality of life. Int J Qual Health Care
1999, 1:47-57.
28. Ackerman IN, Graves SE, Wicks IP, Bennell KL, Osborne RH:
Severely Compromised Quality of Life in Women and Those
of Lower Socioeconomic Status Waiting for Joint Replace-
ment Surgery. Arthritis Rheum 2005, 53:653-658.
29. Achat H, Kawachi I, Spiro A 3, DeMolles DA, Sparrow D: Optimism
and depression as predictors of physical and mental health
functioning: the Normative Aging Study. Ann Behav Med 2000,
22:127-130.
30. Visuri T, Honkanen R: The role of socio-economic status and
place of residence in total hip replacement. Scand J Soc Med
1982, 10:95-99.
31. Standing Committee of the Hospitals of the E.U: Waiting lists and wait-
ing times in health care. Managing demand and supply. Leuven 2001.
32. Hawker GA, Wright JG, Glazier RH, Coyte PC, Harvey B, Williams JI,
Badley EM: The Effect of Education and Income on Need and
Willingness to Undergo Total Joint Arthroplasty. Arthritis
Rheum 2002, 46:3331-3339.