báo cáo hóa học:" Comparison of the SF-6D and the EQ-5D in patients with coronary heart disease" pdf
Bạn đang xem bản rút gọn của tài liệu. Xem và tải ngay bản đầy đủ của tài liệu tại đây (327.56 KB, 9 trang )
BioMed Central
Page 1 of 9
(page number not for citation purposes)
Health and Quality of Life Outcomes
Open Access
Research
Comparison of the SF-6D and the EQ-5D in patients with coronary
heart disease
Henk F van Stel and Erik Buskens*
Address: Julius Center for Health Sciences and Primary Care, University Medical Center Utrecht, room STR 6.131, PO box 85500, 3584 GA,
Utrecht, The Netherlands
Email: Henk F van Stel - ; Erik Buskens* -
* Corresponding author
Abstract
Background: The SF-6D was derived from the SF-36. A single summary score is obtained allegedly
preserving the descriptive richness and sensitivity to change of the SF-36 into utility measurement.
We compared the SF-6D and EQ-5D on domain content, scoring distribution, pre-treatment and
change scores.
Methods: The SF-6D and the EQ-5D were completed prior to intervention and 1, 3, 6 and 12
months post-intervention in a study enrolling 561 patients with symptomatic coronary stenosis.
Patients were randomized to off-pump coronary artery bypass surgery (CABG), standard on-pump
CABG, or percutaneous transluminal coronary angioplasty (PTCA). Baseline and change over time
scores were compared using parametric and non-parametric tests.
Results: The relative contribution of similar domains measuring daily functioning to the utility
scores differed substantially. SF-6D focused more on social functioning, while EQ-5D gave more
weight to physical functioning. Pain and mental health had similar contributions. The scoring range
of the EQ-5D was twice the range of the SF-6D. Before treatment, EQ-5D and SF-6D mean scores
appeared similar (0.64 versus 0.63, p = 0.09). Median scores, however, differed substantially (0.69
versus 0.60), a difference exceeding the minimal important difference of both instruments.
Agreement was low, with an intra-class correlation of 0.45.
Finally, we found large differences in measuring change over time. The SF-6D recorded greater
intra-subject change in the PTCA-group. Only the EQ-5D recorded significant change in the
CABG-groups. In the latter groups changes in SF-6D domains cancelled each other out.
Conclusion: Although both instruments appear to measure similar constructs, the EQ-5D and SF-
6D are quite different. The low agreement and the differences in median values, scoring range and
sensitivity to change after intervention show that the EQ-5D and SF-6D yield incomparable scores
in patients with coronary heart disease.
Background
Measurement of health utility is an important part of cost-
effectiveness analysis in health care. Health utility can be
measured by several preference-based utility measures, of
which the EuroQol (EQ-5D) [1,2] and the Health Utility
Index [3] are the most widely used. Recently, a new index
Published: 25 March 2006
Health and Quality of Life Outcomes 2006, 4:20 doi:10.1186/1477-7525-4-20
Received: 24 August 2004
Accepted: 25 March 2006
This article is available from: />© 2006 van Stel and Buskens; licensee BioMed Central Ltd.
This is an Open Access article distributed under the terms of the Creative Commons Attribution License ( />),
which permits unrestricted use, distribution, and reproduction in any medium, provided the original work is properly cited.
Health and Quality of Life Outcomes 2006, 4:20 />Page 2 of 9
(page number not for citation purposes)
score, called the SF-6D, has been developed [4]. This
instrument produces a summary score based on an algo-
rithm using a subset of 11 questions from the SF-36 health
status measure [5]. The major reason for developing the
SF-6D was to enlarge the basis for economic evaluations,
while retaining the descriptive richness and sensitivity to
change of the SF-36 [6]. This reasoning is based on obser-
vations that the EQ-5D has poorer descriptive ability and
is less sensitive to change compared to individual SF-36
domains [7-10]. These potential advantages of the SF-6D
over alternative instruments should be substantiated in
additional studies. A further point of interest may be the
difference in methodology applied in deriving a utility
score, which could imply that utilities with different
"meaning" are obtained, thus resulting in confusion when
interpreting results from studies using different instru-
ments [11]. Potentially, policy decisions could be com-
promised by using utilities that are not equivalent.
Therefore, we sought to assess the equivalency of the SF-
6D and the EQ-5D cross-sectionally, in domain content,
in scoring distribution, and in the amount of change
measured after intervention. We addressed these ques-
tions by comparing the SF-6D and EQ-5D qualitatively
and quantitatively, using data from two randomised con-
trolled trials of patients with symptomatic coronary sten-
osis.
Methods
We included patients with symptomatic coronary stenosis
enrolled in two multicenter randomized controlled trials
assessing the efficacy of the Octopus tissue stabiliser for
bypass grafting. The first trial ("OctoPump") compared
standard on-pump coronary artery bypass grafting
(CABG) to off-pump CABG using the Octopus device with
in 281 patients requiring coronary revascularisation
[12,13]. The second trial ("OctoStent") compared off-
pump CABG with percutaneous transluminal coronary
angioplasty (PTCA) in 280 patients [14,15]. The study
protocols of both trials required completion of both the
EQ-5D and the SF-36 pre- and 1 month post-intervention,
with follow-up until 1 year post-intervention [14].
Patients were enrolled from March 1998 to August 2000.
There were no baseline differences in health status scores
between the treatment arms within each trial.
Instruments
The EQ-5D health status instrument comprises 5 ques-
tions – each with 3 levels – representing 5 health
domains: pain, mood, mobility, self care and daily activi-
ties [1,2]. This results in 243 health states. Valuation was
done with time-trade off, using dead as the lower anchor.
The EQ-5D utility score was computed using the MVH-A1
algorithm by Dolan [16]. This algorithm yields a range
from -0.594 to +1. The SF-6D uses 11 questions from the
SF-36 health status measure (version 1), divided over 6
health domains: pain (6 levels), mental health (5), physi-
cal functioning (6), social functioning (5), role limita-
tions (4) and vitality (5). The SF-6D has 18,000 health
states. The valuation task for the SF-6D used the worst
possible health state ('pits') on the SF-6D as is the worst
outcome, valued with the standard gamble method. The
SF-6D was computed using the algorithm provided by
Brazier and colleagues [4]. The scoring range of the SF-6D
covers +0.291 to +1. On both instruments, 1 represents
full health. Both algorithms include an interaction term to
account for an additional disutility in case one of the
domains is scored at its most severe level.
Statistical analysis
A qualitative assessment was carried out by comparing
(dis-)similarities among domains [17] and their relative
contribution to the utility scores. Relative contribution
was computed as the maximal decrease of a domain
divided by the total decrease in utility score for that instru-
ment (excluding the decrease of the interaction terms).
We then computed change-scores (post-intervention
minus pre-intervention scores) and determined the
number of missing baseline and change scores. Normality
of distributions was tested with Shapiro-Wilk's W test
[18]. The ceiling effect of each domain was assessed by
computing the percentage of patients reporting no prob-
lems. To reduce the number of missing scores in the SF-
6D, we imputed missing items in the SF-36 from the SF-
36 domain scores. This was done by computing the mean
value for a SF-36 domain, imputing that value for missing
items in that domain, rounding imputed values to the
nearest integer, and then recalculating the SF-6D. We per-
formed parametric and non-parametric testing of baseline
(Kruskal Wallis ANOVA) and change differences (paired t-
test with 95% confidence intervals and Wilcoxon matched
pairs test) between EQ-5D and SF-6D and their domains.
Construct validity was assessed by computing Spearman
correlations between the utility scores and between the
domains of both instruments. Agreement was assessed by
the Bland-Altman plot [19] and by computing an intra-
class correlation coefficient (ICC). Statistical analyses
were done with Statistica version 5.5 (Statsoft, 1999) and
SPSS version 10.1 (SPSS Inc, 2000).
Results
The combined study group of 561 patients consisted of
mostly males (70.4%); the mean age was 60.2 years (sd
9.3).
Domain comparison
The EQ-5D and the SF-6D both include pain and mental
health (anxiety and depression) with rather similar contri-
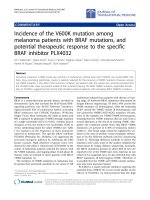
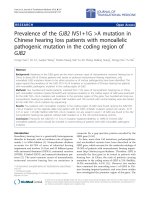
butions to the overall utility scores (figure 1). Together
these two domains account for about 50% in both utility
scores. The other domains have less overlap. Physical
Health and Quality of Life Outcomes 2006, 4:20 />Page 3 of 9
(page number not for citation purposes)
functioning from the SF-6D addresses similar issues as
mobility and self-care from the EQ-5D, but contributes
only half as much to the SF-6D utility as mobility and self-
care to the EQ-5D. The reverse is found for daily activities,
which has only a limited contribution to the EQ-5D util-
ity, while the corresponding domains from the SF-6D
(social functioning and role limitations) contribute
26.9% to the utility score. The SF-6D vitality domain has
no direct counterpart in the EQ-5D.
Baseline and change scores
The SF-6D had a higher percentage of missing data, both
at baseline and post-intervention (Table 1). 33 patients
(5.9%) were lost to follow-up or failed to come for the
post-intervention visit. Another 4.1% of the missing post-
intervention utility scores, and 4.6% of the baseline
scores, resulted from patients who did not fill in their
questionnaires. The remainder of the missing scores
resulted from individual missing items on the question-
naires. After imputation of the missing SF-36 items from
SF-36 domain scores, the percentage of missing scores in
the SF-6D due to missing items was reduced by half, both
at baseline and post-intervention (Table 1). The median
SF-6D score with imputed values did not differ from the
median score without imputed values. Thus, all of the fol-
lowing results are based on the imputed SF-6D. There
were no differences at baseline between the patients with
or without a missing utility score post-intervention, so we
assumed these missing scores to be at random.
Baseline and change scores from both measures were not
normally distributed (all p < 0.001). The ceiling effect in
the EQ-5D domains and utility score were much larger
than in the SF-6D (Table 2). There were no floor-effects in
the utility scores, with minimum values of -0.32 for the
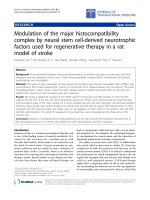
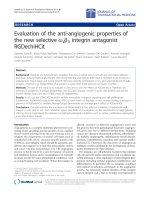
EQ-5D and +0.32 for the SF-6D. The baseline EQ-5D was
skewed towards perfect health, while the SF-6D was cen-
tred around 0.6 (Figure 2). The (arithmetic) mean base-
Comparison of maximal theoretical contribution to the utility scoreFigure 1
Comparison of maxim al theoretical contribution to the utility score. Domains measuring the same area of health
have similar colors. EQ-5D dimensions: M: mobility; SC: self care; UA: usual activities; PD: pain/discomfort; AD: anxiety/
depression. SF-6D dimensions: PF: physical functioning; RL: role limitation; SF: social functioning; PN: pain; MH: mental health;
VT: vitality.
Table 1: Percentage of missing scores
Missing scores (%) baseline post-intervention
total due to missing items total due to missing items
EQ-5D 9.1 4.5 15.9 5.9
SF-6D 16.812.122.612.6
SF-6D-imputed * 10.9 6.2 16.8 6.8
*after imputation of missing SF-36 item-scores from subscale-scores
Health and Quality of Life Outcomes 2006, 4:20 />Page 4 of 9
(page number not for citation purposes)
l i
Table 2: Domain comparison
EQ-5D ceiling effect at
baseline (%)
#
p-value for
change in
PTCA*
p-value for
change in off-
pump CABG*
SF-6D ceiling effect at
baseline (%)
#
p-value for
change in
PTCA*
p-value for
change in off-
pump CABG*
pain 31.8 0.0003 0.2 pain 13.0 <0.0001 0.08
anxiety/
depression
60.0 0.009 0.03 mental health 8.9 0.0008 0.02
mobility 55.1 0.004 0.0005 physical
functioning
2.3 <0.0001 0.3
self care 93.1 0.3 0.3 social
functioning
20.1 <0.0001 0.046
usual activities 30.5 <0.0001 0.4 role limitations 14.1 <0.0001 0. 02
vitality 2.7 0.0005 0.6
EQ-5D 13.5 <0.0001 0.035 SF-6D 0.4 <0.0001 0.22
#
percent maximal scores at baseline.
*wilcoxon matched pairs test between pre- and post-intervention, minimal N: EQ-5D-domains 124, SF-6D-domains 115.
change in the OctoStent off-pump CABG group; changes in the Octopump groups are comparable to this group and therefore omitted from the
table
Histogram of baseline EQ-5D and SF-6D scoresFigure 2
Histogram of baseline EQ-5D and SF-6D scores.
Health and Quality of Life Outcomes 2006, 4:20 />Page 5 of 9
(page number not for citation purposes)
ne scores from the EQ-5D and SF-6D did not differ signif-
icantly using a parametric t-test: 0.64 versus 0.62 (mean
difference 0.016, 95%CI 0.003 – 0.036, p = 0.09). The
median values however, showed a large difference: 0.69
for EQ-5D versus 0.60 for SF-6D. Non-parametric com-
parison of the distributions showed highly significant dif-
ferences (p < 0.001). The median baseline values have
different locations in their respective scoring ranges: the
median EQ-5D score was located in the top quarter, the
median SF-6D in the middle part (Figure 2).
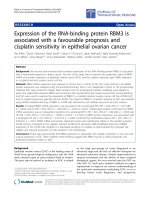
Agreement between both measures was poor, with an ICC
of 0.45. The Bland-Altman plot showed proportional
error, and wide limits of agreement (Figure 3). The corre-
lation structure between the domains is rather diffuse:
there are no strong correlations (>0.5), and only a few
moderate correlations (Table 3). Furthermore, one would
expect that domains such as physical functioning and
pain (SF-6D) have the strongest correlation with their cor-
Table 3: Correlation between utility domains at baseline
EQ-5D
SF-6D M SC UA PD AD
PF 0.31 0.34 0.42 0.24 0.11
RL 0.19 0.09 0.35 0.30 0.21
SF 0.26 0.20 0.41 0.36 0.34
PN 0.32 0.23 0.48 0.43 0.19
MH 0.04 0.09 0.09 0.17 0.47
VT 0.20 0.15 0.27 0.26 0.27
All correlations (spearman) above 0.1 are significant at the p < 0.01
level; all correlations above 0.2 are significant at the p < 0.0001 level.
Correlations between like domains are indicated in bold.
EQ-5D dimensions: M: mobility; SC: self care; UA: usual activities; PD:
pain/discomfort; AD: anxiety/depression. SF-6D dimensions: PF:
physical functioning; RL: role limitation; SF: social functioning; PN:
pain; MH: mental health; VT: vitality.
Bland-Altman plot of EQ-5D and SF-6DFigure 3
Bland-Altman plot of EQ-5D and SF-6D.
Health and Quality of Life Outcomes 2006, 4:20 />Page 6 of 9
(page number not for citation purposes)
responding EQ5D-domains: mobility and pain. This was
not the case, as both SF-6D-domains are most strongly
correlated to usual activities, a domain that in it's turn has
about equally strong relationships with 5 out of 6 SF-6D-
domains. Only mood and mental health behave as
expected, as they have a strong relationship with each
other and lower correlations with all other domains.
The EQ-5D and SF-6D both detected change over time in
the PTCA group (Table 4). All domains from both meas-
ures, except self-care, contributed to this change (Table 2).
The EQ-5D, but not the SF-6D, detected change over time
in the other three groups. This lack of change in the SF-6D
is partly caused by domains that change in opposite direc-
tions: significant improvement in one domain, such as
mental health, is cancelled out by deterioration in other
domains, such as social functioning and role limitations.
The difference between EQ-5D and SF-6D in picking up
change is shown in figure 4: the SF-6D lags behind, and
that difference remains. The mean difference is 0.055
(95%CI 0.028 – 0.080, p < 0.0001).
Discussion
We compared the measurement properties of the EQ-5D
and the SF-6D in a group of patients undergoing coronary
revascularisation. We found clear differences between
these utility measures: conceptual, in baseline scores and
in sensitivity to change. First of all, the number of
domains differs: 5 versus 6. However, the contribution of
the SF-6D vitality domain, which has no counterpart in
the EQ-5D, is small. Therefore, one could expect that
domains tapping similar areas of health have somewhat
equal contributions to the total score. This is the case for
the domains pain and mood/mental health. However, the
content and weights of the other domains show consider-
able differences, with the EQ-5D giving more weight to
Long term change in median utility scoresFigure 4
Long term change in median utility scores. Off-CABG = off-pump coronary artery bypass surgery; on-CABG = on-
pump.
Health and Quality of Life Outcomes 2006, 4:20 />Page 7 of 9
(page number not for citation purposes)
physical functioning and the SF-6D to social functioning.
A second difference is that the recall period of both instru-
ments is different: today for EQ-5D, versus the last four
weeks (or one week in the acute version of the SF-36) for
the SF-6D. The third difference is that the scoring range of
the EQ-5D is twice that of the SF-6D. The location of the
baseline median scores in the scoring range was quite dif-
ferent: in the top quarter for EQ-5D, halfway for the SF-
6D. A fourth difference was that the distributions were sig-
nificantly different from each other, although the mean
values appeared to be similar. The difference between the
median values and the limits of agreement in the Bland-
Altman plot exceed the minimal clinically important dif-
ference of both SF-6D and EQ-5D [20,21]. The lack of
agreement is further exemplified by the low ICC.
A fifth difference is found in the sensitivity to change.
Both measures recorded change in the PTCA group, but
differed in the CABG groups: EQ-5D scores improved sig-
nificantly, but SF-6D scores did not change. The SF-6D
recorded greater change than the EQ-5D in the PTCA
group, despite its narrower scoring range. In the CABG
groups, the change in the EQ-5D was caused by change in
anxiety/depression and mobility. There was however no
corresponding improvement in the SF-6D physical func-
tioning domain. The significant deterioration in social
functioning and role limitations cancelled out the
improvement in mental health, resulting in no change in
the overall SF-6D score. Another important reason for the
difference in amount of change after CABG may lie in the
differing recall periods: with a post-intervention assess-
ment at one month, the 4-week recall period of the SF-36
encompasses both the intervention and recovery period,
as compared to today's health status in the EQ-5D. How-
ever, the difference between SF-6D and EQ-5D remains at
the subsequent measurements. This cannot be fully
explained by different recall periods, as patients are stable
by 6 months, and today's health should not differ that
much from that over the last 4 weeks.
Both measures display non-normal distributions, both at
baseline and in change over time. The EQ-5D is skewed
towards good health, which creates a ceiling effect. The SF-
6D is highly centred on the middle of the scoring range
(see figure 1). The difference in scoring range may be
explained by differences in reference state for the valua-
tion task and the valuation technique. Two-thirds of the
respondents valued the worst possible health state health
state of the SF-6D as better than dead, causing the lower
limit of the SF-6D to be quite a bit higher than zero [4].
The EQ-5D valuation study used dead as the lower
anchor, resulting in negative scores for the worst health
states [16]. The valuation studies of both instruments
used different valuation techniques. The standard gamble
method, used for the SF-6D, generally gives somewhat
higher valuations than time-trade off (used for MVH-A1
tariff) [22,23], but these differences are not large enough
to explain the narrower scoring range of the SF-6D. The
difference in scoring range implies that apparently similar
baseline scores and change scores are not equivalent, pro-
hibiting direct comparisons between utility scores
obtained by different instruments. More detailed discus-
sions of the differences in valuation methods and scoring
algorithms are given by Brazier and coworkers [24] and
Bryan and Longworth [25].
A substantial part of the missing SF-6D scores were caused
by incompletely filled-in questionnaires. The algorithm of
the SF-6D requires that all relevant questions are
answered. However, the algorithm of the domain scores
of the SF-36 allows a certain amount of missing scores,
which are imputed with the mean value of the completed
items of that domain [5]. We used that technique to
reduce the number of missing scores in the SF-6D; imput-
ing a value for missing items in a SF-36 domain using the
mean value for that domain. This way, the amount of
missing scores in the SF-6D due to incomplete question-
naires was halved, from about 12% to 6% of the total
number of SF-6D scores. Imputation did not affect the
Table 4: Comparison of baseline and post-intervention SF-6D and EQ-5D scores
SF-6D EQ-5D
baseline * post-intervention baseline post-intervention
OctoStent PTCA (n ≥ 121) 0.59 (0.10) 0.72 (0.19)
#
0.71 (0.36) 0.80 (0.31)
#
Off-pump CABG (n ≥ 116) 0.61 (0.14) 0.62 (0.12) 0.69 (0.32) 0.76 (0.15)
OctoPump Off-pump CABG (n ≥ 110) 0.62 (0.13) 0.63 (0.16) 0.69 (0.38) 0.76 (0.37)
On-pump CABG (n ≥ 98) 0.64 (0.17) 0.63 (0.17) 0.69 (0.33) 0.76 (0.12)
data are expressed as median (interquartile range). PTCA = percutaneous transluminal coronary angioplasty; CABG = coronary artery bypass
surgery
*Kruskal-Wallis anova: p = 0.016. PTCA group SF-6D scores differ from all other groups, all p ≤ 0.03; other groups do not differ from each other.
#
significant improvement from baseline, p < 0.0001
significant improvement from baseline, p < 0.05
Health and Quality of Life Outcomes 2006, 4:20 />Page 8 of 9
(page number not for citation purposes)
median values. Note however that this solution would not
be viable if the SF-6D would be administered without the
other SF-36 questions.
Recently, some studies were done that compared the EQ-
5D and the SF-6D, as in our study [21,24-29]. In a study
comparing seven patient groups, Brazier and coworkers
found overall similar mean scores for the two measures in
patients with mild diseases [24], but baseline values
clearly differ in more severe patients such as liver trans-
plant patients [26] and patients with a recent stroke [21].
These studies confirmed some of the disagreements we
found: differing descriptive content and differing scoring
range [24,26,29]. The pattern of correlations between
domains we found was similar to the Brazier study, except
that the magnitude of the correlations was much lower.
Despite the strong correlation between the utility scores,
these data do not support the construct validity, as the cor-
relation structure was rather diffuse with only moderate
correlations. Only mood/mental health behaved as
expected (i.e. a strong correlation with each other, and
low correlations with other domains).
The sensitivity to change of the SF-6D remains unclear:
Pickard and colleagues found that the SF-6D was as sensi-
tive as the EQ-5D in stroke patients – although the SF-6D
also changed in patients who reported themselves as
unchanged [21]. Other studies, including ours, found no
change in SF-6D after intervention, compared to signifi-
cant changes in the EQ-5D [26,29].
These differences at baseline and in change over time
imply that changes in utility and/or quality adjusted life
years based on different instruments cannot be directly
compared. Furthermore, these differences are larger than
the minimal clinically important difference, which will
influence conclusions of cost-effectiveness analysis and
clinical decision-making.
Conclusion
In conclusion, the EQ-5D and SF-6D are not equivalent,
despite some resemblances. Although the mean utility
scores appear to be similar, the differences in median val-
ues, scoring range and sensitivity to change after interven-
tion and the low agreement show that the EQ-5D and SF-
6D yield incomparable scores. Even within a group of
patients with the same diagnosis, the EQ-5D and SF-6D
yield different scores, while sensitivity to change seems to
be influenced by the type of intervention. The SF-6D has
better distributional properties than the EQ-5D, but that
did not result in improved sensitivity to change. However,
it cannot be said which instrument is correct. Clearly, the
SF-6D measures something else than the EQ-5D, and
these instruments cannot be used interchangeably.
Currently, there is no clear benefit in using the SF-6D in
clinical studies instead of the EQ-5D, as the SF-6D is not
clearly better. As the EQ-5D presently is generally
accepted, it may be preferred, thus obtaining results com-
parable with previous studies.
Authors' contributions
HFvS participated in the design of the study, performed
the statistical analysis and drafted the manuscript. EB con-
ceived of the study and participated in it's design. Both
authors read and approved the final manuscript.
Acknowledgements
Financial support for this study was provided in part by grant 2002B45 from
the Netherlands Heart Foundation and in part by grant OG 98–026 from
the Netherlands National Health Insurance Council. The authors thank the
Octopus study group for providing the data.
References
1. Brooks R: EuroQol: the current state of play. Health Policy 1996,
37:53-72.
2. Rabin R, de Charro F: EQ-5D: a measure of health status from
the EuroQol Group. Ann Med 2001, 33:337-343.
3. Furlong WJ, Feeny DH, Torrance GW, Barr RD: The Health Utili-
ties Index (HUI) system for assessing health-related quality
of life in clinical studies. Ann Med 2001, 33:375-384.
4. Brazier J, Roberts J, Deverill M: The estimation of a preference-
based measure of health from the SF-36. J Health Econ 2002,
21:271-292.
5. Ware JE, Snow KK, Kosinski M, Gandek B: SF-36 Health Survey Manual
and Interpretation Guide Boston, MA, New England Medical Center,
The Health Institute; 1993.
6. Brazier J, Usherwood T, Harper R, Thomas K: Deriving a prefer-
ence-based single index from the UK SF-36 Health Survey. J
Clin Epidemiol 1998, 51:1115-1128.
7. Brazier J, Jones N, Kind P: Testing the validity of the Euroqol
and comparing it with the SF-36 health survey question-
naire. Qual Life Res 1993, 2:169-180.
8. Harper R, Brazier JE, Waterhouse JC, Walters SJ, Jones NM, Howard
P: Comparison of outcome measures for patients with
chronic obstructive pulmonary disease (COPD) in an outpa-
tient setting. Thorax 1997, 52:879-887.
9. Jenkinson C, Gray A, Doll H, Lawrence K, Keoghane S, Layte R: Eval-
uation of index and profile measures of health status in a ran-
domized controlled trial. Comparison of the Medical
Outcomes Study 36-Item Short Form Health Survey, Euro-
Qol, and disease specific measures. Med Care 1997,
35:1109-1118.
10. Jenkinson C, Stradling J, Petersen S: How should we evaluate
health status? A comparison of three methods in patients
presenting with obstructive sleep apnoea. Qual Life Res 1998,
7:95-100.
11. Bosch JL, Halpern EF, Gazelle GS: Comparison of preference-
based utilities of the Short-Form 36 Health Survey and
Health Utilities Index before and after treatment of patients
with intermittent claudication. Med Decis Making 2002,
22:403-409.
12. van Dijk D, Nierich AP, Jansen EWL, Nathoe HM, Suyker WJL,
Diephuis JC, van Boven WJ, Borst C, Buskens E, Grobbee DE, Robles
de Medina EO, de Jaegere PPT: Early Outcome After Off-Pump
Versus On-Pump Coronary Bypass Surgery: Results From a
Randomized Study. Circulation 2001, 104:1761-1766.
13. Nathoe HM, van Dijk D, Jansen EW, Suyker WJ, Diephuis JC, van
Boven WJ, de la Riviere AB, Borst C, Kalkman CJ, Grobbee DE,
Buskens E, de Jaegere PP: A comparison of on-pump and off-
pump coronary bypass surgery in low- risk patients. N Engl J
Med 2003, 348:394-402.
14. van Dijk D, Nierich AP, Eefting FD, Buskens E, Nathoe HM, Jansen
EWL, Borst C, Knape JTA, Bredee JJ, de Medina EOR: The Octopus
Study: Rationale and Design of Two Randomized Trials on
Publish with Bio Med Central and every
scientist can read your work free of charge
"BioMed Central will be the most significant development for
disseminating the results of biomedical research in our lifetime."
Sir Paul Nurse, Cancer Research UK
Your research papers will be:
available free of charge to the entire biomedical community
peer reviewed and published immediately upon acceptance
cited in PubMed and archived on PubMed Central
yours — you keep the copyright
Submit your manuscript here:
/>BioMedcentral
Health and Quality of Life Outcomes 2006, 4:20 />Page 9 of 9
(page number not for citation purposes)
Medical Effectiveness, Safety, and Cost-Effectiveness of
Bypass Surgery on the Beating Heart. Controlled Clinical Trials
2000, 21:595-609.
15. Eefting F, Nathoe H, van Dijk D, Jansen E, Lahpor J, Stella P, Suyker
W, Diephuis J, Suryapranata H, Ernst S, Borst C, Buskens E, Grobbee
D, de Jaegere P: Randomized Comparison Between Stenting
and Off-Pump Bypass Surgery in Patients Referred for Angi-
oplasty. Circulation 2003, 108:2870-2876.
16. Dolan P: Modeling valuations for EuroQol health states. Med
Care 1997, 35:1095-1108.
17. Essink-Bot ML, Bonsel GJ: Naar standaardisatie van het instru-
mentarium voor het meten van de gezondheidstoestand.
Huisarts Wet 1995, 38:117-121.
18. Altman DG: Practical Statistics for Medical Research London, Chapman
& Hall; 1991.
19. Bland JM, Altman DG: Statistical methods for assessing agree-
ment between two methods of clinical measurement. Lancet
1986, 1:307-310.
20. Walters SJ, Brazier JE: What is the relationship between the
minimally important difference and health state utility val-
ues? The case of the SF-6D. Health Qual Life Outcomes 2003, 1:4.
21. Pickard AS, Johnson JA, Feeny D: Responsiveness of generic
health-related quality of life measures in stroke. Qual Life Res
2005:207-19.
22. Read JL, Quinn RJ, Berwick DM, Fineberg HV, Weinstein MC: Pref-
erences for health outcomes. Comparison of assessment
methods. Med Decis Making 1984, 4:315-329.
23. Krabbe PF, Essink-Bot ML, Bonsel GJ: The comparability and reli-
ability of five health-state valuation methods. Soc Sci Med
1997, 45:1641-1652.
24. Brazier J, Roberts J, Tsuchiya A, Busschbach JJ: A comparison of the
EQ-5D and the SF-6D across seven patient groups. Health
Econ 2004, (13):873-84.
25. Bryan S, Longworth L: Measuring health-related utility : why
the disparity between EQ-5D and SF-6D . Eur J Health Econ
2005:253-60.
26. Longworth L, Bryan S: An empirical comparison of EQ-5D and
SF-6D in liver transplant patients. Health Econ 2003,
12:1061-1067.
27. Kopec JA, Willison KD: A comparative review of four prefer-
ence-weighted measures of health-related quality of life. J
Clin Epidemiol 2003, 56:317-325.
28. Hawthorne G, Richardson J, Day NA: A comparison of the
Assessment of Quality of Life (AQoL) with four other
generic utility instruments. Ann Med 2001, 33:358-370.
29. Conner-Spady B, Suarez-Almazor ME: Variation in the Estimation
of Quality-adjusted Life-years by Different Preference-based
Instruments.[Article]. Med Care 2003, 41:791-801.