báo cáo hóa học:" Prevalence of visual impairment in relation to the number of ophthalmologists in a given area: a nationwide approach" ppt
Bạn đang xem bản rút gọn của tài liệu. Xem và tải ngay bản đầy đủ của tài liệu tại đây (268.48 KB, 8 trang )
BioMed Central
Page 1 of 8
(page number not for citation purposes)
Health and Quality of Life Outcomes
Open Access
Research
Prevalence of visual impairment in relation to the number of
ophthalmologists in a given area: a nationwide approach
Antoine J Lafuma
1
, Antoine P Brézin
2
, Francis L Fagnani
1
, Mounir Mesbah
3
and Gilles H Berdeaux*
4,5
Address:
1
Cemka, 43, Boulevard du Maréchal Joffre, F-92340 Bourg-la-Reine, France,
2
Centre Hospitalier Universitaire Cochin, Service
d'Ophtalmologie, 24 rue du Faubourg Saint Jacques, F-75014 Paris, France,
3
Université Pierre Et Marie Curie, (UPMC), Laboratoire de Statistique
Theorique et Appliquée,175 rue du Chevaleret, F-75013 Paris, France,
4
Conservatoire National des Arts et Métiers, 292, rue Saint-Martin, F-75003
Paris, France and
5
Alcon France. 4 Rue Henri Sainte Claire Deville, F-92563 Rueil-Malmaison, France
Email: Antoine J Lafuma - ; Antoine P Brézin - ;
Francis L Fagnani - ; Mounir Mesbah - ; Gilles H Berdeaux* -
* Corresponding author
Abstract
Background: Sociological and economic risk factors of visual impairment have never been
described in France at a national level as the association between the number of ophthalmologists
per inhabitant and visual impairment prevalence.
Methods: Two national surveys were pooled. First, 2075 institutions were selected at random
from the French Health Ministry files. Second, a random, stratified sample of 356,208 citizens living
in the community was selected. Blindness and low vision (LV) prevalence rates were estimated by
age and gender. Geographical equities were estimated by logistic regression adjusted on age and
occupational category. The association between ophthalmologist density and visual impairment
prevalence rate was estimated per region. Interviews were completed with 14,603 (94.9%) of
15,403 randomly selected subjects in institutions, and 16,945 (77.8%) of 21,760 randomly selected
subjects in the community. Three groups were defined from the interviews: low vision, blind, and
control.
Results: Prevalence rates were LV 2.08% and blindness 0.12%. Both rates increased exponentially
with age. No major difference was found with gender. Injury was the declared reason for both LV
(12%) and blindness (12%). Large regional differences in prevalence persisted for LV after
adjustment on age and occupation (ORs: 0.35 to 2.10), but not for blindness. Regions with
ophthalmologists below the national per capita average were usually those with higher LV
prevalence.
Conclusion: An inverse correlation was found between ophthalmologist number and LV
prevalence rates for subjects of similar age and socio-professional category. This denoted possible
inequity in the provision of healthcare.
Published: 06 June 2006
Health and Quality of Life Outcomes 2006, 4:34 doi:10.1186/1477-7525-4-34
Received: 16 February 2006
Accepted: 06 June 2006
This article is available from: />© 2006 Lafuma et al; licensee BioMed Central Ltd.
This is an Open Access article distributed under the terms of the Creative Commons Attribution License ( />),
which permits unrestricted use, distribution, and reproduction in any medium, provided the original work is properly cited.
Health and Quality of Life Outcomes 2006, 4:34 />Page 2 of 8
(page number not for citation purposes)
Background
Visual impairment was responsible for 2,286,000 'disabil-
ity adjusted life years' in the high income countries in
2001 [1]. The cost of blindness to the Australian govern-
ment and community was estimated at between AUS$
9,749 and AUS$ 26,720 per patient per year [2]. The mean
cost per blind person per year was US$ 11,896 in 1990 in
the USA and totalled US$ 4 billion [3]. Therefore, it is cru-
cial to obtain nationwide estimates of low vision and
blindness prevalence to allocate the right amount of
resources especially when life expectancy is predicted to
increase [4,5]. It is also important to understand the
causes of visual impairment, in order to implement ade-
quate preventative activities.
According to the International Statistical Classification of
Diseases, Injuries and Causes of Death, visual impairment
includes both low vision and blindness. Low vision is
defined as visual acuity less than 6/18, but equal to or bet-
ter than 3/60, or a corresponding visual field loss to less
than 20 degrees in the better eye using best possible cor-
rection. Blindness is defined as visual acuity less than 3/
60, or a corresponding visual field loss to less than 10
degrees in the better eye using best possible correction [6].
Primary open-angle glaucoma and age-related macular
degeneration are the main two diseases leading to blind-
ness in Western developed countries. Apart from cataract
surgery, treatments are available which at best maintain
vision, or otherwise postpone visual acuity deterioration.
A significant portion of the burden caused by visual
impairment is borne by families and includes rehabilita-
tion, medical devices, dedicated software, home modifica-
tions, caring time, loss of family revenue, etc Nationwide
extrapolation has shown that the non-medical costs of vis-
ual impairment were comparable to the nationally reim-
bursed drug budget [7]. It is therefore crucial to obtain
nationwide estimates of low vision and blindness preva-
lence rates so that sufficient resources are allocated appro-
priately (medical and non-medical), especially when
increasing life expectancy is predicted to continue [8].
The use of registers to estimate the prevalence of blindness
is controversial, since a high proportion of visually
impaired subjects do not register [9-12]. According to a
WHO review on the prevalence of blindness, ten surveys
were conducted in Europe up to 1994 [13]. An update was
performed in 2002 [14]. Most studies were conducted at a
local level, using direct standardisation to derive national
estimates. This technique was used by the Eye Diseases
Prevalence Research Group [15]. However, local surveys
do not estimate disparities in prevalence rate amongst dif-
ferent geographical areas.
Healthcare expenditure has increased substantially in all
Western industrialised countries during the last decades
[16]. As a result, efficiency in resource allocation has
become a major issue in public health decisions, but
equity is very important, too, as stated by the National
Institute for Clinical Excellence [17]. Equity is necessary to
ensure that two patients, suffering from a similar disease,
have access to the same quality of care, and experience the
same clinical outcome. However, equity and efficiency
(cost per unit of production) are incompatible [18], so
political decisions must be made. Such decisions should
be based on studies aimed at quantifying acceptable levels
of inequity, in order to accommodate fixed budgets. Little
has been published on equity and eye care delivery [19].
The issue of equity might differ according to healthcare
systems, e.g., as between France and the United Kingdom.
Some econometric surveys confirm the existence of 'phy-
sician-induced demand' in the French system of ambula-
tory care, which causes healthcare expenditure to increase
[20]. This relationship has been used for decades to justify
limits on the number of students entering medical
schools. It is contrary to the idealistic theory that an opti-
mal number of physicians would maximise efficient
healthcare provision. In this context, a link between the
demography of ophthalmologists and the prevalence of
both low vision and blindness has never been studied.
The present survey had three aims: (1) to identify patient
demographic risk factors of visual impairment; (2) to
compare a visual impairment index across the different
regions of France; and (3) to study the relationship
between this index and ophthalmologist demographics.
Methods
Data were gathered in two surveys by the Institut National
de la Statistique et des Etudes Economiques (INSEE) [21].
The databases were subsequently made available to
researchers for secondary analyses. The methodology of
these two surveys has already been described [22-24] else-
where. The following is a condensed description which
should help readers to understand and interpret the
results.
Experimental design: the community survey
A national census survey is performed every ten years in
France. Each household is visited by an interviewer and
data are collected on each member of the family. Informa-
tion was provided by one person of the household. All
French people (no age limits) are questioned and answer-
ing is compulsory.
A "Handicap-Dependency" survey documented "handi-
cap", incapacity and dependency of French citizens, living
Health and Quality of Life Outcomes 2006, 4:34 />Page 3 of 8
(page number not for citation purposes)
in the community, at a national level. It was decided to
piggy-back on the 1999 national census survey.
The survey followed guidelines and principles for devel-
oping disability statistics, published by the United
Nations [25]. The sample was selected by a two-step proc-
ess [26,27].
1. In 1990, 57,831,816 citizens were documented and sta-
tistics on geographical area were available. During the
1999 national census a filtering survey called "Everyday
Life and Health" was added. A total of 2,275 geographical
areas were picked at random from the 1990 survey, strati-
fied by departments nested within regions, by family, and
by socio-professional statistics. The survey consisted of a
self-administered 18-item questionnaire that collected
information on activities of daily living. Ultimately, 2,223
of the 2,275 geographical areas (97.7%) collaborated in
the Everyday Life and Health survey. From the 399,784
questionnaires distributed, 359,010 were completed and
returned (89.1%). Questionnaires were to be answered by
(or for) all members of a household. This survey did not
check the validity of proxy respondents. Non-French
speakers having no translation support were unable to
answer the questionnaire.
2. Subjects from the Everyday Life and Health survey were
clustered into six impairment groups ranging from no
impairment (group 1) to severe impairment (group 6),
based upon an impairment severity score [27]. Subjects in
the severe impairment group had a higher probability of
being detected by the Handicap-Dependency survey than
did those in the Everyday Life and Health survey [22]. This
over-sampling method made it possible to describe the
consequences of impairments in detail, since subjects
with impairments were over-represented in the Handicap-
Dependency survey. Face-to-face interviews were available
for 16,945 (77.8%) of 21,760 subjects selected at random
from the 'Everyday Life and Health' respondents.
Experimental design: the institution survey
Institutions were selected at random from the French
Health Ministry files; day-care centres were not included.
The sample was stratified according to eighteen strata
[24]. The probability of selecting an institution was
inversely proportional to the number of institutions in its
stratum and proportional to its number of beds. Eight
subjects were picked at random by the interviewers from
each resident list.
In 1998, 2,075 institutions were selected and 155 of them
(7.5%) refused to participate. The three most frequent rea-
sons for refusal were lack of time (22.7%), the non-com-
pulsory character of the INSEE survey (10.7%), and lack of
staff to help the interviewer (7.3%). In total, 14,611 inter-
views (94.9%) were performed with 15,403 randomly
selected subjects. Analyses were performed on 14,603
subjects with documented impairments, except for eight
cases where interviews were stopped before impairments
could be documented.
Data collected
The survey documented blindness and low vision as
declared by subjects, with no medical input. Three formal
questions specific to vision were asked during the inter-
view: (1) "Do you have trouble reading newspapers,
books, etc with spectacles, if you use them?" (2) "Do
you have trouble recognising the features of someone
standing four meters away from you (with spectacles or
contact lenses, if you usually use them)?" (3) "Would you
say you are completely blind (light perception at the best),
partially blind (still-form perception), or visually
impaired?". Data were collected descriptively and experts
in medical coding performed post hoc classifications of
declared diseases. Thus, subjects were classified as belong-
ing to one of the following groups: (1) blind; (2) low vis-
ual acuity; or (3) control (i.e. neither blind nor low
vision). The cause of impairment was elicited by an open-
ended question: "What is the cause of the stated impair-
ment?" The free text was then coded by the interviewer
under one of four broad categories: disease, birth-related,
injuries, others.
Ophthalmologists' demography was derived from
national statistics [21,28] published by the French Minis-
try of Health (Ministère de la Santé et des Solidarités). The
Direction de la Recherche, des Études, de l'Évaluation et des
Statistiques is in charge of up-dating the ophthalmologists'
demography, amongst others statistics. We used 2002
data as proxy for regional eye-care services.
Statistical analysis
Analyses were conducted with SAS Institute (North Caro-
lina) software release 8.2. Weights for extrapolating data
to the entire population were estimated by INSEE from
the 1999 national census. These weights were applied to
the Everyday Life and Health survey of impairment sever-
ity, refusal to participate in the Handicap-Dependency
survey, and age, gender, size of household, type of house-
hold and geographical area size based on the latter survey.
For the institution survey, weights included size of strata,
the institution occupation rate (number of subjects in the
institution/number of available beds), and the answer
refusal rate (higher in psychiatric centres).
A weighted logistic regression was used to identify risk fac-
tors. One regression identified the risk factors for blind-
ness (blind versus no visual impairment) and another the
risk factors for low vision (low vision versus no visual
impairment). The reference state was "no visual impair-
Health and Quality of Life Outcomes 2006, 4:34 />Page 4 of 8
(page number not for citation purposes)
ment". Risk factors included in the models were age (con-
tinuous variable), job classification (Reference farmer)
and national region (Reference Ile de France). Odds-ratios
with 95% confidence limits are presented. Age and job
classification factors were chosen to adjust on the socio-
economic variability amongst French regions (e.g., people
living on the French Riviera are older and richer than
those living in the North).
Results
Altogether, 16,945 questionnaires were collected by the
community survey and 14,603 by the institution survey.
2,703 subjects declared low vision and 350 blindness.
Extrapolation to the national level predicted that 664,253
of 58,096,060 subjects (1.14%) lived in institutions. Peo-
ple living in institutions were older and less frequently
male than those in the community. Additional descriptive
information (socio-demographics, co-morbidity, etc )
of this population can be found elsewhere [22-24].
Prevalences of low vision and blindness increased expo-
nentially with age (Table 1). More than one-quarter of
patients older than 90 years declared a visual impairment.
Responses of centenarians were few and should be inter-
preted with caution.
The major cause of blindness declared by subjects was
acquired diseases (Table 2). 21,600 blindness were con-
genital and 35,000 were acquired. The figures for LV were
179,000 and 660,000, respectively. About 160,800
instances of blindness and low vision could be avoided in
France by accident prevention.
The prevalence of visual impairment was similar between
the sexes. After adjustment on age and region, people
exempted from employment, and those working as arti-
sans, shopkeepers or business-owners, had significantly
less risk of developing low vision (odds-ratios 2.10 and
1.51, respectively) than did farmers (Table 3). Persons
with no professional activity had a higher probability
(odds-ratio 0.28) of developing blindness than farmers.
After adjustment on age (more old people live in the
South of France) and job classification (GDP in northern
regions is lower), the prevalence of blindness did not dif-
fer significantly (95% CL) between regions (Table 4). The
picture was different for low vision. In seven regions the
probability of developing low vision (odds-ratios
between 0.35 and 0.59) was significantly higher than in
Ile-de-France, and only one region had a statistically sig-
nificant lower probability (odds-ratio 2.10). On compar-
ing range extremes, people of the same age and job
classification had 6.0 more risk of low vision if they lived
in Poitou-Charentes than in Haute-Normandie.
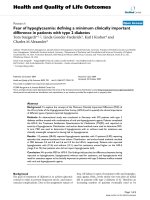
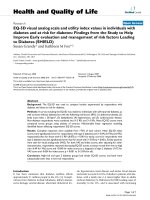
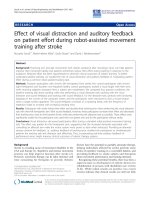
A [non-significant] linear trend in Figure 1 indicates that
the probability of low vision decreases as the density of
ophthalmologists (number of ophthalmologists per
100,000 inhabitants) increases, after adjustment on age
and job classification. Also, six of the seven regions with
significantly higher prevalence rates of low vision had
ophthalmologist densities below the national average.
Discussion
The surveys analysed shared two limitations: (1) their
cross-sectional design did not allow an analysis of possi-
ble causalities between blindness, or low vision, and risk
factors; and (2) the actual visual acuity of subjects who
responded was not measured by ophthalmologists. Sub-
jects classified as blind self-declared that they could not
perceive shapes. This may be a serious limitation to our
analyses, although our prevalence figures are close to the
only French report in the international literature [29]. On
the other hand, we did study representative samples of
subjects from both the community and institutions.
Another issue concerns the small number of subjects who
declared themselves blind, which resulted in large OR
confidence intervals.
Table 1: Prevalence of low vision in all populations (persons living at home or in institutions). 95% confidence interval. n.e. not
estimable
Age (years) Persons living in institution and at
home (n = 58,096,060)
Prevalence of low vision Prevalence of blindness
0–9 0.62% [0.32%,1.20%] <0.001% [0.00%,2.37%]
10–19 0.27% [0.12%,0.60%] 0.03% [0.00%,0.45%]
20–29 1.34% [0.77%,2.33%] 0.02% [0.00%,0.42%]
30–39 0.29% [0.14%,0.63%] 0.02% [0.00%,0.39%]
40–49 1.91% [1.13%,3.21%] 0.06% [0.01%,0.59%]
50–59 1.30% [0.73%,2.31%] 0.11% [0.01%,0.99%]
60–69 3.06% [1.82%,5.11%] 0.21% [0.03%,1.65%]
70–79 5.92% [3.64%,9.48%] 0.09% [0.01%,0.97%]
80–89 14.10% [8.90%,21.62%] 0.91% [0.12%,6.4%]
90–99 23.13% [14.18%,35.41%] 4.73% [0.68%,26.43%]
100 + 33.71% [n.e.] 3.27% [n.e.]
Health and Quality of Life Outcomes 2006, 4:34 />Page 5 of 8
(page number not for citation purposes)
The different relationships between age and the preva-
lence rates of low vision and blindness may be explained
by the different reasons given by subjects for the impair-
ments. A considerable proportion of blindness was
related to pregnancy and childbirth, whereas the main
cause of low vision was attributed to acquired diseases. In
other words, a significant proportion of blindness is not
managed by ophthalmologists, which might explain the
lack of association between ophthalmologist density and
the blindness prevalence rate Lastly, most diseases affect-
ing vision in developed countries do not make patients
immediately blind since treatments are available and
costs reimbursed. Therefore, most patients have had low
vision before becoming blind. However, since the cause of
visual impairment was self-declared and was not medi-
cally certified, apparent differences between the causes of
low vision and blindness might be explained by recall
bias.
It should be noted that one-in-eight visual impairments
were related to injury. Therefore, preventative measures
would have avoided some cases of low vision and blind-
ness, which totalled 152,400 and 8,400 total persons,
respectively, for a country with 58,000,000 inhabitants.
Persons with higher educational achievement were less at
risk for low vision, but this was not so for blindness.
Higher education enables people to become better
informed about potential diseases related to ageing, and
gives them more effective access to healthcare.
Table 2: Causes of blindness and low vision declared by the respondents.
Cause declared by respondent Low vision Blind
Pregnancy and/or birth complications,
congenital or hereditary disease
14.9% 30.9%
Acquired diseases 55.3% 50.2%
Injuries 12.4% 12.0%
Other or unknown 17.4% 6.9%
Relationship between the number of ophthalmologists per 100,000 inhabitants and the OR (adjusted on age and socio-profes-sional categories) for low vision per regionFigure 1
Relationship between the number of ophthalmologists per 100,000 inhabitants and the OR (adjusted on age and socio-profes-
sional categories) for low vision per region. Reference: "Ile de France". Dotted line: linear regression. Region ORs that differed
significantly from 1 are underlined. An OR greater than 1 means less risk of developing low vision. PACA: Provence-Alpes-
Côtes d'Azur.
Health and Quality of Life Outcomes 2006, 4:34 />Page 6 of 8
(page number not for citation purposes)
When the present data were collected, access to ophthal-
mologists in France did not require referral by general
practitioners. In addition, more than 95% of French peo-
ple have private insurance supplementing their national
sick fund protection [30]. Insurance policies cover hospi-
talisation costs and all out-patient care: drugs, visits,
examinations, etc Average patient co-payment in 2001
was 11.1% of total expenditure [31]. These financial pro-
visions were supposed to ensure excellent equity. What we
found, however, was inequity.
It could be expected that people with greater economic
means or greater educational levels might be much more
aggressive in seeking out eye care and some of them might
even be seeking eye cares outside their area. This is why it
was very important to get prevalence rates adjusted on job
description to control for the above effect. In France, most
of the vision is under the control of ophthalmologists: vis-
ual acuity, diagnosis, treatments, etc There is no limita-
tion to access them, outside their availability. The role of
optometrists is very low, almost inexistent. Therefore, the
ophthalmologist density could be considered as a good
indicator of resources available to preserve vision at a
national level.
After adjusting on age and job classification, our analysis
showed that differences existed between geographic
regions with respect to the prevalence of low vision. Sub-
Table 4: Probability of developing low vision or blindness according to region, adjusted on age and job categories. An OR greater than
1 means less risk of develop low vision. Reference category is "Ile de France", i.e. Paris and its suburb.
Low vision Blindness
OR 95% CL OR 95% CL
Ile de France (Reference) 1 na 1 Na
Champagne Ardennes 0.82 0.48–1.43 2.38 0.10–58.00
Picardie 0.59 0.37–0.96 0.90 0.11–7.15
Haute-Normandie 0.35 0.23–0.53 1.27 0.13–12.01
Centre 0.52 0.35–0.77 1.36 0.22–8.55
Basse-Normandie 1.57 0.72–3.44 2.79 0.09–88.38
Bourgogne 0.41 0.27–0.62 2.17 0.11–43.46
Nord-Pas-de-Calais 0.63 0.43–0.91 1.34 0.24–7.52
Lorraine 0.73 0.48–1.13 1.82 0.20–16.67
Alsace 1.62 0.88–2.97 1.35 0.16–11.11
France-Comté 1.95 0.86–4.45 0.87 0.10–7.45
Pays de Loire 0.45 0.31–0.64 1.65 0.24–11.38
Bretagne 1.38 0.85–2.26 1.16 0.23–5.75
Poitou-Charentes 2.10 1.04–4.23 1.39 0.19–10.34
Aquitaine 0.49 0.34–0.73 0.76 0.19–3.10
Midy-Pyrénées 1.20 0.70–2.07 1.47 0.21–10.37
Limousin 0.47 0.27–0.81 3.88 0.03–442.19
Rhônes-Alpes 0.74 0.52–1.06 0.87 0.23–3.22
Auvergne 0.62 0.36–1.04 2.24 0.08–59.30
Languedoc-Roussillon 0.75 0.47–1.20 0.64 0.15–2.77
Provence-Alpes-Côtes
d'Azur
0.77 0.54–1.12 0.64 0.20–2.03
Table 3: Probability of developing low vision or blindness according to job classification, adjusted on age and region. An OR greater
than 1 means less risk of visual impairment. Reference category is 'Farmer'.
Low vision Blindness
OR 95% CL OR 95% CL
Farmer (Reference) 1.00 na 1.00 na
Artisan, shopkeeper,
business owner
1.51 1.12–2.03 0.91 0.33–2.51
Exempt 2.10 1.34–3.28 1.40 0.29–6.71
Part-time worker 1.08 0.79–1.47 3.60 0.42–31.09
Employee 0.96 0.71–1.32 0.91 0.27–3.03
Unskilled worker 0.97 0.77–1.21 1.38 0.53–3.62
No professional activity 1.11 0.66–1.86 0.28 0.08–0.96
Unclassified 1.34 0.81–2.20 1.05 0.18–6.29
Health and Quality of Life Outcomes 2006, 4:34 />Page 7 of 8
(page number not for citation purposes)
jects living in Haute-Normandie had a 2.86 greater chance
of developing low vision than people in the Paris area,
whereas persons in Poitou-Charentes had a 2.10 lower
chance than Parisians. In contrast, an association was
found between ophthalmologist density (number/
100,000 inhabitants) and the regional distribution of low
vision. Thus, seven of eight regions (85.7%) with a signif-
icantly higher prevalence of low vision had ophthalmolo-
gist densities below the national average. This suggests
that the supply of vision-related services may be a deter-
minant of eye morbidity at a national level.
To confirm these findings, it would be worthwhile to
study the relationship between regional visual impair-
ment rates and indicators of other eye-care activities, such
as number of visits/inhabitant, glaucoma diagnosis cam-
paign, etc Inequality of quality of care could also be a fac-
tor explaining the prevalence rate differences across the
regions. Unfortunately, such aspects of ophthalmological
activity or quality estimates are unavailable in France at a
regional level Lastly, the same HID surveys showed that
visual impairment impacted dramatically on activities of
daily living [22-24] and had economic consequences on
the family revenue [7]. The latter, alone, might reduce
access to eye-care. Hence, to conclude that a similar den-
sity of ophthalmologists should be provided in all regions
is premature.
However, the causality of the association between the
prevalence of visual impairment in relation to the number
of ophthalmologists in a given area might be confounded
by some factors that were not collected in our surveys.
This encompasses, for example, population genetic factors
distribution across the different areas, other health care
resource supply (access to hospital is more difficult in
rural area), or eating habits (south part of France people
used to eat more fresh fruits and vegetables which is
known to protect against acquired visual impairment).
These are strong limitations to the analyses we conducted
and additional data should be collected to confirm our
findings.
It is interesting that a recent national survey of the UK sys-
tem for delivering care to low vision subjects, involving a
wide range of service providers, also found regional ineq-
uity, as in France [32]. The number of service providers
was lowest in areas where the general population was
small, but the prevalence of low vision was highest. Con-
versely, the number of service providers was highest in cit-
ies where the general population was large, despite the
prevalence of low vision being only moderate.
It is evident that where practitioner remuneration is based
on a fee-for-service, as in France, measures are needed to
control physician-induced demand. However, on a
broader scale, irrespective of the healthcare system, there
is some evidences to justify including a minimum level of
equity in plans to reorganise eye-care services. For exam-
ple, the prevalence of visual impairment in the Auvergne
does not differ significantly from the Ile-de France, yet the
density of ophthalmologists is below the national aver-
age. It would be equitable if such standard were applied to
all regions.
It was not the intention of this paper to demonstrate or
claim the need for a fixed ratio of ophthalmologists to
inhabitants. However, investment in healthcare is sup-
posed to be effective, as resources are limited. Ultimately,
the daily work of ophthalmologists is to preserve vision,
so maintenance of vision or reduction of low vision prev-
alence rates is a legitimate public health aim. We found
some weak associations. This suggests that a minimum
ophthalmologist density might be an aspect to consider
when allocating resources for the preservation of vision.
Conclusion
An association was found between the number of oph-
thalmologists/inhabitants and the prevalence of low
vision, in France. These data suggests that ophthalmolo-
gist density could be one of the drivers of good vision at a
population level.
Competing interests
The author(s) declare that they have no competing inter-
ests.
Authors' contributions
AL and FF retrieved the data bases. The analyses were per-
formed GB. All authors contributed to the writing of the
manuscript.
Acknowledgements
The survey was supported by an unrestricted grant from Alcon Laborato-
ries SA, Rueil-Malmaison, France, was conducted according to local laws,
and was contracted to Cemka, Bourg-la-Reine, France. Alcon France SA
employed Gilles Berdeaux.
References
1. Mathers C, Lopez A, Stein C, Ma Fat D, Rao C, Inoue M, Shibuya K,
Tomijima N, Bernard C, Xu H: Deaths and disease burden by
cause: global burden of disease estimates for 2001 by world
bank country groups. [ />wp18.pdf].
2. Wright SE, Keefe JE, Thies LS: Direct costs of blindness in Aus-
tralia. Clin Experiment Ophthalmol 2000, 28:140-142.
3. Chiang YP, Bassi LJ, Javitt JC: Federal budgetary costs of blind-
ness. Milbank Q 1992, 70:319-340.
4. OECD: Aging in OECD countries. A critical Policy Challenge,
Social Policy study N°. Paris 1997, 20:.
5. OECD: Maintaining propriety in an Aging Society. Paris 1998.
6. Resnikoff S, Pascolini D, Etya'ale D, Kocur I, Pararajasegaram R,
Pokharel G, Mariotti S: Global data on visual impairment in the
year 2002. Bull World Health Organ 2004, 82:844-851.
7. Lafuma A, Brézin A, Lopatriello S, Hieke K, Hutchinson J, Mimaud V,
Berdeaux G: Evaluation of non-medical costs associated with
visual impairment in four European countries (France, Italy,
Publish with BioMed Central and every
scientist can read your work free of charge
"BioMed Central will be the most significant development for
disseminating the results of biomedical research in our lifetime."
Sir Paul Nurse, Cancer Research UK
Your research papers will be:
available free of charge to the entire biomedical community
peer reviewed and published immediately upon acceptance
cited in PubMed and archived on PubMed Central
yours — you keep the copyright
Submit your manuscript here:
/>BioMedcentral
Health and Quality of Life Outcomes 2006, 4:34 />Page 8 of 8
(page number not for citation purposes)
Germany and the United Kingdom). Pharmacoeconomics 2006,
24:193-205.
8. OECD: Aging in OECD countries. A critical Policy Challenge.
Social Policy study N° Paris 1997, 20:.
9. Robinson R, Deutsch J, Jones HS, Youngson-Reilly S, Hamlin DM,
Dhurjon L, Fielder AR: Unrecognised and unregistered visual
impairment. Br J Ophthalmol 1994, 78:736-740.
10. Bruce IW, McKennell AC, Walker EC: Blind and partially sighted
adults in Britain: the RNIB survey. London: HMSO 1991, 1:.
11. Walker EC, Tobin MJ, McKennell AC: Blind and partially sighted
children in Britain: the RNIB survey. London HMSO 1991, 2:.
12. Wormald R, Evans J: Registration of blind and partially sighted
people. Br J Ophthalmol 1994, 78:733-740.
13. Thylefors B, Négrel AD, Pararajasegaram R, Dadzie KY: Available
data on blindness (update 1994). Ophthalmic Epidemiol 1995,
2:5-39.
14. Kocur I, Resnikoff S: Visual impairment and blindness in Europe
and their prevention. Br J Ophthalmol 2002, 86:716-722.
15. The Eye Diseases Prevalence Research Group. Causes and
prevalence of visual Impairment among adults in the United
States. Arch Ophthalmol 2004, 122:477-485.
16. Herwartz H, Theilen B: The determinants of health care
expenditure: testing pooling restrictions in small samples.
Health Econ 2003, 12:113-124.
17. [ />].
18. Mooney G: Economics, medicine and health care. Edited by:
Hemel Hempstead England. Simon & Schuster International group;
1992.
19. Riad SF, Dart JK, Cooling RJ: Primary care and ophthalmology in
the United Kingdom. Br J Ophthalmol 2003, 87:493-499.
20. Delattre E, Dormont B: Fixed fees and physician-induced
demand: a panel data study on French physicians. Health Econ
2003, 12:741-754.
21. [ />].
22. Brézin A, Lafuma A, Fagnani F, Mesbah M, Berdeaux G: Prevalence
and burden of blindness, low vision and visual impairment in
the community: a nationwide survey. Arch Ophthalmol 2005,
123:1117-1124.
23. Brézin A, Lafuma A, Fagnani F, Mesbah M, Berdeaux G: Prevalence
and burden of blindness, low vision and visual impairment in
institution: a nation-wide survey. Health Qual Life Outcomes
2005, 3:27.
24. Brézin A, Lafuma A, Fagnani F, Mesbah M, Berdeaux G: Blindness,
low vision and other handicaps as risk factors of institution.
Br J Ophthalmol 2004, 88:1330-1337.
25. United Nations. Department of Economic and Social Affairs.
Statistics Division. Manual for the development of statistical
information for disability programmes and policies United
Nations Publication, Sales No E96.XVII.4. 1996.
26. Morniche P: L'enquête HID de l'INSEE – Objectifs et shéma
organisationnel. Courrier des Statistiques. Ed INSEE, Paris 1998,
87:88.
27. Couet C: Estimations locales dans le cadre de l'enquête HID.
Institut National de la Statistique et des Etudes
Economique. Séries des documents de travail de la Direction
des statistiques démographiques et sociales. N° F0207. Ed
INSEE. Paris 2002 [
].
28. Sicart D: Les médecins: Estimations au 1er janvier 2002.
Direction de la recherche, des études, de l'évaluation et des
statistiques. Série statistiques, document de travail. n° 44
décembre 2002. Ministère des affaires sociales, du travail et
de la solidarité. Ministère de la santé, de la famille et des per-
sonnes handicapées, Paris. 2002.
29. Queguiner P, Guillaumat L, Gattef C: Epidémiologie de la cécité
dans les Bouches-du-Rhone. Approche méthodologique. Bull
Soc Ophtalmol Fr 1988, 88:21-22. 25–26
30. OECD Health data: A comparative analysis of 30 countries.
2003 [ />]. Services des publica-
tions OECD Paris
31. DRESS [ />]
32. Culham LE, Ryan B, Jackson AJ, Hill AR, Jones B, Miles C, Young JA,
Bunce C, Bird AC: Low vision services for vision rehabilitation
in the United Kingdom. Br J Ophthalmol 2002, 86:743-747.