báo cáo hóa học:" Cross-diagnostic validity in a generic instrument: an example from the Functional Independence Measure in Scandinavia" docx
Bạn đang xem bản rút gọn của tài liệu. Xem và tải ngay bản đầy đủ của tài liệu tại đây (278.17 KB, 8 trang )
BioMed Central
Page 1 of 8
(page number not for citation purposes)
Health and Quality of Life Outcomes
Open Access
Research
Cross-diagnostic validity in a generic instrument: an example from
the Functional Independence Measure in Scandinavia
Å Lundgren-Nilsson*
2
, A Tennant
1
, G Grimby
2
and KS Sunnerhagen
2
Address:
1
Department of Rehabilitation Medicine, Academic Unit of Musculoskeletal Disease, The University of Leeds, 36 Clarendon Road, Leeds,
LS2 9NZ, UK and
2
Sahlgrenska Academy at Göteborg University, Institute of Neuroscience and Physiology/Rehabilitation medicine,
Guldhedsgatan 19 413 45 Göteborg, Sweden
Email: Å Lundgren-Nilsson* - ; A Tennant - ;
G Grimby - ; KS Sunnerhagen -
* Corresponding author
Abstract
Background: To analyse the cross-diagnostic validity of the Functional Independence Measure
(FIM™) motor items in patients with spinal cord injury, stroke and traumatic brain injury and the
comparability of summed scores between these diagnoses.
Methods: Data from 471 patients on FIM™ motor items at admission (stroke 157, spinal cord
injury 157 and traumatic brain injury 157), age range 11–90 years and 70 % male in nine
rehabilitation facilities in Scandinavia, were fitted to the Rasch model. A detailed analysis of scoring
functions of the seven categories of the FIM™ motor items was made prior to testing fit to the
model. Categories were re-scored where necessary. Fit to the model was assessed initially within
diagnosis and then in the pooled data. Analysis of Differential Item Functioning (DIF) was
undertaken in the pooled data for the FIM™ motor scale. Comparability of sum scores between
diagnoses was tested by Test Equating.
Results: The present seven category scoring system for the FIM™ motor items was found to be
invalid, necessitating extensive rescoring. Despite rescoring, the item-trait interaction fit statistic
was significant and two individual items showed misfit to the model, Eating and Bladder
management. DIF was also found for Spinal Cord Injury, compared with the other two diagnoses.
After adjustment, it was possible to make appropriate comparisons of sum scores between the
three diagnoses.
Conclusion: The seven-category response function is a problem for the FIM™ instrument, and a
reduction of responses might increase the validity of the instrument. Likewise, the removal of items
that do not fit the underlying trait would improve the validity of the scale in these groups. Cross-
diagnostic DIF is also a problem but for clinical use sum scores on group data in a generic
instrument such as the FIM™ can be compared with appropriate adjustments. Thus, when planning
interventions (group or individual), developing rehabilitation programs or comparing patient
achievements in individual items, cross-diagnostic DIF must be taken into account.
Published: 23 August 2006
Health and Quality of Life Outcomes 2006, 4:55 doi:10.1186/1477-7525-4-55
Received: 08 March 2006
Accepted: 23 August 2006
This article is available from: />© 2006 Å et al; licensee BioMed Central Ltd.
This is an Open Access article distributed under the terms of the Creative Commons Attribution License ( />),
which permits unrestricted use, distribution, and reproduction in any medium, provided the original work is properly cited.
Health and Quality of Life Outcomes 2006, 4:55 />Page 2 of 8
(page number not for citation purposes)
Background
Medical outcome studies use generic instruments to com-
pare results between different settings with different case
mixes. It is generally thought that they give less informa-
tion about each patient group, but it has also been sug-
gested that well designed generic instruments may be at
least as good as some disease specific instruments [1].
Although many such measures are available, their use in
clinical practice in Europe is limited [2]. While the
demands of clinical management in a hospital setting
requires measures of outcome, there are several factors
that may influence which measure is chosen. For example,
within Europe, outcome measures will need to be adapted
to a particular language [3], and there may thus be a pref-
erence for outcome measures that already have a local
adaptation. The emergence of new techniques to evaluate
the invariance of instrumentation across groups has pro-
vided the opportunity to compare measures used within
and across diagnostic groups at both national and interna-
tional levels in rehabilitation [4]. The FIM™ is mainly a
measure of activity limitation that is used across a wide
range of conditions and in a variety of situations in reha-
bilitation. Assessments are usually made through observa-
tions and the scores are set by consent by the team
members. FIM™ can also be used individually by any
member of the team. It was designed to measure level of
disability regardless of the nature or extent of the underly-
ing pathology or impairment [5] where a change in the
sum score reflects the gain in independence. The Uniform
Data System (UDS) is a central databank facility in Buffalo
to which individual rehabilitation units submit their data
for comparative purposes. The implementation of such an
approach has limitations in that it requires a substantial
(and continuing) investment in quality control, training
and access to a central facility. The validity and reliability
of the FIM™ have been described in reports using different
methods [6,7]. Comparisons across countries in Europe
within diagnostic groups have already been made [4,8,9].
In the present study we consider the health care system,
social environment, hospital settings and culture to be
similar enough that it is acceptable to pool data in Scan-
dinavia.
The Scandinavian countries have a common socio-cul-
tural background. The health care system is very similar
with taxed financed service. Health professionals work
across borders and also patients are treated over the bor-
ders. Thereby we argue that the differences are smaller
than between states in the USA.
This paper is concerned with the cross-diagnostic validity
of the motor items of FIM™ in three neurological diag-
noses, Stroke, Traumatic Brain Injury (TBI) and Spinal
Cord Injury (SCI).
Methods
Admission data from the nine participating Scandinavian
rehabilitation units (one Norwegian, one Danish, seven
Swedish), members of the Pro-ESOR [2] study on in-
patients, were used. From this an equal sample (n = 157)
from each diagnosis was used taken from a total sample of
1661 (stroke 736, SCI 358, TBI 567). For patients with
stroke data came from Sweden and Norway. The Spinal
Cord Injury (SCI) data came from Denmark and data on
patients with TBI from Sweden.
Functional Independence Measure
The FIM™ consists of 13 motor and 5 social-cognitive
items, assessing self-care, sphincter, management, trans-
fer, locomotion, communication, social interaction and
cognition [5,10]. It uses a 7-level scale anchored by
extreme rating of total dependence as 1 and complete
independence as 7; the intermediate levels are: 6 modified
independence, 5 supervision or set up, 4 minimal contact
assistance or the subject expends >75% of the effort, 3
moderate assistance or the subjects expends 50 to 74% of
the effort, and 2 maximal assistance or the subject
expends 25 to 49% of the effort.
The FIM™ was originally developed as an 18-item scale,
but it was later shown that it was possible to treat it as two
separate scales, a 13-item motor and a 5-item social-cog-
nitive scale [11]. The present study used only data from
the FIM™ motor scale. Data were collected on admission
according to the FIM™ manual. FIM™ has been used in
Sweden since 1991 and training has been given to new
users. Training was also given to the Norwegian centres
and Denmark. The centres did however not have to state
which version of the manual was used, however the man-
uals are quite similar.
Rasch analysis
The Rasch model [12] was used as the methodological
basis for examining the internal construct validity, the
scaling properties of the FIM™ motor items, the possibility
of a sum comparison between diagnoses and, where
appropriate, through analysis of Differential Item Func-
tioning (DIF), its cross-diagnostic validity. The Rasch
model is a unidimensional model that asserts that the eas-
ier the item, the more likely it will be affirmed, and the
more able the person, the more likely he or she will affirm
an item compared with a less able person. The model used
in the present study is the Partial Credit Model [13] cho-
sen after testing if the data met the assumption of the Rat-
ing Scale Model with Fisher's likelihood ratio test between
the two models :
ln
P
P
b
nik
nik
nik
1
1
−
⎛
⎝
⎜
⎞
⎠
⎟
=−
−
θ
Health and Quality of Life Outcomes 2006, 4:55 />Page 3 of 8
(page number not for citation purposes)
which is the log-odds of person n affirming category k in
item i;
θ
is person ability, b is the item difficulty parame-
ter,
τ
k
is the difficulty of the k threshold, and P
nik
is the
probability for person n to answer item i in category k. The
units of measurement obtained form the equation are
called "logits", which is a contraction of log-odds proba-
bility units. When the observed response pattern coin-
cides with or does not deviate too much from the expected
response pattern, then the items constitute a true Rasch
scale [14]. Test of fit to the Rasch model is preceded by a
number of overall tests and by tests of fit for individual
items. The latter are given in the form of residual values
(the standardised difference between the observed and
the expected score for each person), which should be
between -2.5 and 2.5 [15], and Chi-Square statistics,
which should show non-significant deviation from the
model expectation. The Chi-Square values are calculated
on the basis of ability groups (or Class Intervals) of
approximately 50 people to which the patients are
assigned on the basis of their total score. Three overall
summary fit statistics are given; 1) Overall item and 2)
person fit statistics approximate a normal distribution
with a mean of 0 and standard deviation of 1 when data
fit the model and 3) An item trait interaction statistic
which tests that the hierarchical ordering of the items
remains the same for discrete groups of patients across the
trait. This is reported as a chi-square statistic, and proba-
bility should be greater than 0.05 (no significant differ-
ence).
Due to the number of tests of fit undertaken (e.g. 13 for
each item in the motor scale) Bonferroni corrections were
applied giving a significant p-value of 0.004 for the motor
FIM™ [16]. In addition to these overall fit statistics a Per-
son Separation Index (PSI) is calculated as the base for
estimating internal consistency reliability, where the esti-
mates on the logit scale for each person are used to calcu-
late reliability. The interpretation is similar to Cronbach's
ά. The PSI and indicates the degree to which the scale can
separate patients into discrete groups. A value of 0.7 is the
minimum required to discern two groups [17]. Finally,
confirmation of local independence of items (no residual
associations in the data after the Rasch trait has been
removed) confirms unidimensionality [18].
Analytical strategy and procedure
The first step in analysing the psychometric quality of the
FIM™ motor items in the present study was to examine the
use of the rating scale in each diagnosis, together with the
hierarchical ordering of the items. Where disordered
thresholds were found, categories were collapsed. The
threshold represents the equal probability point between
any two adjacent categories within an item. The threshold
is the level at which the likelihood of failure to agree with
or endorse a given response category below the threshold
equates to the likelihood of agreeing with or endorsing
the category above the threshold. Estimates should be cor-
rectly ordered (i.e. increasing in value) if the categories are
being assigned in the intended way.
Where thresholds are disordered categories are collapsed
and in the current study collapsing was done by using
headings of the categories in the FIM™ manual and clini-
cal judgement, keeping the categories at the ends and col-
lapsing the middle ones. This was followed by analyses of
individual item fit to the model where only positive resid-
uals, above 2.5, were considered, since negative residuals
do not threaten the construct but simply do not provide
more information for the analysis. Item-trait fit was also
taken into account. The same procedure was repeated for
the pooled data.
The next step was an examination for DIF, a requirement
of measurement is invariance across groups. Items that do
not yield the same item response function for two or more
groups display DIF and violate the requirement of unidi-
mensionality [19]. Consequently it is possible to examine
whether or not a scale works in the same way by contrast-
ing the response function for each item across groups. For
tests of DIF, a sample size of 200 or less has been sug-
gested as adequate [20]. DIF may manifest itself as a con-
stant difference between countries/diagnosis across the
trait (Uniform DIF – the main effect), or as a variable dif-
ference, where the response function of the two groups
cross over (Non-uniform DIF – the interaction effect).
Both the country/diagnosis/clinical factor and the interac-
tion with the Class Interval (level of the trait) might be sig-
nificant in some cases, as with any ANOVA's main and
interaction effects. Tukey's post hoc tests determine where
the statistically significant differences are to be found
where there are more than two groups. This process has
been described in more detail in another paper [4].
Where DIF identified the items were substituted for a
series of diagnosis-specific items (e.g. Bathing becomes
Bathing – SCI, Bathing – stroke, etc.). For each diagnosis,
only the scores observed in its corresponding item are
considered, while the other items are assigned structural
missing values. Subsequent analysis is undertaken on this
expanded data set (i.e. original plus split items).
Finally, when data are found to fit the Rasch model, as
defined by acceptable fit statistics and the absence of DIF,
a test of the assumption of local independence is under-
taken to confirm the unidimensionality of the scale. This
is based upon an examination of the patterning in the
residuals and the magnitude of the fist residual compo-
nent in a Principal Component Analysis of the residuals.
This analytical strategy has been described in detail in ear-
lier studies [4,8,21-23]
Health and Quality of Life Outcomes 2006, 4:55 />Page 4 of 8
(page number not for citation purposes)
An analysis of the clinical meaning of the DIF problem
was then conducted by testing whether the meaning of the
summed score reflected the same amount of independ-
ence between the SCI, TBI and stroke pooled data. This
was done by test equating, a procedure used to place item
parameter estimates on the same scale when multiple test
forms are given to examinees [24]. In RUMM2020 test
equating can be explored graphically by comparing the
raw-score to logit transformation graph for each test, and
tables are produced for the raw score logit estimate values,
which can be exported for further analysis.
To achieve test equating the data are stacked and racked
[25], creating one item block for each of the three diag-
noses linked by a block of the "original" items for all diag-
noses together. Thus the original item set creates the link
by having all cases in a vertical set (stacked) and the diag-
nosis specific items are then replicated horizontally
(racked) with structural missing values for those cases not
of that diagnosis. This will give items with missing values
for the unique diagnostic items, e.g. Eating SCI will have
missing values for stroke and TBI patients. This approach
is sustainable since the Rasch model allows missing values
[26-28]. This means in this study that the item blocks for
each diagnosis can be considered as multiple tests or
instruments. The test equating was done after adjustment
of disordered thresholds, with the same scoring model for
all item blocks (diagnoses). The relationship between the
logit value for the summed score between the item blocks
(diagnosis) was visually inspected and statistically ana-
lysed, where a difference of more than 0,65 logits at the
margins and 0,30 in the middle [29] was considered clin-
ical relevant.
The Rasch analysis was carried out with the RUMM2020
software [30].
Results
Scaling properties and fit within diagnoses
In the current analysis we used the Partial Credit Model as
the data did not meet the assumption of the Rating Scale
Model with a significant likelihood ratio test between the
two models (p = <.0000001). Separate analyses for the
three diagnoses showed disordered thresholds in a major-
ity of the items. These were consequently rescored. All
item categories were reduced to three in all diagnoses. This
gave the new category 1 (old categories 1 and 2), new cat-
egory 2 (old categories 3+4+5), and new category 3 (old
categories 6 and 7). However this was not sufficient for
some items. For SCI, two items had to be dichotomised,
Grooming and Stairs, the latter was also dichotomised in
TBI. For stroke, Bladder management and Bowel manage-
ment had to be dichotomised. After rescoring, the items
for stroke and TBI fitted the model. It was found that items
Bladder management and Bowel management in SCI
showed misfit to model expectations. Only the SCI data
had a significant item-trait interaction. The person separa-
tion index was between 0.94 and 0.96 in the three diag-
noses.
Pooled data and cross-diagnostic DIF
Disordered thresholds were found in almost all items in
the pooled data. After rescoring the majority of the items
had three categories although Bladder management and
Stairs had to be dichotomised. The items Eating and
Bowel management showed individual misfit to the
model. The summary item-trait interaction statistic also
showed misfit. The person separation index was 0.95.
The data were then examined for cross-diagnostic DIF. All
items showed DIF, and Tukey's post hoc comparison of
these items revealed a complex pattern where 9 out of 13
items displayed DIF for SCI and 2 for TBI against the two
other diagnoses (table 2). This made it impossible to cre-
ate a solution by splitting items by diagnosis. Due to the
large amount of DIF shown in the SCI items, and the lack
of common items this diagnosis was then omitted from
the pooled data leaving TBI and stroke for further analysis.
After omitting the data from patients with SCI, thresholds
were again examined and collapsed where necessary. All
items were collapsed into three categories, except Bladder
Management and Stairs, which were dichotomised (see
table I). No individual items showed misfit to model but
a significant item-trait interaction remained, indicating
that the item hierarchy does not remain exactly the same
at different levels of the underlying trait. The person sepa-
ration index was 0.96.
DIF was still found for 6 items (Grooming, Dressing
upper body, Bowel management, Transfer tub, Walk/
Wheelchair and Stairs). These were split, forming unique
items for stroke and TBI and giving a new scale of 19
items. This new scale was then refitted to the Rasch model.
The items showed good fit at the individual level,
although again the overall item trait interaction showed
significant deviation from model expectations (χ
2
=
119.160, df = 57, p = 0.000003).
Person separation index 0.96.
This lack of fit indicates some multidimensionality in the
data, and thus the formal test of local independence
assumption (for a unidimensional scale) was not per-
formed.
Summed score comparison
For the analysis of the clinical meaning of the present DIF
an examination of the logit value of the summed score
was compared between the diagnoses (not splitting the
Health and Quality of Life Outcomes 2006, 4:55 />Page 5 of 8
(page number not for citation purposes)
Table 1: Number of working categories, misfitting items and location order of items in each diagnosis and in pooled data.
FIM™ items Pooled data SCI STROKE TBI Pooled data
STR + TBI
Number of
categories
Misfit Loc Number of
categories
Misfit Loc Number of
categories
Misfit Loc Number of
categories
Misfit Loc Number of
categories
Misfit Loc
Eating 3X13 13 33 23 2
Grooming 32233231035
Bathing 3 11 3 5 3 12 3 12 3 12
Dressing upper body 3534373 938
Dressing lower body 3123113113 11311
Toileting 3103123 83 83 9
Bladder 283X7253 627
Bowel 3X43X92 13 13 1
Transfer bed 3636343 433
Transfer Toilet 3738363 334
Transfer bath 393103103 7310
Walk/Wheelchair 3332393 536
Stairs 2132133132 13213
Loc = Location order Misfit = Misfitting items SCI = Spinal cord injury TBI = Traumatic Brain Injury STR=Stroke Pooled data=SCI+TBI+stroke
Health and Quality of Life Outcomes 2006, 4:55 />Page 6 of 8
(page number not for citation purposes)
items). All diagnoses were rescored in the same way for
usefulness in the clinical setting, giving three categories in
most items, although Grooming, Dressing lower body,
Toileting, Bowel and Stairs needed to be dichotomised.
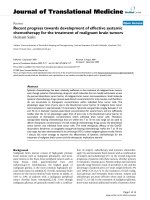
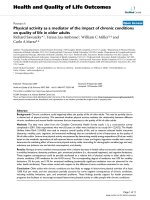
This analysis showed small visual differences between the
diagnoses as seen in Figure 1. An examination of the dif-
ferences in logits (table 3) showed no clinical relevance
according to the boundaries by Lai and Eton [29].
Discussion
In the present study it appears that the 7 category instru-
ment FIM™ t poses several measurement problems. It is
shown that a reduction of response categories within each
item might be appropriate. A majority of the motor items
of the Functional Independence Measure were shown to
have cross-diagnostic DIF, meaning that, for example, the
Eating item for patients with SCI does not have the same
meaning as for stroke or TBI patients. This can influence
comparisons between patients in rehabilitation settings.
However, appropriate comparison of summed scores with
correctly ordered categories seems to be possible as they
seem to reflect the same amount of the trait (independ-
ence) under investigation. The possibility of sum score
comparison could be explained by easier items for some
diagnoses possibly being harder for others and vice versa,
resulting in the items "balancing out" and the summed
level of dependence being the same. This is also one of the
purposes of generic instruments: by means of a sum,
which should be comparable, to reflect the trait under
investigation. Since rehabilitation clinics often have
patients with various conditions, it is important that the
measures used can be shown to be robust in this way.
In the present study SCI items could not form a construct
together with stroke and TBI since there was no linkage
item for a Rasch analysis with items split into diagnosis
specific items. Questions have been raised about the rele-
Summed scores after rescoring and their corresponding logit value in the three diagnoses and pooled dataFigure 1
Summed scores after rescoring and their corresponding logit
value in the three diagnoses and pooled data.
1 Pooled data
2 Spinal Cord Injury
3 Stroke
4 Traumatic Brain Injury
Table 2: Items showing significant DIF in pooled data and
between stroke and TBI
Pooled data Stroke and TBI pooled
Eating SCI
Grooming All X
Bathing SCI
Dressing upper body SCI X
Dressing lower body SCI
Toileting SCI
Bladder SCI
Bowel SCI X
Transfer bed SCI
Transfer toilet SCI X
Transfer bath TBI X
Walk/Wheelchair All X
Stairs TBI
Pooled data = Stroke + TBI + SCI
TBI = Traumatic Brain Injury
SCI = Spinal Cord Injury
All = All three diagnoses
X = DIF present
Table 3: Logit values for summed scores after rescoring
disordered thresholds
Sumscore Pooled data SCI Stroke TBI
0 -4,83 -5 -5,35 -4,64
1 -3,67 -4,07 -4,14 -3,73
2 -2,88 -3,35 -3,31 -3,06
3 -2,35 -2,8 -2,73 -2,58
4 -1,95 -2,32 -2,27 -2,19
5 -1,61 -1,89 -1,88 -1,85
6 -1,31 -1,5 -1,53 -1,54
7 -1,04 -1,13 -1,2 -1,26
8 -0,78 -0,79 -0,89 -0,99
9 -0,54 -0,48 -0,59 -0,72
10 -0,3 -0,19 -0,31 -0,46
11 -0,07 0,08 -0,03 -0,19
12 0,17 0,35 0,25 0,09
13 0,42 0,61 0,53 0,38
14 0,68 0,89 0,81 0,69
15 0,96 1,17 1,11 1,03
16 1,27 1,48 1,44 1,39
17 1,62 1,83 1,81 1,8
18 2,04 2,23 2,23 2,26
19 2,55 2,75 2,76 2,81
20 3,24 3,5 3,47 3,55
21 4,16 4,58 4,44 4,54
Pooled data = Stroke + TBI + SCI
TBI = Traumatic Brain Injury
SCI = Spinal Cord Injury
The RUMM 2020 program automatically assigns scores that begin with
0, giving in this case e.g. categories 0, 1, 2 that in RUMM are equivalent
to 1, 2, 3 in FIM™ categories. RUMM sum scores ranged from 0–21,
which is equivalent to 13–32 in FIM™ sum scores.
Health and Quality of Life Outcomes 2006, 4:55 />Page 7 of 8
(page number not for citation purposes)
vance of the FIM™ in SCI rehabilitation [31] and SCI has
previously been treated as a specific group by Wright and
co-workers [32]. A new instrument called the Spinal Cord
Independence Measure (SCIM) using the FIM™ as a plat-
form has been developed [33] where the authors state that
they have refined the items in FIM™ to be more suitable
for patients with SCI. Dallmeijer et al. [9] demonstrated
DIF in a recent study for seven of the eleven motor items
in FIM (Bladder and Bowel management excluded)
between patients with stroke, TBI and multiple sclerosis.
They used Rasch analysis with the Rating Scale Model
(RSM) and anchoring using the threshold measures of the
whole group.
The original FIM™ motor scale is not a true ordered cate-
gory scale and this means there are difficulties in compar-
ing raw sums. The comparison of summed scores done in
this study would not have been valid without collapsing
the categories. In order to create a scale that was as
homogenous as possible using the Partial Credit Model
(PCM) a three-category scale was used in the present study
for almost all items. However, a few items needed to be
dichotomised. Collapsing in this study improved the fit
for the diagnoses separately (not shown) and this could
imply that a proper order and number of categories might
be one way to improve the psychometric property of
FIM™.
There may be several reasons for the disordering of cate-
gories. Examples are not enough information in the man-
ual, poor definition of categories or training procedures.
Different solutions for handling this problem have been
suggested. Dallmeijer and co-workers [9] suggested a
three-category scale using the RSM. Previous studies of
FIM™ from the Pro-ESOR project have suggested a reduc-
tion of the scale into four categories for all items using the
Rating scale model [34] and as few as two categories for
some items using the Partial Credit Model [4,8,22].
Grimby and co-workers used the RSM [35] and suggested
a five-category scale. Claesson and Svensson [36] used the
rank-invariant statistical method and suggested a scale
reduced to four categories, as did also Heinemann and co-
workers using Rasch analysis RSM [37]. Thus, a reduction
of categories in FIM™ seems to be appropriate, especially
taking a modern psychometric approach.
In this study, Eating (pooled data), Bladder (SCI) and
Bowel (pooled data and SCI) management did not fit the
model despite the collapsing of the categories. Bladder
and Bowel management have shown misfit in several
studies (e.g. [38] and were referred to by Kucukdeveci and
co-workers as an inherent problem [39]. Dallmeijer and
co-workers analysed their data without Bladder and Bowel
management but also found misfit for Eating in their
study [9]. Thus there seems to be an inherent problem
with the dimensionality of the scale and this raises funda-
mental issues about the validity of the 13-item summed
score. In the current analysis the item-trait misfit indicated
multidimensionality and thus prevented us from doing
more formal tests of the local independence assumption.
An idea solution to the presence of DIF by diagnosis (and
country) is to allow for the variations that exists across
items by splitting items that show relevant DIF and creat-
ing an item bank for basic activities of daily living. In an
item bank, different subgroups – in this case diagnosis –
can have different items but still be compared on the
latent trait under investigation, given that there are some
common items (unbiased for DIF) to effect the linkage
[40,41].
In conclusion, this analysis of the cross-diagnostic validity
of the FIM™ shows that care must be taken when data
from different diagnoses are pooled. DIF is clearly a prob-
lem, but it may be possible to compare group data in a
generic instrument such as the FIM™. The continuing mis-
fit of some items in different diagnoses is a concern, as this
compromises the validity of the summed score. Thus,
when planning interventions (group or individual); when
evaluating rehabilitation programs, or comparing patient
achievements in individual items, cross-diagnostic DIF
must be taken into account.
Acknowledgements
This study was funded by the European Commission within its BIOMED 2
programme under contract BMH4-CT98-3642. It has also been supported
by grants from the Swedish Research Council (VR K2002-27-VX-14318-
01A) and Västra Götaland's Research Fund. We would like to express our
thanks to all participating partners that supplied FIM™ data. A list of par-
ticipants is available through the first author.
References
1. Streiner DL, Norman GR: Health measurement scales : a prac-
tical guide to their development and use. In Oxford medical pub-
lications 2nd edition. Oxford ; New York , Oxford University Press;
1995:viii, 231.
2. Haigh R, Tennant A, Biering-Sorensen F, Grimby G, Marincek C, Phil-
lips S, Ring H, Tesio L, Thonnard JL: The use of outcome meas-
ures in physical medicine and rehabilitation within Europe. J
Rehabil Med 2001, 33(6):273-278.
3. Beaton DE, Bombardier C, Guillemin F, Ferraz MB: Guidelines for
the process of cross-cultural adaptation of self-report meas-
ures. Spine 2000, 25(24):3186-3191.
4. Tennant A, Penta M, Tesio L, Grimby G, Thonnard JL, Slade A, Law-
ton G, Simone A, Carter J, Lundgren-Nilsson A, Tripolski M, Ring H,
Biering-Sorensen F, Marincek C, Burger H, Phillips S: Assessing and
adjusting for cross-cultural validity of impairment and activ-
ity limitation scales through differential item functioning
within the framework of the Rasch model: the PRO-ESOR
project. Med Care 2004, 42(1 Suppl):I37-48.
5. Hamilton B, Granger C, Sherwin FS, Zielezny M, Tashman JS: A Uni-
form National Data System for Medical Rehabilitation. In
Rehabilitation outcomes : analysis and measurement Edited by: Fuhrer MJ.
Baltimore , Brookes; 1987:137-147.
6. Deutsch A, Braun S, Granger C: The Functional Independence
Measure (FIMSM Instrument) and the Functional Independ-
ence Measure for Children (WeeFIMR ): ten years of devel-
opment. Crit Rev Phys Med Rehabil 1996, 8:267-281.
Publish with BioMed Central and every
scientist can read your work free of charge
"BioMed Central will be the most significant development for
disseminating the results of biomedical research in our lifetime."
Sir Paul Nurse, Cancer Research UK
Your research papers will be:
available free of charge to the entire biomedical community
peer reviewed and published immediately upon acceptance
cited in PubMed and archived on PubMed Central
yours — you keep the copyright
Submit your manuscript here:
/>BioMedcentral
Health and Quality of Life Outcomes 2006, 4:55 />Page 8 of 8
(page number not for citation purposes)
7. Cohen ME, Marino RJ: The tools of disability outcomes
research functional status measures. Arch Phys Med Rehabil
2000, 81(12 Suppl 2):S21-9.
8. Lundgren-Nilsson A, Grimby G, Ring H, Tesio L, Lawton G, Slade A,
Penta M, Tripolski M, Biering-Sorensen F, Carter J, Marincek C, Phil-
lips S, Simone A, Tennant A: Cross-cultural validity of Functional
Independence Measure items in stroke:A study using Rasch
analysis. J Rehabil Med 2005, 37(1):23-31.
9. Dallmeijer AJ, Dekker J, Roorda LD, Knol DL, van Baalen B, de Groot
V, Schepers VP, Lankhorst GJ: Differential item functioning of
the Functional Independence Measure in higher performing
neurological patients. J Rehabil Med 2005, 37(6):346-352.
10. Keith RA: Functional assessment measures in medical reha-
bilitation: current status. Arch Phys Med Rehabil 1984,
65(2):74-78.
11. Linacre JM, Heinemann AW, Wright BD, Granger CV, Hamilton BB:
The structure and stability of the Functional Independence
Measure [see comments]. Arch Phys Med Rehabil 1994,
75(2):127-132.
12. Rasch G: Probabilistic models for some intelligence and
attainment tests. Expanded edition. Chicago , University of Chi-
cago Press; 1980:xxiii, 199.
13. Masters GN: A Rasch model for parital credit scoring. Psycho-
metrica 1982, 47:149-174.
14. van Alphen A, Halfens R, Hasman A, Imbos T: Likert or Rasch?
Nothing is more applicable than good theory. J Adv Nurs 1994,
20(1):196-201.
15. Wright BD, Masters GN: Rating scale analysis. Chicago , Mesa
Press; 1982:xi, 206.
16. Bland JM, Altman DG: Multiple significance tests: the Bonfer-
roni method. Bmj 1995, 310(6973):170.
17. Fisher WP: Reilability statistics. Rasch Measurement Transactions
1992, 6(3):238.
18. Smith RM: Fit analysis in latent trait measurement models. J
Appl Meas 2000, 1(2):
199-218.
19. Dorans NJ, Holland PW: DIF detection and description: Mantel-
Haenszel and standardisation. In Differential item functioning : the-
ory and practice Edited by: Holland PW, Wainer H. Hillsdale , Law-
rence Erlbaum Associates; 1993:36-66.
20. Orlando M, Marshall GN: Differential item functioning in a
Spanish translation of the PTSD checklist: detection and
evaluation of impact. Psychol Assess 2002, 14(1):50-59.
21. Elhan AH, Kutlay S, Kucukdeveci AA, Cotuk C, Ozturk G, Tesio L,
Tennant A: Psychometric properties of the Mini-Mental State
Examination in patients with acquired brain injury in Turkey.
J Rehabil Med 2005, 37(5):306-311.
22. Lawton G, Lundgren-Nilsson A, Biering-Sorensen F, Tesio L, Slade A,
Penta M, Grimby G, Ring H, Tennant A: Cross-cultural validity of
FIM in spinal cord injury. Spinal Cord 2006.
23. Pallant JFTA: An introduction to the Rasch measurement
model: An example using the Hospital Anxiety and Depres-
sion Scale (HADS). British Journal of Clinical Psychology 2006.
24. Bond TG, Fox CM: Applying the Rasch model : fundamental
measurement in the human sciences. Mahwah, N.J. , L. Erlbaum;
2001:xxiv, 255.
25. Wright BD: Rack and Stack: Time 1 vs. Time 2. Rasch Measure-
ment Transactions 2003, 17(1):905-906.
26. Andrich D, Luo G: Conditional pairwise estimation in the
Rasch model for ordered response categories using principal
components. J Appl Meas 2003, 4(3):205-221.
27. Luo G, Andrich D: Estimating parameters in the Rasch model
in the presence of null categories. J Appl Meas 2005,
6(2):128-146.
28. van Buuren S, Eyres S, Tennant A, Hopman-Rock M: Assessing com-
parability of dressing disability in different countries by
response conversion. Eur J Public Health 2003, 13(3 Suppl):15-19.
29. Lai JS, Eton DT: Clinically Meaningful Gaps. Rasch Measurement
Transactions 2002, 14(4):850.
30. Andrich D, Lyne A, Sheridon B, Luo G: RUMM2020. Perth ; 2003.
31. Marino RJ, Huang M, Knight P, Herbison GJ, Ditunno JFJ, Segal M:
Assessing selfcare status in quadriplegia: comparison of the
quadriplegia index of function (QIF) and the functional inde-
pendence measure (FIM). Paraplegia 1993, 31(4):225-233.
32. Wright BD, Linacre JM, Smith RM, Heinemann AW, Granger CV: FIM
measurement properties and Rasch model details [letter;
comment]. Scand J Rehabil Med 1997, 29(4):267-272.
33. Catz A, Itzkovich M, Agranov E, Ring H, Tamir A: SCIM spinal cord
independence measure: a new disability scale for patients
with spinal cord lesions. Spinal Cord 1997, 35(12):850-856.
34. Nilsson AL, Sunnerhagen KS, Grimby G: Scoring alternatives for
FIM in neurological disorders applying Rasch analysis. Acta
Neurol Scand 2005, 111(4):264-273.
35. Grimby G, Andren E, Holmgren E, Wright B, Linacre JM, Sundh V:
Structure of a combination of Functional Independence
Measure and Instrumental Activity Measure items in com-
munity-living persons: a study of individuals with cerebral
palsy and spina bifida. Arch Phys Med Rehabil 1996,
77(11):1109-1114.
36. Claesson L, Svensson E: Measures of order consistency between
paired ordinal data: application to the Functional Independ-
ence Measure and Sunnaas index of ADL. J Rehabil Med 2001,
33(3):137-144.
37. Heinemann AW, Semik P, Bode RK: Redusing step disorder in
multidisciplinary FIM ratings.: 2001; Amsterdam, The Neth-
erlands Monduzzi Editore S.p.A Bolonga, Italy.; 2001.
38. Heinemann AW, Linacre JM, Wright BD, Hamilton BB, Granger C:
Relationships between impairment and physical disability as
measured by the functional independence measure. Arch Phys
Med Rehabil 1993, 74(6):566-573.
39. Kucukdeveci AA, Yavuzer G, Elhan AH, Sonel B, Tennant A: Adap-
tation of the Functional Independence Measure for use in
Turkey. Clin Rehabil 2001, 15(3):311-319.
40. Bode RK, Cella D, Lai JS, Heinemann AW: Developing an initial
physical function item bank from existing sources. J Appl Meas
2003, 4(2):124-136.
41. Bode RK, Lai JS, Cella D, Heinemann AW: Issues in the develop-
ment of an item bank. Arch Phys Med Rehabil 2003, 84(4 Suppl
2):
S52-60.