báo cáo hóa học:" Psychometric properties of the Brief Pain Inventory among patients with osteoarthritis undergoing total hip replacement surgery" doc
Bạn đang xem bản rút gọn của tài liệu. Xem và tải ngay bản đầy đủ của tài liệu tại đây (240.38 KB, 8 trang )
RESEARC H Open Access
Psychometric properties of the Brief Pain
Inventory among patients with osteoarthritis
undergoing total hip replacement surgery
Heidi Kapstad
1,2,3*
, Berit Rokne
2
, Knut Stavem
4,5,6
Abstract
Background: Pain is a cardinal symptom of osteoarthritis (OA) of the hip and important for deciding when to
operate. This study assessed the internal consistency reliability, validity and responsiveness of the Brief Pain
Inventory (BPI) among patients with OA undergoing total hip replacement (THR).
Methods: We prospectively included 250 of 356 patients who were accepted to the waiting list for primary THR
surgery. All participants responded to the BPI, WOMAC and SF-36 at baseline and 1 year after surgery.
Results: Internal consistency reliability (Cronbach’ s a) was >0.80 for the BPI, the WOMAC and five of the eight SF-
36 scales The pattern of associations of the two BPI scales with corresponding and non-corresponding scales of
the WOMAC and SF-36 largely supported the construct validity of the BPI. The responsiveness indices for change
from baseline to 1 year after THR ranged from 1.52 to 2.05 for the BPI scales, from 1.69 to 2.84 for the WOMAC
scales, and from 0.25 (general health) to 2.77 (bodily pain) for the SF-36 scales.
Conclusions: The BPI showed acceptable reliability, construct validity and responsiveness in patients with OA
undergoing THR. BPI is short and therefore is easy to use and score, though the instrume nt offers few advantages
over and duplicates scales of more comprehensive instruments, such as the WOMAC and SF-36.
Background
Primary total hip joint replacement (THR) is an effective
intervention for severe osteoarthritis (OA) of the hip
that relieves the patients’ pain, increases physical func-
tioning, and improves health related quality of life
(HRQoL). Previously, evaluation of surgery for OA of
the hip has typically been done with functional scoring
systems, such as the Harris Hip score [1-3].
During the last decade patient-reported outcomes,
such as HRQoL, have gained importance in the assess-
ment of outcome after surgery for OA of the hip [4-7].
The two most commonly used questionnaires to assess
the outcome of hip surgery are the generic Medical
Outcomes Short Form 36 Health Survey (SF-36) and the
more disease-specific Western Ontario and McMaster
Universities Osteoarthritis Index (WOMAC) [4-6,8-11].
Pain is a cardinal symptom of OA of the hip and is
probably the most important variable for deciding
whether to operate or not. Therefore, questionnaires
specifically developed for the assessment of pain can
potentially complement the WOMAC and the SF-36
among patients with OA, or possibly be mo re sensitive
to change. The Brief Pain Invento ry (BPI) is a self-admi-
nistered questionnaire developed to assess pain and the
impact of pain [12]. It was developed for use in cancer
pain, but has also been used in other chronic pain con-
ditions [13-18].
The reliability, validity and responsiveness of the BPI,
or a shortened version of it, after drug interventions,
have recently been reported in unspecifie d patients with
OA [15,16], but its psychometric properties have not
been documented in homogeneous samples of patients
with OA of the hip, or in surgical intervention for OA
of the hip. If the BPI is to be used in such a setting, it is
important to document the pro perties of the question-
naire. In the present study we wanted to assess the
* Correspondence:
1
Oslo University College, Faculty of Nursing Education, Oslo, Norway
Full list of author information is available at the end of the article
Kapstad et al. Health and Quality of Life Outcomes 2010, 8:148
/>© 2010 Kapstad et a l; licensee BioMed Central Ltd. This is an Open Access article distributed under the terms of the Creative Commons
Attribution License ( licenses/by/2.0), which permits unrestricted use, distri bution, and reproduction in
any medium, provided the origina l work i s properly ci ted.
psychometric properties of the BPI in patients with OA
of the hip undergoing THR.
Materials and methods
Subjects and study design
The study was a prospective multi-center study in six
hospitals in three Norwegian counties. We included
consecutive patients > 18 years old, who were accepted
to the waiting list for primary THR surgery and had
satisfactory proficiency of the Norwegian language to
respond to questionnaires. Between June 2003 and June
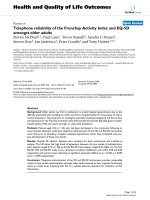
2004, 356 patients were invited, and 250 (7 0%) accepted
to participate and responded at baseline (Figure 1).
In each participating hospital a project contact in the
orthopedic unit identified patients fulfilling the inclusion
criteria. All participants responded to a package of ques-
tionnaires at (i) acceptance to the waiting list for surgery
(baseline), and (ii) 1 year after surgery. At baseline, we
mailed the questionnaire to the subje cts shortly after an
ambulatory visit.
Among the 250 baselin e respondents, we excl uded
those that had new joint replacement surgery (n = 4),
were not scheduled for surgery (n = 3), had severe com-
plication after surgery (n = 2), had another dominating
disease (n = 2), had died (n = 2) or chose another hospi-
tal for surgery (n = 1). The remaining 236 baseline
respondents received questionna ires 1 year after surgery,
of whom 203 responded to the questionnaire (80% of al l
baseline respondents). In the plan ning and establishing
of this study sample size was calculated. The study was
powered detect a change in HRQoL of 0.5 SD, with
power 0.9, a nd 5% significance level. In paired analysis,
thiswouldrequireasamplesizeofatleast43patients
for analysis. To account for possible loss to follow-up
and comparisons of changes in subgroups, we chose to
include about 250 patients.
The R egional Committee for Medical Research Ethics
and the Norwegian Social Science Data Services
approved the study.
Questionnaires
At baseline, patients completed a questionnaire that
comprised data on gender, age, marital status, cohabita-
tion, education level, employment status, type of sur-
gery, duration of pain in the joint, and number of years
with ambulation problems. In addition, patients com-
pleted the Brief Pain Inventory (BPI) [12], the WOMAC
[19,20], and the SF-36 [21-23] questionnaires.
The brief pain inventory
The BPI is a short, self-administ ered quest ionnaire with
11 items, which was designed to evaluate the intensity
of, and the impairment caused by, pain. Originally, the
BPI was developed to evaluate cancer pain, but it has
been shown to be a valid and reliable instrument for
chronic non-cancer pain [13,14,17]. All BPI items are
scored using ratin g scales. Four items measure pai n
intensity (pain now, average pain, worst p ain, and least
pain) using 0 ("no pain”) to 10 ("pain as bad as you can
imagine”) numeric rating scales, and seven items mea-
sure the level of interference with function caused by
pain (general activity, mood, walking ability, normal
work, relations with other persons, sleep, and enjoyment
of life) using 0 (no interference) to 10 (complete inter-
ference) rating scales.
The items are aggregated into two dimensions, (1)
Pain severity index, using the sum of the four items on
pain intensity, and (2) Function interference index,
using the sum of the seven pain interference items
[18,24,25]. Missing values were handled as recom-
mended by the developers of the BPI [26]. All four
severity items must been completed for aggregating a
pain severity index. The function interference index is
scored as the mean of the items scores multiplied by
seven, given that more than 50%, or four of seven, of
the items have been completed [26]. We used the No r-
wegian translation of the BPI, which has documented
reliability and validity [24].
The womac osteoarthritis index
The WOMAC is a validated and sensitive instrument
that can detect clinically important changes f ollowing a
variety of interventions for OA [19]. It is a three-dimen-
sional, disease-specific, and self-administered instrument
[19,20] that consists of 24 items that evaluate pain (five
items), stiffness (two items), and overall level of physical
356 patients with OA of the hip
were invited to participate
250 patients with OA of the hip
responded at baseline
106 refused to participate
203 patients responded 1 year
after surgery
1 selected a hospital outside the area
3 were not scheduled for surgery
246 had hip surgery in study
hospitals
43 patients were excluded:
2 died after surgery
2 had another dominating illness
2 had major complication after
surgery
4 had new joint replacement surgery
33 dropped out without any reason
Figure 1 Flow chart.
Kapstad et al. Health and Quality of Life Outcomes 2010, 8:148
/>Page 2 of 8
function (17 items). Items are rated using one of five
responses (0 = none, 1 = mild, 2 = moderate, 3 = severe,
4 = extreme). The item scores are aggregated to three
subscale scores, pain, stiffness, an d physical function,
which are calculated as the mean of the item scores in
each dimension. Finally, all subscales were recoded to 0-
10 scales to ease interpretation, where 10 represents
maximal problems and 0 no problems [27].
For this study, patients were asked to respond to each
item in relationship to the hip joint that was to be
replaced and to respond in relationship to the past 48
hours. We used the Norwegian Likert scale version 3.1
[28,29].
Medical outcomes study short form (SF-36)
The SF-36 questionnaire consists of 36 items that evalu-
ate eight concep tual domains of HRQoL: general health
(GH), physical functioning (PF), mental health (MH),
role limitations - physical (RP), role limitations- emo-
tional (RE), vitality ( VT), bodily pain (BP), and social
functioning (SF) [22]. The SF-36 is a widely used mea-
sure of HRQoL with documented validity and reliability
in various languages and populations [22,23]. This
instrument has previously been u sed in patients with
OA [4-6,8-10,30-33]. The Norwegian translation of the
standard SF-36 version 1.1 was used and scored on a 0-
100 scale, with higher scores indicating a better HRQoL
[34].
Statistical analysis
Descriptive statistics are presented using the mean (SD)
or numbers (percentages). Groups were compared using
the chi-square test, independent samples t-test, or Mann-
Whitney U test, where applicable. Internal consistency
reliability for the BPI, WOMAC and SF-36 scales at base-
line was assessed using Cronbach’s coefficient alpha [ 35].
A commonly accepted requirement for internal consis-
tency reliability is that it should be at least 0.70 [36]. A
floor effect occurs when a high pro portion of the respon-
dents grade themselves at the minimum score and a ceil-
ing effect when a high proportio n of the respondent s
score a t the maximum of the instrument. Because the
patients’ perceived pain and HRQoL scores were
expected to be ver y different befo re and aft er surgery, we
estimated the floor and ceiling effect for the BPI,
WOMAC and SF-36 at baseline and 1 year after surgery.
Such effects may limit changes in scores in one direction,
hence limiting an instrument to capture changes.
Construct validity of the BPI was assessed by Pearson’s
product-moment correlation coefficient between the BPI
scale scores and scores on the WOMAC and SF-36
scales, using the baseline data in this study. Before this
analysis, based on assessment of the content of the
items on the scales, we hypothesized that (1) the Bodily
pain (BP) scale of the SF-36 and the Pain scale of the
WOMAC would represent similar constructs as the
Pain severity index of th e BPI, and (2) the SF-36 BP, PF
and RP scales, and all three WOMAC scales would cor-
respond with the Function interference index of the BPI.
A finding of higher intercorrelations (r > 0.4) between
subscales assessing similar constructs , compared with
subscales assessing dissimilar constructs, would support
the construct validity of the BPI.
Responsiveness was e valuated by longitudinal assess-
ment of patients undergoing THR, investigating if the
instruments were sensitive to change following the
intervention. Responsiveness was further investigated in
categories of respondents, stratified according to the
response on an item on change in overall health during
the past year. We used item two on the SF-36 question-
naire as the rating of overall change: “ Compared to
1 year ago, how would you rate your health in general
now? (1 = much better, 2 = somewhat better, 3 = about
the same, 4 = somewhat worse, 5 = much worse)”.The
respondents were categorized as having a better (1 to 2),
unchanged (3) or worse (4 to 5) health status [36,37] . In
assessment of correlations between indices and respon-
siveness, we standardized the ana lysis by only inc luding
respondents that had valid scores on all scales of the
three questionnaires (n = 161).
To assess the magnitude of the responsiveness, we cal-
culated the effect size (ES), standardized response mean
(SRM), and Responsiveness Index (RI). ES= (mean 1
year after - mean at baseline)/SD baseline, SR M= (mean
1 year aft er - mean at baseline)/SD difference, and RI=
(mean 1 year after - mean at baseline)/SD of change
scores in patients with unchanged health status [36-38].
Data were analyzed using SPSS for Windows version
13.0 (SPSS Inc., Chicago, Ill.). We chose a 5% signifi-
cance level using two-sided tests.
Results
In total, 203 patients completed the study 1 year after
THR, 143 (70%) we re female. The patients completing
the study had a mean age of 69 years (SD 10), 67% were
married/cohabiting, and 61% were retired. The respon-
dents and non-respondents did not differ in baseline
characteristics, though the non-respondents tended to
be slightly older and more of them were retired than
the respondents (Table 1).
At baseline, internal consistency reliability, as assessed
with Cronbach’s a, was >0.80 for the BPI pain s everity
index and function interference index, the WOMAC
and the SF-36 subscales except the pain and stiffness
subscale on the WOMAC, the BP and GH scales o f the
SF-36 (0.79, 0.70, 0.68 and 0.69, respectively) (Table 2).
None of the BPI indices had marked floor or ceiling
effects at baseline, however, at 1 year after THR the BPI
Kapstad et al. Health and Quality of Life Outcomes 2010, 8:148
/>Page 3 of 8
pain severity index and function interference index
showed a floor effect, but none had signs of a ceiling
effect. On the WOMAC subscales at baseline, floor and
ceiling effects were minor. One year after THR, the
floor effect was larger on all three WOMAC subscales,
but most marked on the pain and stiffness subscales. At
baseline, floor and ceiling effects on the SF-36 subscales
were most marked on the RP and RE scales, and 1 year
after THR there was marked ceiling effects o n the SF
and RE scales (Table 2).
In total, 161 of the 203 patients had v alid dimension
scor es on all three questionnaires at baseline and 1 year
aft er THR. The correlations between the two BPI scales
and scales of the WOMAC and SF-36 partially sup-
ported our hypotheses (Table 3). Co rrelation of the BPI
pain severity index with the pain subscale on the
WOMAC and BP on the SF-36 were high, in line with
hypothesis (1). In addition the physical function scale on
theWOMACwashighlycorrelatedwiththeBPIpain
severi ty index (r = 0.57). Further the BPI function inter-
ference index scores and the subscales on the WOMAC
except stiffness were highly correlated in accordance
with hypothesis (2). The results indicated moderate to
high correlations of the BPI function interference index
with BP and PF scales, as hypothesized, but low correla -
tion with the RP scale. Further, the correlations of the
BPI function interference index with the VT, SF and
MH scales were moderate to high. The correlations
between hypothesized non-corresponding items were
lower (Table 3).
For the BPI, the responsiveness indices (ES, SRM and
RI) for change from baseline to 1 year after THR for the
total sample w ere large, w ith minimum values of 1.57
for the pain severity and 1.52 for the function interfer-
ence index (Table 4). Also on the WOMAC scales the
responsiveness indices on the three subscales were large,
minimum values ranging from 1.69 to 2.84.
On the e ight SF-36 scales the responsive ness indices
showed more variation. For the PF, RP and BP scales
the responsiveness indices were all above 0.94, for VT
and SF scales they ranged from 0.7 7 to 0.8 5, except for
the RI which was 1.10 for the VT. The remaining SF-36
scales, GH, RE and MH were less responsive, with
responsiveness indices from 0.24 to 0.52.
In analysis of responsiveness in groups stratified
according to the rating of overall health change: 133
reported better, 28 unchangedorworsenedoverall
health than 1 year before. Those that reported an
improvement in the rating of overall health change over
1 year had large values on all responsiveness indices on
the pain severity index and function interference index
of the BPI and all the subscales of the WOMAC and
the SF-36, except GH, RE and MH, with values >0.80.
All responsiveness indices for this group were larger
than for the groups with unchanged or worsened overall
health (Table 5).
For those with unchanged or worsened overall health
the responsiveness i ndices indicated an improvement in
pain and H RQoL, with large responses on the BPI pain
severity and fun ction interference indices, the three
WOMAC subscales, and for some of the SF-36 scales
most related to physical health (PF, RP and BP). For the
other SF-36 scales the effects were moderate (VT and
SF), small (RE) or unchange d (MH). For the GH scale,
the responsiveness indices changed in the opposite
direction, suggesting a slight deterioration.
Discussion
Inthepresentstudywehavedocumentedthepsycho-
metric properties of the BPI in patients with OA of the
hip, using standard methodology for assessing internal
Table 1 Patient characteristics at baseline for
respondents included in the analysis 1 year after hip
joint replacement surgery and those excluded after
baseline response, mean (SD) unless otherwise stated
Included Excluded p
N 203 47
Female sex, number (%) 143 (70) 35 (74) 0.58
Age, years 68.7 (9.9) 71.7 (8.4) 0.06
Marital status, number (%) 0.37
Married 135 (67) 31 (66)
Unmarried 11 (5) 0 (0)
Separated/divorced 24 (12) 6 (13)
Widowed 33 (16) 10 (21)
Employment, number (%) 0.07
Retired 123 (61) 35 (76)
Disability pension 25 (12) 4 (9)
Sick leave 17 (8) 5 (11)
Full or part time employed 38 (19) 2 (4)
Educational level, number (%) 0.19
Primary school 49 (25) 17 (37)
Secondary school 85 (42) 19 (41)
University < 4 years 39 (19) 4 (9)
University ≥4 years 28 (14) 6 (13)
Comorbidity, number (%) (N = 168) (N = 42)
Cardiovascular 33 (20) 9 (21) 0.47
Pulmonary 21 (13) 7 (17) 0.31
Diabetes 5 (3) 3 (7) 0.20
Cancer 21 (13) 6 (14) 0.46
Skin diseases 21 (13) 2 (5) 0.12
Gastrointestinal 26 (16) 5 (12) 0.38
Psychiatric 18 (11) 3 (7) 0.36
Other 28 (17) 5 (12) 0.31
Duration of pain prior to surgery, years 6.3 (6.7)
1
6.5 (6.1)
2
0.82
Waiting time, days
3
68.6 (54.3) 65.6 (58.8)
4
0.75
1
n = 181,
2
n = 42,
3
from baseline to surgery,
4
n=40
Kapstad et al. Health and Quality of Life Outcomes 2010, 8:148
/>Page 4 of 8
Table 2 Psychometric properties at baseline and 1 year after primary hip joint replacement
Baseline 1 year after surgery
Number of items N % Floor
5
%Ceiling
6
Cronbach’s a
7
N % Floor
5
%Ceiling
6
Cronbach’s
a
7
Brief Pain Inventory
Pain severity index
1
4 232 0 1 0.88 200 21 0 0.91
Function interference index
2
7 234 0.4 1.3 0.87 191 24 0 0.95
WOMAC
3
Pain 5 247 0.4 1.6 0.79 203 37 0 0.87
Stiffness 2 247 0.8 4.0 0.70 203 28 0 0.84
Physical function 17 248 0 0 0.93 202 9 0 0.96
SF-36 Scale
4
Physical functioning 10 248 4 0 0.82 201 1 4 0.92
Role-physical 4 247 82 4 0.84 197 37 34 0.89
Bodily pain 2 250 6 0 0.68 200 0.5 27 0.87
General health 5 240 0.8 3 0.69 196 0 7 0.81
Vitality 4 242 3 0 0.82 199 0 4 0.86
Social functioning 2 250 4 18 0.82 202 0.5 56 0.89
Role-emotional 3 242 42 40 0.91 198 23 60 0.89
Mental health 5 240 0 7 0.85 198 0 12 0.78
1
Range 0 - 40 (no pain, pain as bad you can image)
2
Range 0 - 70 (does not interfere, interferes completely)
3
Range 0 - 10 (no problem, maximum problem)
4
Range 0 - 100 (poor health status, maximal health status)
5
% scoring worst possible value
6
% scoring best possible value
7
Internal consistency reliability
Table 3 Pearson’s product-moment correlation coefficient
between the Brief Pain Inventory pain (BPI) severity
index and function interference index with subscales of
the WOMAC and the SF-36 questionnaires for patients
with OA of the hip at baseline (N = 161)
Pain Severity
Index
Function Interference
Index
WOMAC
Pain 0.66** 0.57**
Stiffness 0.26** 0.33**
Physical function 0.57** 0.63**
SF-36 Scale
Physical
functioning
-0.38** -0.51*’
Role-physical -0.22** -0.32**
Bodily pain -0.58** -0.65**
General health -0.27** -0.37**
Vitality -0.39** -0.57**
Social functioning -0.45** -0.63**
Role-emotional -0.19* -0.40**
Mental health -0.41** -0.67**
**correlation is significant at the 0.01 level
* correlation is significant at the 0.05 level
Hypothesized moderate to high correlations are boldfaced
Table 4 Responsiveness indices (Effect Size (ES),
Standardized Response Mean (SRM) and Responsiveness
Index (RI)), for change from baseline to 1 year after
primary hip joint replacement surgery (N = 161)
ES SRM RI
Brief Pain Inventory
Pain severity index
1
1.57 1.61 2.03
Function interference index
2
1.71 1.52 2.05
WOMAC
3
Pain -2.69 -2.52 -2.84
Stiffness -2.28 -1.75 -1.69
Physical function -2.61 -2.33 -2.35
SF-36 Scale
4
Physical functioning 2.17 1.54 1.85
Role-physical 1.46 0.95 0.94
Bodily pain 2.77 1.78 1.69
General health 0.24 0.25 0.29
Vitality 0.77 0.82 1.10
Social functioning 0.80 0.85 0.78
Role-emotional 0.49 0.50 0.36
Mental health 0.42 0.52 0.49
1
Range 0 - 40 (no pain, pain as bad you can image)
2
Range 0 - 70 (does not interfere, interferes completely)
4
Range 0 - 100 (poor health status, maximal health status)
Kapstad et al. Health and Quality of Life Outcomes 2010, 8:148
/>Page 5 of 8
consistency reliability, validity and responsiveness. The
BPI showed satisfactory internal consistency reliability
with Cronbach’s alpha >0.80 in assessment of pain and
the impact of pain [36]. The pattern of observed correla-
tions between subscales of the BPI measuring constructs
similar to the WOMAC and SF-36 questionnaires gen-
erally were in line with expectations, thereby supporting
the construct validity of the BPI scales in this setting.
Further, the study has shown that the BPI also was
responsive and detected change in pain and the impact
of pain from before to 1 year after THR in a homoge-
nous sample of patients with OA. The responsivene ss of
the BPI pain severity and function interference indices
were at the level of the three WOMAC subscales and
the PF, RP and BP scales of the SF-36, and in line with
previous studies using the WOMAC [11,39].
The internal consistency reliability for the BPI pain
severity and function interference indices was in line
with previous reports in patients with chronic non-
malignant pain [14], OA [16], or undergoing cardiac
surge ry [18]. The high Cronbach’s alpha in both dimen-
sions of the BPI suggests that both indices are suffi-
ciently unidimensional to permit scoring of the items as
two composites.
The pattern of associations between the two BPI
scales and corresponding and non-corresponding scales
of the WOMAC and SF-36 lar gely supported the con-
struct validity of the BPI. Our hypothesis was fairly
crude and based on the judgment of items and scales,
which cannot be expected to exactly capture all associa-
tions.Atthesametimeitsuggeststhatthereissome
overlap between the instruments, and that the BPI scales
to some extent duplicate the BP scale of the SF-36 and
the WOMAC pain subscale.
A previous study stated that 15% is a critical value for
floor and ceiling effects [ 40]. In the present study, BPI
subscale scores at baseline showed nearly no floor or
ceiling effects. One year after THR, there was floor
effects for both BPI subscales of 21% and 24%, respec-
tively, and no ceiling effects. These results can be
explained by the natural history of patients with OA
that undergo THR; the lowest possible score is zero for
a subject who refers to” no pain” for the pain severity
index and “does not interfere” for the function interfer-
ence index. For the WOMAC, the floor effect after THR
was very large for the subscales pain and stiffness. These
two subscales have fewer items than phy sical function.
For the SF-36, the RP and RE scales had excessive floor
and ceiling effects at baseline and 1 year after THR, and
also the BP and SF scales presented excessive ceiling
effects after THR, as in a previous study [11]. The large
floor and ceiling effects may be related to the low num-
ber of possible values on these scales, as the RE, RP, BP
and SF scales on the SF-36 have either few items or
each item is scored on a binary scale.
The responsiveness of a measure is commonly
appraised by comparing an observed change to another
independent criterion, such as patient-perceived
Table 5 Responsiveness indices (Effect Size (ES), Standardized Response Mean (SRM) and Responsiveness Index (RI)),
for change from baseline to 1 year after hip joint replacement surgery, according to perceived global change
Improved (n = 133) Unchanged or worsened (n = 28)
ES SRM RI ES SRM RI
Brief Pain Inventory
Pain severity index
1
1.70 1.71 2.17 1.00 1.36 1.39
Function interference index
2
1.80 1.56 2.16 1.27 1.40 1.56
WOMAC
3
Pain -2.98 -2.82 -3.01 -1.61 -1.84 -2.07
Stiffness -2.46 -1.90 -1.76 -1.56 -1.25 -1.33
Physical function -2.96 -2.75 -2.53 -1.35 -1.53 -1.50
SF-36 Scale
4
Physical functioning 2.36 1.68 2.01 1.35 1.53 1.50
Role-physical 1.50 1.02 1.01 1.26 1.19 1.10
Bodily pain 2.87 1.95 1.80 2.16 1.31 1.17
General health 0.37 0.40 0.43 -0.36 -0.41 -0.42
Vitality 0.85 0.88 1.19 0.46 0.58 0.66
Social functioning 0.93 0.97 0.84 0.40 0.50 0.46
Role-emotional 0.54 0.60 0.40 0.23 0.19 0.18
Mental health 0.51 0.69 0.59 0.01 0.01 0.01
1
Range 0 - 40 (no pain, pain as bad you can image)
2
Range 0 - 70 (does not interfere, interferes completely)
3
Range 0 - 10 (no problem, maximum problem)
4
Range 0 - 100 (poor health status, maximal health status)
Kapstad et al. Health and Quality of Life Outcomes 2010, 8:148
/>Page 6 of 8
transition of health change [37]. In the present study, we
used an item from the SF-36, which is not included in
scoring of the SF-36 scales, where we categorized the
respondents as having a better or unchanged/worse
health status based on responses to a five point Likert
scale. The stratified analysis according to rating of over-
all health change showed that the responsiveness indices
(ES, SRM and RI) were large for the subscales o n the
WOMAC and the BPI pain severity and function inter-
ference indices and largest on both q uestionnaires
among patients who reported i mproved health status. A
previous study about responsiveness for the WOMAC
and SF-36 after THR also reported good respon siven ess
on the WOMAC subscales and the physical domains on
the SF-36 [11].
The results in the unchanged/worsened group seemed
to b e in the opposite direction of what would be
expected, i.e. they suggested some improvement, but
less than in the improved group. Thi s may be caused by
the crudeness of the rating of overall health change, in
an intervention that for the majority of patients was
very effective. Alternatively, it may be caused by recall
bias, or other changes in health that were unrelated to
OA or THR in this sample of elderly people with con-
siderable comorbidity. Hence, the improvement with the
disease-specific questionnaires may capture positive
changes despite the patients’ perspective o f unchanged
or worsened change in overall health.
The responsiveness of the BPI has previously not been
reported among patients with OA undergoing THR.
However, responsiveness of the BPI has been assessed in
two previous studies: in patients undergoing cardiac sur-
gery and patients with OA in a clinical trial of con-
trolled- release oxycodone [16,18]. Both studies reported
moderate to large responsiveness indices, supporting the
responsiveness of the BPI.
Compared with the WOMAC and SF-36 the BPI is
short, easy to use and score. In the present study there
waslittledifferenceinmissing change scores on the
scales of th e different instruments. Previous studies have
shown that BPI is a feasible instrument for use among
patients with pain. Pain is a cardinal symptom among
patients with OA of the hip and an important indication
for undergoing THR, Therefore, a systematic evaluation
of self-reported pain and the impact of pain using the
BPI could be a complement to assessment by the physi-
cian [41]. Further, changes in pain can be q uantified in
a meaningful way using the BPI and enable comparison
of results between studies [41]. Because of its briefness,
the BPI can possibly also be valuable i n a daily diary
context.
Some limitations of our study should be mentioned.
We assessed construct validity by investigatin g the pat-
tern of associations between the different scales.
However, other forms of validit y could have been
assessed, such as known groups validity or criterion
vali dity, but we thought we had no feasible variables for
such analysis. We also did not assess the factor structure
of the BPI, which could have been done with confirma-
tory factor analysis. A two-factor structure of the BPI
has been reported in several previous studies
[13,18,25,42], and we think this would contribute little
to the paper. Responsiveness was in the present study
assessed with an item from the SF-36 questionnaire,
change in hea lth in general, as a marker of overall
health change. This was the best marker of overall
health outcome that was available. We considered using
responsiveness index which relates changes to an instru-
ment’s minimally important change. Because this is not
reported for the BPI, we were unable to present this sta-
tistic. Further, we did not ask patients separate ques-
tions about changes in their physical health, mental
health, pain or other components or symptoms and
therefore cannot determine what components of health
status were most important for the result. The sample
size in t he unchanged/worsened group was small, hence
reducing the power of the study.
The BPI showed acceptable internal consistency reli a-
bility, construct validity and responsiveness in assess-
ment of pain and impact of pain among patients with
OA undergoing THR. We conclude that the BPI is a
short instrument t hat can be used as an alternative or
complement to more established instruments in this
patient group, though the instrume nt offers few advan-
tages over, and duplicates scales of, more comprehensive
instruments, such as the WOMAC and SF-36.
Acknowledgements
This study was supported by the Norwegian Research Council. The authors
thank the administrative nurses and the hospitals for making this study
possible.
Author details
1
Oslo University College, Faculty of Nursing Education, Oslo, Norway.
2
Department of Public Health and Primary Health Care, University of Bergen,
Bergen, Norway.
3
Buskerud University College, Department of Health
Sciences, Drammen, Norway.
4
Department of Pulmonary Medicine, medical
Division, Akershus University Hospital, Lørenskog, Norway.
5
Helse-Øst Health
Services Research Centre, Lørenskog, Norway.
6
Faculty of Medicine,
University of Oslo, Oslo, Norway.
Authors’ contributions
All authors participated in planning and design of the study.
HK organised and supervised the data collection. HK and KS did the data
analysis, drafted and revised the manuscript. BR reviewed and commented
on the manuscript. All authors read and approved the final manuscript.
Competing interests
None of the authors have any personal or financial interest or relationship
with other people or organizations that could inappropriately influence the
work.
Received: 20 April 2010 Accepted: 9 December 2010
Published: 9 December 2010
Kapstad et al. Health and Quality of Life Outcomes 2010, 8:148
/>Page 7 of 8
References
1. Andersson G: Hip assessment: a comparison of nine different methods. J
Bone Joint Surg Br 1972, 54:621-625.
2. Harris WH: Traumatic arthritis of the hip after dislocation and acetabular
fractures: treatment by mold arthroplasty. An end-result study using a
new method of result evaluation. J Bone Joint Surg Am 1969, 51:737-755.
3. Soderman P, Malchau H: Is the Harris hip score system useful to study
the outcome of total hip replacement? Clin Orthop Relat Res 2001,
189-197.
4. Bachmeier CJ, March LM, Cross MJ, Lapsley HM, Tribe KL, Courtenay BG,
Brooks PM: A comparison of outcomes in osteoarthritis patients
undergoing total hip and knee replacement surgery. Osteoarthritis
Cartilage 2001, 9:137-146.
5. Fortin PR, Clarke AE, Joseph L, Liang MH, Tanzer M, Ferland D, et al:
Outcomes of total hip and knee replacement: preoperative functional
status predicts outcomes at six months after surgery. Arthritis Rheum
1999, 42:1722-1728.
6. Jones CA, Voaklander DC, Johnstone DW, Suarez-Almazor ME: Health
related quality of life outcomes after total hip and knee arthroplasties in
a community based population. J Rheumatol 2000, 27:1745-1752.
7. Mahomed NN, Liang MH, Cook EF, Daltroy LH, Fortin PR, Fossel AH, Katz JN:
The importance of patient expectations in predicting functional
outcomes after total joint arthroplasty. J Rheumatol 2002, 29:1273-1279.
8. Fortin PR, Penrod JR, Clarke AE, St Pierre Y, Joseph L, Belisle P, Liang MH,
Ferland D, Phillips CB, Mahomed N, Tanzer M, Sledge C, Fossel AH, Katz JN:
Timing of total joint replacement affects clinical outcomes among
patients with osteoarthritis of the hip or knee. Arthritis Rheum 2002,
46:3327-3330.
9. Mahon JL, Bourne RB, Rorabeck CH, Feeny DH, Stitt L, Webster-Bogaert S:
Health-related quality of life and mobility of patients awaiting elective
total hip arthroplasty: a prospective study. CMAJ 2002, 167:1115-1121.
10. Salaffi F, Carotti M, Grassi W: Health-related quality of life in patients with
hip or knee osteoarthritis: comparison of generic and disease-specific
instruments. Clin Rheumatol 2005, 24:29-37.
11. Quintana JM, Escobar A, Bilbao A, Arostegui I, Lafuente I, Vidaurreta I:
Responsiveness and clinically important differences for the WOMAC and
SF-36 after hip joint replacement. Osteoarthritis Cartilage 2005,
13:1076-1083.
12. Cleeland C: Pain assessment in cancer. In Effect of cancer on quality of life.
Edited by: Osoba D. Boca Raton: CRC Press; 1991:293-305.
13. Keller S, Bann CM, Dodd SL, Schein J, Mendoza TR, Cleeland CS: Validity of
the brief pain inventory for use in documenting the outcomes of
patients with noncancer pain. Clin J Pain 2004, 20:309-318.
14. Tan G, Jensen MP, Thornby JI, Shanti BF: Validation of the Brief Pain
Inventory for chronic nonmalignant pain. J Pain 2004, 5:133-137.
15. Mendoza T, Mayne T, Rublee D, Cleeland C: Reliability and validity of a
modified Brief Pain Inventory short form in patients with osteoarthritis.
Eur J Pain 2006,
10:353-361.
16. Williams VSL, Smith MY, Fehnel SE: The Validity and Utility of the BPI
Interference Measures for Evaluating the Impact of Osteoarthritic Pain. J
Pain Symptom Manage 2006, 31:48-57.
17. Tyler EJ, Jensen MP, Engel JM, Schwartz L: The reliability and validity of
pain interference measures in persons with cerebral palsy. Arch Phys Med
Rehabil 2002, 83:236-239.
18. Gjeilo KH, Stenseth R, Wahba A, Lydersen S, Klepstad P: Validation of the
Brief Pain Inventory in Patients Six Months After Cardiac Surgery. J Pain
Symptom Manage 2007, 34:648-656.
19. Bellamy N: WOMAC Osteoarthritis Index: user guide V Queensland, Australia;
2002.
20. Bellamy NB: Validation study of WOMAC: a health status instrument for
measuring clinically important patient relevant outcomes to
antirheumatic drug therapy in patients with osteoarthritis of the hip or
knee. J Rheumatol 1988, 15:1833-1840.
21. Hays RD, Sherbourne CD, Mazel RM: The RAND 36-Item Health Survey 1.0.
Health Econ 1993, 2:217-227.
22. Ware JE Jr, Sherbourne CD: The MOS 36-item short-form health survey
(SF-36). I. Conceptual framework and item selection. Med Care 1992,
30:473-483.
23. Ware JE, Snow KK, Kosinski M, Gandek B: SF-36 Health Survey Manual and
Interpretation Guide Boston, MA, USA: New England Medical Center, The
Health Institute; 1993.
24. Klepstad P, Loge JH, Borchgrevink PC, Mendoza TR, Cleeland CS, Kaasa S:
The Norwegian brief pain inventory questionnaire: translation and
validation in cancer pain patients. J Pain Symptom Manage 2002,
24:517-525.
25. Radbruch L, Loick G, Kiencke P, Lindena G, Sabatowski R, Grond S, et al:
Validation of the German Version of the Brief Pain Inventory. J Pain
Symptom Manage 1999, 18:180-187.
26. Cleeland Charles S: The Brief Pain Inventory. User Guide Houston, Texas; 2009.
27. Kirschner S, Walther M, Bohm D, Matzer M, Heesen T, Faller H, Konig A:
German short musculoskeletal function assessment questionnaire
(SMFA-D): comparison with the SF-36 and WOMAC in a prospective
evaluation in patients with primary osteoarthritis undergoing total knee
arthroplasty. Rheumatol Int 2003, 23:15-20.
28. Kapstad H, Rustoen T, Hanestad BR, Moum T, Langeland N, Stavem K:
Changes in pain, stiffness and physical function in patients with
osteoarthritis waiting for hip or knee joint replacement surgery.
Osteoarthritis Cartilage 2007, 15:837-843.
29. Slatkowsky-Christensen B, Kvien TK, Bellamy N: Performance of the
Norwegian version of AUSCAN - a disease-specific measure of hand
osteoarthritis. Osteoarthritis Cartilage 2005, 13:561-567.
30. Kelly KD, Voaklander DC, Johnston DW, Newman SC, Suarez-Almazor ME:
Change in pain and function while waiting for major joint arthroplasty. J
Arthroplasty 2001, 16:351-359.
31. Kiebzak GM, Campbell M, Mauerhan DR:
The SF-36 general health status
survey documents the burden of osteoarthritis and the benefits of total
joint arthroplasty: but why should we use it? Am J Manag Care 2002,
8:463-474.
32. Ostendorf M, Buskens E, van Stel H, Schrijvers A, Marting L, Dhert W,
Verbout A: Waiting for total hip arthroplasty: avoidable loss in quality
time and preventable deterioration. J Arthroplasty 2004, 19:302-309.
33. Zelman DC, Hoffman DL, Seifeldin R, Dukes EM: Development of a metric
for a day of manageable pain control: derivation of pain severity cut-
points for low back pain and osteoarthritis. Pain 2003, 106:35-42.
34. Loge JH, Kaasa S, Hjermstad MJ, Kvien TK: Translation and performance of
the Norwegian SF-36 Health Survey in patients with rheumatoid
arthritis. I. Data quality, scaling assumptions, reliability, and construct
validity. J Clin Epidemiol 1998, 51:1069-1076.
35. Cronbach LJ: Coefficient alpha and the internal structure of tests.
Psychometrika 1951, 16:297-334.
36. Fayers PM, Machin D: Quality of life: the assessment, analysis and
interpretation of patient-reported outcomes. second edition. Chichester, UK:
John Wiley; 2007.
37. Wyrwich KW, Bullinger M, Aaronson N, Hays RD, Patrick DL, Symonds T:
Estimating clinically significant differences in quality of life outcomes.
Qual Life Res 2005, 14:285-295.
38. Revicki D, Hays RD, Cella D, Sloan J: Recommended methods for
determining responsiveness and minimally important differences for
patient-reported outcomes. J Clin Epidemiol 2008, 61:102-109.
39. SooHoo NF, Vyas RM, Samimi DB, Molina R, Lieberman JR: Comparison of
the Responsiveness of the SF-36 and WOMAC in Patients Undergoing
Total Hip Arthroplasty. J Arthroplasty 2007, 22:1168-1173.
40. McHorney CA, Tarlov AR: Individual-patient monitoring in clinical practice:
are available health status surveys adequate? Qual Life Res 1995,
4:293-307.
41. Beaton DE, Bombardier C, Katz JN, Wright JG: A taxonomy for
responsiveness. J Clin Epidemiol 2001, 54:1204-1217.
42. Tan G, Jensen MP, Thornby JI, Shanti BF: Validation of the Brief Pain
Inventory for chronic nonmalignant pain. J Pain 2004, 5:133-137.
doi:10.1186/1477-7525-8-148
Cite this article as: Kapstad et al.: Psychometric properties of the Brief
Pain Inventory among patients with osteoarthritis undergoing total hip
replacement surgery. Health and Quality of Life Outcomes 2010 8:148.
Kapstad et al. Health and Quality of Life Outcomes 2010, 8:148
/>Page 8 of 8