báo cáo hóa học: " Quality of life in Croatian Homeland war (19911995) veterans who suffer from post-traumatic stress disorder and chronic pain" doc
Bạn đang xem bản rút gọn của tài liệu. Xem và tải ngay bản đầy đủ của tài liệu tại đây (320.67 KB, 8 trang )
RESEARCH Open Access
Quality of life in Croatian Homeland war (1991-
1995) veterans who suffer from post-traumatic
stress disorder and chronic pain
Marijana Braš
1*
, Vibor Milunović
2
, Maja Boban
3
, Lovorka Brajković
1
, Vanesa Benković
4
, Veljko Đorđević
1
and
Ozren Polašek
5
Abstract
Background: The aim of this study was to investigate the quality of life in Croatian homeland war veterans who
suffer from post-traumatic stress disorder and chronic low back pain (LBP).
Methods: A total of 369 participants were included, classified in four study groups: those with post-traumatic stress
disorder (PTSD; N = 59), those with both PTSD and lower back pain (PTSD+LBP; N = 80), those with isolated LBP
(N = 95) and controls (N = 135). WHOQOL-BREF survey was used in the estimation of quality of life. The data were
analysed using statistical methods and hierarchical clustering.
Results: The results indicated a general pattern of lowering quality of life in participants with both psychological
(PTSD) and physical (LBP) burden. The average overall quality of life was 2.82 ± 1.14 for the PTSD+LBP group, 3.29 ±
1.28 for the PTSD group, 4.04 ± 1.25 for the LBP group and 4.48 ± 0.80 for the controls (notably, all the pair-wise
comparisons were significantly different at the level of P < 0.001, except for the pair LBP-controls, which was
insignificant). This result indicated that quality of life was reduced for 9.9% in patients with LBP, 26.6% in patients
with PTSD and 37.1% in PTSD+LBP, suggesting strong synergistic effect of PTSD and LBP. The analysis also identified
several clusters of participants with different pattern of quality of life related outcomes, reflecting the complex nature
of this indicator.
Conclusions: The results of this study reiterate strong impact of PTSD on quality of life, which is additionally
reduced if the patient also suffers from LBP. PTSD remains a substantial problem in Croatia, nearly two decades
after the beginning of the 1991-1996 Homeland war.
Background
Posttraumatic stress disorder (PTSD) is an extreme
response to a traumatic event cha racterize d with persis-
tent re-experiencing of the trauma through recurrent and
intrusive recollectio ns or dreams, persistent avoidance of
stimuli associated with the trauma, numbing of general
responsiveness and persistent symptoms of increased
arousal [1]. The net result of all these changes includes a
wide range of dysfun ctions and personal maladjustments
[2-4], as well as a reduction of the overall quality of life
[5]. PTSD most frequently occurs among combat
veterans who experienced wartime-related psychological
traumas [6-8].
However, it seems that a simple exposu re to a stress-
ful event is not crucial for the disease development,
although the amount of stress is proportional to the
chances of developing the disease. A study on Vie tnam
war veterans has shown that 26% of those involved in
severe combat have develope d PTSD, 17% of those
involved in moderate-level combat and only 7% of those
who were not di rectly involved in combat have devel-
oped PTSD [9]. Studies on Croatian Homeland war
veterans have shown that 16% of veterans suffered from
fully developed PTSD and 26% of them had sub-cl inical
manifestations [10].
* Correspondence:
1
Centre for Palliative Medicine, Medical Ethics and Communication Skills,
Medical School, University of Zagreb, Zagreb, Croatia
Full list of author information is available at the end of the article
Braš et al. Health and Quality of Life Outcomes 2011, 9:56
/>© 2011 Braš et al; licensee BioMed Central Ltd. This is an Open Access article distributed under the terms of the Creative Commons
Attribution License ( which permits unrestricted use, distribution, and reproduction in
any medium, provided the original work is properly cited.
Despite numerous treatment approaches and schemes,
subsets of PT SD patients develo p a chronic unremitting
disorder disease with a lifelong course [11]. One of the
main disadva ntages of this disease is related to the exis-
tence of chronic pain, which may be affecting as much
as 80% of the PTSD population [12,13]. Chronic pain
can also be considered to be a stressor that exceeds rou-
tine coping capacities, which in turn may lead to disabil-
ity and reducti on in the overall quality of life [14-17]. A
number of studies have investigated the negative effects
of chronic pain or PTSD on the quality of life so far
[18-24], but studies that investigated the relationship of
chronic pain in combat-induced PTSD and quality of
life based on the standardized survey approach in a
veteran population are scarce.
Therefore, the aim of this study was to investigate the
differences in quality of life within four groups of partici-
pants: war veterans with established PTSD, war veterans
with both PTSD and lower-back chronic pain, war veter-
ans who only suffered from lower-back pain without
PTSD and lastly controls, wh o were wit hout any of these
conditions.
Methods
Participants
A total of 536 participants were initially contacted in this
study. They were selected to represent a population of
Croatian Homeland war veterans, aged 35-54 years, who
were exposed to direct combat conditions for at least
three consecutive months. The participants were
included in the present study by the means of consecu-
tive enrolment at the Clinic for Psychological Medicine,
Clinical Hospital Centre in Zagreb and Clinic for psy-
chiatry, Clinical Hospital Centre in Osijek in the period
of 2008-2009. The sample was additionally supplemented
with smaller number (N = 40) of participants who were
involved through the means o f direct contact with some
of the veterans’ nongovernmental organizations, repre-
senting groups o f veteran population th at maintain co n-
tacts and share their issues. The sample structure was
thus aiming at provision of the wide range of PTSD suf-
ferers, in order to provide a good mix of those with mild
and those with more severe clinical manifestations of the
disease. We aimed to create four study groups of
approximately same size of 100 participants:
1. war vet erans suffering from chronic PTSD and
lower-back pain (LBP)
2. war veterans suffering from chronic PTSD only
3. war veterans suffering from chronic LBP only
4. war veterans who were at the time of study showing
none of these disorders (healthy controls)
In order to classify the participants into these four
groups, we undertook a number of diagnostic proce-
dures. Firstly, all participants were interviewed by an
experienced psychiatrist at the Clinic for Psychological
Medicine, University Hospital Centre, Zagreb to assess
the presence o f PTSD according to DSM-IV-TR criter-
ion. The diagnoses were established at different times
during or after the war and were re-evaluated in regular
prior to this study. Final evaluation of PTSD diagnosis
was made at the time of the study. Participants with
positive anamnesis of head and spinal injury, acute psy-
chosis, alcohol or illegal substance abuse or those who
were diagnosed with any form of the psycho-organic
syndrome were excluded from the study. After establish-
ing a PTSD status, we proceeded to classify them
according to the lower-back pain status. Init ial criterion
was the presence of LBP with a minimal duration of 12
months. Participants who reported suffering from LBP
were then directed to a specialist surgeon at the Clinic
for Traumatology, Zagreb for further clinical and radio-
graphic testing by means of magnetic resonance ima-
ging. In order to exclude participants with herniation
and sciatica or detectable organic causes that were not
in line with the patient’sage,weusedmagneticreso-
nanceimagingbya1.5TMagnetonSymphony(Sie-
men s Medical System). T1 weighted scans were used to
assess anatomic relations and T2 weighted scans were
used to assess pathologic change of signal. Repetition
time totaled 510-810 ms; echo time 14-17 ms. The slice
thickness was 2-3 mm. Field of view was 120-180 mm
with matrix of 512 × 256. In order to suppress possible
bias, radiologists wereunawareofthepatient’scondi-
tions and were asked to report the presenc e of lumbar
disc degener ation, protrusion, herniation and spinal ste-
nosis. By doing this, we were able to classify all partici-
pants into positive or negative PTSD and LBP group.
Participants who had no indication of PT SD nor
reported LBP were considered to be healthy controls.
Overall response rate was 81 %, i.e. participants com-
pleting all diagnostic procedures,with65ofparticipants
being excluded according to the exclusion criteria listed
above. The final sample for this study consisted of a total
number of 369 participants, assigned to the four study
groups: 80 participants who were considered to have
both PTSD and LBP, 59 of those who had isolated PTSD,
95 with LBP and 135 controls. Each participant signed an
informed consent and the study was conducted by ethical
principles set by WMA Declaration of Helsinki. The
study was approved by the Ethical Board of the Clinic for
Traumatology in Zagreb.
Questionnaires
A general questionnaire was developed to assess basic
demographics, LBP status and psychiatric data. Items
assessing LBP included var ious risk factors such as
weight, height, body mass index, vocational activity, var-
ious LBP descriptors such as duration of symptoms,
Braš et al. Health and Quality of Life Outcomes 2011, 9:56
/>Page 2 of 8
intensity and potential use of analgesic medications.
Items analyzing PTSD included duration PTSD, onset of
symptoms, other co-morbid psychiatric disorders, psy-
chotropic medication, war exposure, short description of
traumatic events.
All participants were also given World Health Organiza-
tion Quality Of Life-BREF questionnaire (WHOQOL-
BREF)[18], including set of general questions, regarding
age, sex, socio-economic status, other co-morbid psychia-
tric disorders and physical disorders. The W HOQOL-
BREF assessment is a self-reported questionnaire that con-
tains 26 items, and each item represents 1 facet. The facets
are defined as those aspects of life that are considered to
have contributed t o a person’ s QOL. Among those 26
items, 24 of them make up the 4 dimensions of physical
health (7 items), psychological health (6 items), social rela-
tionships (3 items), and environment (8 items), whereas
the other 2 items measure overall QOL and general health.
Respondents rated the intensity, frequency, or evaluation
of the selected attributes of QOL d uring the previous 2
weeks on a 5-point Likert-response scale.
Statistical analysis
For statistical analysis, the WHOQOL-BREF assessment
was first summarized to a 4-dimension construct (physical
health, psychologic health, social relationships, environ-
ment) according to the guidelines for the WHOQOL-
BREF. All dimension scores were calculated by taking the
mean score for all items included in each dimension and
multiplying by a factor of 4, where higher score indicating
better QOL. The data were analysed using variance analy-
sis, wit h either LSD or Dunnet T3 used as post-hoc tests
(depending on the sample variance homogeneity, which
was estimated using Levene’s test). Fisher’s exact test was
used for categorical data analysis, due to small number of
participants in some contingency tables.
In order to show the overall pattern of quality of life
across study groups, we used a comprehensive approach
involving hierarchical clustering and factor analysis. Firstly,
we performed a hierarchical clustering which included all
26 questions from the WHOQOL-BREF questionnaire.
The method was based on squared Euclidian distance.
The number of clusters was defined in an ascending order,
ranging from 4 to 10, in order to find the most informative
cluster. After the clustering was complete d, we recorded
the predicted clustering group membership and compared
it to the original st udy groups. Additionally, in order to
show how these clusters were made, we reported mean
value and standard deviations for the first questionnaire
question for each predicted cluster group. We also per-
formed a factor analysis of the same set of questions in
order to obtain dimensionality reduction. Three dimen-
sions were extracted using varimax rotation, which
explained 63.7% of entire variance. Lastly, we made
multinomial logistic r egression models, which were pre-
dicting the differences between the three analysed groups
and controls. Statistical analysis was performed using the
SPSS, version 16.0, with significance set at P < 0.05.
Results
A total of 369 participants were included in this study, fall-
ing into four study groups (Table 1). The initial analysis
suggested that these four groups were different in most
basic characteristics, including age, employment and mari-
tal status, amount of smoking and self-reported physical
activity, while we did not detect a significant difference in
the educational structure of sub-samples (Table 1).
The analysis of the dimensions of quality of life survey
in the four inv estigated groups indicated the presence of
strong differences in the four distinctive WHOQOL-
BREF dimensions, except for the difference in PTSD vs.
PTSD and LBP group (Table 2).
We also did not detect a significant difference in com-
parison of PTSD vs. LBP for environmental dimension
(Table 2). Furthermore, when the question on the overall
qua lity of life was analysed, the results indicated that the
group of patients who had PTSD and L BP had muc h
wors e quality of life than those with PTSD only, suggest-
ing a synergist ic effect of physical disorder in the form of
LBP and psychological disr uption in the form of PTSD
(Table 2). It should also be noted that we did not detect a
significant difference in this question between controls
and patients with LBP only (Table 2).
In order to examine the quality of life among the partici-
pants from four study groups, we also performed a hier-
archi cal clustering analysis, aiming to show the distances
among all included participants. The comparison of the
original study group membership with the cluster-based
predicted membership i ndicated interesting patt ern of
cross-correlations between th ese two variables (Table 3).
Two large clusters were obtained, two small and four clus-
ters with either one or two participants in them. Compari-
son of these clusters indicated that the sec ond predicted
cluster had the highest mean quality of life, with predomi-
nant membership from controls; predicted cluster number
1 had worse mean quality of life and was predominantly
receiving membership from the PTSD+LBP and PTSD
group, while cluster number 3 had most contribution
from the PTSD+LBP group and had the lowest mean
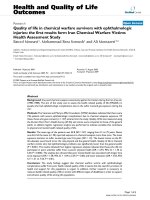
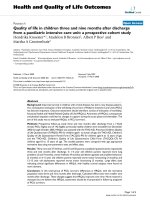
quality of life (Figure 1). The multivariate analysis repeated
most of the results from the previous analytic steps,
including differences in some of the basic descriptive char-
acteristis, but also extending across dimensions of the
quality of life (Table 4). A general pattern indicated the
greatest deviation from the controls in terms of worse out-
comes in the overall quality of life and some dimensions in
PTSD+LBP group, while isolated LBP group seemed to
differ the least strongly from control group (Table 4).
Braš et al. Health and Quality of Life Outcomes 2011, 9:56
/>Page 3 of 8
Discussion
The results of this study show a general pattern of
diminishing quality of life with the increasing psychical
and physical burden in an individual. The control group
of health participants had the best indices of quality of
life, which seemed to be the least affecte d by the pre-
sence of physical pain only (LBP); quality of life dimin-
ished more in the presence of psychological disruption
(PTSD), while it diminished even more in some dimen-
sions in patients who suffered from both psychical and
physical problems (PTSD and LBP). However, it should
also be noted that we did not detect significant differ-
ence between patients who had isolated PTSD from
those who had PTSD and LBP in all four dimensions of
quality of life estimation, thus suggesting the fine inter-
play and sometimes unclear boundary between these
two groups of patients. This type of synergistic action of
different stressors was described before, suggesting a
complex interplay of factors that affect the quality of life
in patients with PTSD [25].
Worsening of the quality of life in patients suffering
from PTSD has been reported in previous studies in the
comparable effect size [26-28]. Even the results from the
previous study on Croatian veterans indicated similar
result, which was especially strongly expressed in the
social dimension, showing that the effect of emotional
numbing could have devastat ing consequences for these
patients [29]. The results of this study confirmed such
result, with the social dimension being the most strongly
affected among four principal WHOQOL-BREF dimen-
sions (Table 2). This result fits in well with the results
from a la rge meta-analysis which indicated that in ade-
quate social support after the traumatic event may act
as a moderate predictor for the occurrence of PTSD
[30]. Impaired quality o f life in patients with PTSD was
also confirmed in situations when PTSD originated from
reasons other than war, show ing similar effect size and
pattern of changes [31-33]. The consistency of these
results indicates that regardless on the mechanism t hat
led to the PTSD diagnosis, the reduction of the quality
of life was evident in these patients. The results of this
study extend the previous ones, in a sense that they are
showingevenfurtherreductioninsituationswhena
physical component is present, suggesting a multi-
dimensional nature of the determinants of quality of life
in these patients.
The use of more advance d statistical analytic methods
indicated the existence of several cluster of quality of
life, suggesting a presence of several patterns. Majority
of those who reported better quality of life were from
the control group and LBP group, while majority of
those who reported worse QOL were from the PTSD
Table 1 Basic comparison of the four investigated groups
PTSD + LBP
(N = 80)
PTSD
(N = 59)
LBP
(N = 95)
Controls
(N = 135)
P
Age; mean ± standard
deviation
45.20 ± 5.05 43.32 ± 5.45 48.60 ±
4.98
41.78 ± 5.40 < 0.001
Education; n (%) Primary school 10 (14.5) 4 (12.1) 10 (14.9) 12 (12.9) 0.499
Secondary school 49 (71.0) 25 (75.8) 39 (56.7) 65 (69.9)
College degree 7 (10.1) 2 (6.1) 9 (13.4) 7 (7.5)
University degree 3 (4.3) 2 (6.1) 10 (14.9) 9 (9.7)
Employment status; n (%) Employed 14 (20.6) 5 (12.5) 48 (51.10) 98 (73.7) < 0.001
Pensioned 46 (67.6) 33 (82.5) 35 (37.2) 7 (5.30)
Unemployed 8 (11.8) 2 (5.0) 11 (11.7) 28 (21.1)
Marital status; n (%) Married 56 (80.0) 30 (73.2) 75 (79.8) 67 (50.8) < 0.001
Single 6 (8.6) 6 (14.6) 9 (9.6) 61 (46.2)
Living together with a partner 3 (4.3) 2 (4.9) 4 (4.3) 2 (1.5)
Divorced 4 (5.7) 3 (7.3) 3 (3.2) 1 (0.8)
Widoved 1 (1.4) 0 (0) 3 (3.21) 1 (0.8)
Smoking; n (%) Don’t smoke 43 (61.4) 21 (52.5) 69 (73.4) 84 (62.7) 0.015
Smoke, less than 20 cigarettes per
day
11 (15.7) 10 (25.0) 13 (13.8) 37 (27.6)
Smoke, more than 20 cigarettes
per day
16 (22.9) 9 (22.5) 12 (12.8) 13 (9.7)
Self-reported physical activity;
n (%)
No physical activity 21 (29.4) 7 (17.9) 18 (19.8) 11 (9.2) < 0.001
Occasionally 35 (51.5) 18 (46.2) 44 (48.4) 45 (37.5)
Once a week 2 (2.9) 5 (12.8) 15 (16.5) 23 (19.23)
Daily 11 (16.2) 9 (23.11) 14 (15.4) 41 (34.2)
Braš et al. Health and Quality of Life Outcomes 2011, 9:56
/>Page 4 of 8
and PTSD with LBP group. Nevertheless, there were
some exceptions, suggesting that the measurement and
estimation of QOL and its association with these diag-
noses not as clear as one might suggest. This, coupled
with the presence of several distinctive clusters made up
of several individuals suggests that there might be other
mechanisms that determine or modulate this associa-
tion, and that the diagnosis is just one part of the QOL
Table 2 The comparison of quality of life among study groups using analysis of variance and post-hoc tests
QOL dimension/status Groups N Mean ± SD F; P Post-hoc differences*
Physical PTSD + LBP (I) 79 75.44 ± 11.33
PTSD (II) 56 78.43 ± 11.54 49.18; I-III, I-IV, II-III,
LBP (III) 84 87.43 ± 13.84 < 0.001 II-IV, III-IV
Controls (IV) 134 94.42 ± 11.65
Total 353 85.97 ± 14.40
Psychological PTSD + LBP (I) 76 63.74 ± 14.60
PTSD (II) 58 67.45 ± 15.92 79.05; I-III, I-IV, II-III,
LBP (III) 90 80.27 ± 14.59 < 0.001 II-IV, III-IV
Controls (IV) 132 90.67 ± 10.76
Total 356 78.51 ± 17.44
Social PTSD + LBP (I) 80 33.40 ± 8.89
PTSD (II) 58 35.93 ± 9.98 70.19; I-III, I-IV, II-III,
LBP (III) 91 41.58 ± 8.78 < 0.001 II-IV, III-IV
Controls (IV) 134 49.22 ± 7.13
Total 363 41.70 ± 10.6
Enviromental PTSD + LBP (I) 79 92.81 ± 20.78
PTSD (II) 58 100.76 ± 19.79 66.27; I-III, I-IV, II-IV,
LBP (III) 88 108.36 ± 17.71 < 0.001 III-IV
Controls (IV) 130 126.06 ± 14.27
Total 355 110.14 ± 22.02
Satisfaction with personal health status PTSD + LBP (I) 80 1.84 ± 0.74
PTSD (II) 59 2.36 ± 0.85 127.48; I-II, I-III, I-IV, II-IV,
LBP (III) 95 2.70 ± 0.98 < 0.001 III-IV
Controls (IV) 135 4.03 ± 0.85
Total 369 2.94 ± 1.23
Overall self-reported quality of life PTSD + LBP (I) 73 2.82 ± 1.14
PTSD (II) 49 3.29 ± 1.28 24.04; I-II, I-III, I-IV, II-III,
LBP (III) 75 4.04 ± 1.25 < 0.001 II-IV
Controls (IV) 42 4.48 ± 0.80
Total 239 3.59 ± 1.31
*Group-by-group comparisons that were significant at the level of P < 0.001 performed using LSD (homogenous variance; used for physical and overall quality of
life) or Dunnet T3 (unhomogenous variance; all other questions). The significance was set at P < 0.001 in post-hoc test in order to reduce the increased chances
of false positive results.
Table 3 Cross-correlation of the study groups with predicted cluster membership based on the hierarchical clustering;
summary statistics is presented for clusters of equal or greater size than five participants
Predicted cluster number Study group Total Mean ± SD, QOL1 Cluster distribution P*
PTSD+LBP PTSD LBP Controls
1 62 (77.5) 46 (78.0) 56 (58.9) 17 (12.6) 181 2.93 ± 0.80 < 0.001
2 1 (1.3) 6 (10.2) 37 (38.9) 115 (85.2) 159 4.11 ± 0.61 < 0.001
3 14 (17.5) 2 (3.4) 1 (1.1) 1 (0.7) 18 1.44 ± 0.62 < 0.001
4 1 (1.3) 3 (5.1) 1 (1.1) 0 (0) 5 2.60 ± 0.89 0.004
5 1 (1.3) 1 (1.7) 0 (0) 0 (0) 2 - -
6 0 (0) 0 (0) 0 (0) 2 (1.5) 2 - -
7 1 (1.3) 0 (0) 0 (0) 0 (0) 1 - -
8 0 (0) 1 (1.7) 0 (0) 0 (0) 1 - -
Total 80 59 95 135 369 - -
*Due to small number of participants in some groups Fisher’s exact test was used
Braš et al. Health and Quality of Life Outcomes 2011, 9:56
/>Page 5 of 8
determination. Such modifying effects could be residing
in a number of possible effects, including personal cop-
ing capabilities, personal characteristics, societal support
orother.Itisthoseoutliersthatareactuallyveryinter-
esting in the broader perspective, especially knowing
that the therapeutic opportunities for these conditions
(PTSD) are often ineffective and when they do produce
effect they must be given in a form of a lifelong therapy.
This is of special interest in countries that underwent
substantial causal events such as Croatia in the post-war
period. Nearly two decades after the war has started,
Croatia is struggling with the consequences of the war.
The official data suggests that the total cost of war was
estimated at $37.4 billion USD, up to 20,000 persons
have been reported killed or missing, and more than
30,000 people have been disabled as a result of the war
[34]. The societal impact of this is enormous, despite
the fact that the real number of people suffering from
PTSD and other disorders is very difficult to estimate,
due to difficulties in diagnosing mild cases and the fact
that a p erson can develop PTSD years after the expo-
sure to traumatic event [35].
The other implication of this study lies in the possible
identification of specific PTSD subpopulation (cluster 3)
suffering from chronic LBP associated with significant
deterioration in QOL as seen in Figure 1. Although this
association between chronic pain syndromes and PTSD
has been established by some studies, most recently
National Comorbidity Survey-Replication with PTSD
having a high likelihood for chronic pain disorder (OR
= 5.4, 95% CI [3.6-7.9]), this area is underdeveloped
with scarce data about possible neural correlates and
treatment of chronic pain in PTSD [36-38]. Further-
more, the recent findings by Spoont et al. in a large
cohort of veterans with newly diagnosed PTSD from VA
facilities and primary practice suggesting that only a
minority of these patients receive adequate treatment
indicating that PTSD is still insufficiently treated [39].
Our results present the deterioration of QOL as an pos-
sible indicator of inadequate PTSD treatment. Chronic
PTSD with other comorbid pain disorder thus repre-
sents a challenge to a proper clinical management,
warranting further research.
The limitations of this study include pos sib le difficul-
ties in establishing PTSD, especially since most of the
diagnoses were set long time ago, in some cases even
during the war. However, this result also suggests the
chronic nature of the disease, reflected through the
inability of these patients to obtain satisfactory quality
of life even two decades after the traumatic experience.
There is also a possible bias in this, as we could have
Figure 1 Scatter plot showing the first two dimensions from
factor analysis and representing the two-dimensional
distribution of predicted cluster memberships according to all
26 items in the WHOQOL-BREF questionnaire. Clusters of size
with five or less participants are represented by fully coloured
rhomboid shapes.
Table 4 Results of the multinomial logistic regression analysis where each of the three study groups were contrasted
to controls in order to show their specific deviations from the control group
PTSD+LBP PTSD LBP
P OR [95% CI] P OR [95% CI] P OR [95% CI]
Age 0.164 1.07 [0.97-1.18] 0.818 1.01 [0.91-1.12] < 0.001 1.26 [1.14-1.39]
Employment status 0.015 2.57 [1.20-5.52] 0.001 3.43 [1.61-7.32] 0.484 1.29 [0.63-2.65]
Marital status < 0.001 0.32 [0.17-0.60] 0.005 0.40 [0.21-0.76] 0.057 0.59 [0.35-1.01]
Smoking 0.152 1.62 [0.84-3.15] 0.017 2.21 [1.15-4.24] 0.724 0.88 [0.45-1.75]
Education 0.689 1.16 [0.56-2.41] 0.351 1.42 [0.68-2.98] 0.298 1.42 [0.73-2.77]
Pysical activity < 0.001 0.39 [0.24-0.64] 0.060 0.62 [0.37-1.04] 0.001 0.46 [0.28-0.73]
Quality of life dimensions
Physical 0.916 1.00 [0.95-1.06] 0.976 1.00 [0.95-1.06] 0.207 1.03 [0.98-1.09]
Psychological 0.012 0.94 [0.89-0.99] 0.004 0.93 [0.88-0.98] 0.209 0.97 [0.92-1.02]
Social 0.197 0.95 [0.88-1.03] 0.643 0.98 [0.91-1.06] 0.858 0.99 [0.92-1.07]
Environmental 0.006 0.95 [0.91-0.98] 0.115 0.97 [0.93-1.01] 0.049 0.96 [0.92-1.00]
Overall quality of life < 0.001 0.15 [0.05-0.39] 0.010 0.14 [0.03-0.62] 0.058 0.45 [0.18-1.03]
Braš et al. Health and Quality of Life Outcomes 2011, 9:56
/>Page 6 of 8
included only those patients who have very resistant
from of PTSD that lasts for almost two decades, thus
perhaps even overestimating the results and the differ-
ence in quality of life. The WHOQOL-BREF survey con-
tains only three items related to social dimension of the
quality of life, thus suggesting that the results obtained
here could be to a certain level imprecise. This raises
the question of the appropriate QOL tool for future stu-
dies on PTSD, which shoul d focus on the social dimen-
sion more. Another limitation of this study is rather
small sample size, in a sense that some finer scale and
more subtle differences could not have been uncovered
and that larger sample sizes might be more appropriate
to detect these differences. Furthermore, PTSD also
bears potential to cause psychological changes of an
individual thus causing further difficulties is estimation
of true quality of life, and is also prone to various levels
of other possible known and unknown confound ers that
could affect the results.
Conclusions
The results of this study suggest a synergistic effect of
PTSD and low back pain on reduction of the quality of life
in patients suffering from b oth diagnoses. These results
are in line with the general pattern of expectation, where
increased psychological and physical load in an individual
leads to impaired quality of life. The degree of the change
seems to be dependant on a number of factors, but
patients who suffer from both PTSD and LBP show even
worse quality of life that those with PTSD only, despite
rather low effect size reported in this study. PTSD remains
a substantial problem in Croatian health care, with large
number of reported cases and high overall burden for
both health system and society in total.
Author details
1
Centre for Palliative Medicine, Medical Ethics and Communication Skills,
Medical School, University of Zagreb, Zagreb, Croatia.
2
Clinical Hospital
Merkur, Zagreb, Croatia.
3
Care of Children and Youth Zagreb, Zagreb,
Croatia.
4
Croatian Society for Pharmacoeconomics and Health Economics,
Zagreb, Croatia.
5
Department of Public Health, Medical School, University of
Split, Split, Croatia.
Authors’ contributions
MB and VD conceived the study and provided the research idea; VM, LBie <
and MB performed clinical work and surveyed the patients; MB, OP and VB
performed the analysis, MB, VB and OP drafted the article. All authors read
and approved the final manuscript
Competing interests
The authors declare that they have no competing interests.
Received: 15 January 2011 Accepted: 29 July 2011
Published: 29 July 2011
References
1. American Psychiatric Association: Diagnostic and Statistical Manual of Mental
Disorders Washington, DC, American Psychiatric Association; 1994.
2. Roberts WR, Penk WE, Gearing ML, Robinowitz R, Dolan MP, Patterson ET:
Interpersonal problems of Vietnam combat veterans with symptoms of
posttraumatic stress disorder. J Abnorm Psychol 1982, 91:444-450.
3. Carroll EM, Rueger DB, Foy DW, Donahoe Cp Jr: Vietnam combat veterans
with posttraumatic stress disorder: analysis of marital and cohabiting
adjustment. J Abnorm Psychol 1985, 94:329-337.
4. Centers for Disease Control Vietnam Experience Study: Health status of
Vietnam veterans: psychosocial characteristics. JAMA 1988,
259:2701-2707.
5. Kessler RC, Sonnega A, Bromet E, Hughes M, Nelson CB: Posttraumatic
stress disorder in the National Comorbidity Survey. Arch Gen Psychiatry
1995, 52:1048-1060.
6. Kulka RA, Fairbank JA, Jordan BK: Trauma and the Vietnam War Generation
New York: Brunner/Mazel; 1990.
7. Ozer EJ, Best SR, Lipsey TL, Weiss DS: Predictors of posttraumatic stress
disorder and symptoms in adults: a meta-analysis. Psychol Bull 2003,
129:52-73.
8. Brewin CR, Andrews B, Valentine JD: Meta-analysis of risk factors for
posttraumatic stress disorder in trauma-exposed adults. J Consult Clin
Psychol 2000, 68:748-766.
9. Gabriel R, Neal L: Post-traumatic stress disorder following military combat
or peace keeping. British Medical Journal 2002, 324:340-342.
10. Komar Z, Koren B, Trlek M: Posttraumatski stresni poremećaj.Edited by:
Pavlina Ž, Komar Z. Zagreb: Ministarstvo obrane Republike Hrvatske; 2000:,
Vojna psihologija [In Croatian].
11. Cramer M, Elliott P, Forbes D, Biddle D, Hawthorne G: Treatment for
combat related posttraumatic stress disorder: two-year follow up. Journal
of Traumatic Stress 2006, 19:675-685.
12. Beckham JC, Crawford AL, Feldman ME, Kirby AC, Hertzberg MA,
Davidson JRT, Moore SD: Chronic posttraumatic stress disorder and
chronic pain in Vietnam combat veterans. Journal of psychosomatic
research 1997, 43:379-389.
13. Avdibegovic E, Delic A, Hadzibeganovic K, Selimbasic Z: Somatic diseases
in patients with posttraumatic stress disorder. Med Arh 2010, 64:154-7.
14. Gatchel RJ, Peng YB, Peters ML, Fuchs PN, Turk DC: The biopsychosocial
approach to chronic pain: Scientific advances and future directions.
Psychological Bulletin 2007, 133:581-624.
15. Vlaeyen JW, Linton SJ: Fear-avoidance and its consequences in chronic
musculoskeletal pain: A state of the art. Pain 2000,
85:317-332.
16.
Denison E, Asenlo P, Lindberg P: Self-efficacy, fear avoidance, and pain
intensity as predictors of disability in subacute and chronic
musculoskeletal pain patients in primary health care. Pain 2004,
111:245-252.
17. Stroud MW, Thorn BE, Jensen MP, Boothby JL: The relation between pain
beliefs, negative thoughts, and psychosocial functioning in chronic pain
patients. Pain 2000, 84:347-352.
18. Johansen VA, Wahl AK, Eilersten DE, Weisaeth L, Hanestad BR: The
predictive value of post-traumatic stress disorder symptoms for quality
of life: a longitudinal study of physically injured victims of non-domestic
violence. Health and quality of life outcomes 2007, 5 :26.
19. Chen YS, Chen MC, Chou FHC, Sun FC, Chen PC, Tsai KY, Chao SS: The
relationship between quality of life and posttraumatic stress disorder or
major depression for firefighters in Kaohisiung, Taiwan. Qual Life Res
2007, 16:1289-1297.
20. Mason VL, Skevington SM, Osborn S: A measure for quality of life
assessment in chronic pain: preliminary properties oft he WHOQOL-pain.
J Behav Med 2009, 32:162-173.
21. Wahl AK, Rustoen T, Rokne B, Lerdal A, Knudsen O, Miakowski C, Moum T:
The complexity of the relationship between chronic pain and quality of
life: a study of the general Norwegian population. Qual Life Res 2009,
18:971-980.
22. Ikin JF, Sim MR, McKenzie DP, Horsley KWA, Wilson EJ, Harrex WK,
Moore MR, Jelfs PL, Henderson S: Life satisfaction and quality in Korean
War veterans five decades after the war. J Epidemiol Community Health
2009, 63:359-365.
23. Babić-Banaszak A, Kovačć L, Kovačević L, Vuletić G, Mujkić A, Ebling Z:
Impact of War on Health Related Quality of Life in Croatia: Population
Study. Croatian Medical Journal 2002, 43:396-402.
24. Interactive Statistics: Fisher 2*5.[ />25. World Health Organisation: WHO Quality of Life-BREF.[ />substance_abuse/research_tools/whoqolbref/en/].
Braš et al. Health and Quality of Life Outcomes 2011, 9:56
/>Page 7 of 8
26. Clapp JD, Beck JG, Palyo SA, Grant DM: An examination of the synergy of
pain and PTSD on quality of life: additive or multiplicative effects? Pain
2008, 138:301-9.
27. Zatzick DF, Marmar CR, Weiss DS, Browner WS, Metzler TJ, Golding JM,
Stewart A, Schlenger WE, Wells KB: Posttraumatic stress disorder and
functioning and quality of life outcomes in a nationally representative
sample of male Vietnam veterans. Am J Psychiatry 1997, 154:1690-1695.
28. Jordan BK, Marmar CR, Fairbank JA, Schlenger WE, Kulka RA, Hough RL,
Weiss DS: Problems with families of male Vietnam veterans with
posttraumatic stress disorder. J Consult Clin Psychol 1992, 60:916-926.
29. Malik ML, Connor KM, Sutherland SM, Smith RD, Davison RM, Davidson JR:
Quality of life and posttraumatic stress disorder: a pilot study assessing
changes in SF-36 scores before and after treatment in a placebo-
controlled trial of fluoxetine. J Trauma Stress 1999, 12:387-393.
30. Braš M, Milunović V, Boban M, Micković V, Lončar Z, Gregurek R, Laco M: A
quality of life in chronic combat related posttraumatic stress disorder; a
study on Croatian war veterans. Collegium Antroplogicum .
31. Brewin CR, Andrews B, Valentine JD: Meta-analysis of risk factors for
posttraumatic stress disorder in trauma-exposed adults. J Consult Clin
Psychol 2000, 68:748-66.
32. Kapfhammer HP, Rothenhäusler HB, Krauseneck T, Stoll C, Schelling G:
Posttraumatic stress disorder and health-related quality of life in long-
term survivors of acute respiratory distress syndrome. Am J Psychiatry
2004, 161:45-52.
33. Schelling G, Stoll C, Haller M, Briegel J, Manert W, Hummel T, Lenhart A,
Heyduck M, Polasek J, Meier M, Preuss U, Bullinger M, Schüffel W, Peter K:
Health-related quality of life and posttraumatic stress disorder in
survivors of the acute respiratory distress syndrome. Crit Care Med 1998,
26:651-9.
34. Johansen VA, Wahl AK, Eilertsen DE, Weisaeth L, Hanestad BR: The
predictive value of post-traumatic stress disorder symptoms for quality
of life: a longitudinal study of physically injured victims of non-domestic
violence. Health Qual Life Outcomes 2007, 5:26.
35. Government of the Republic of Croatia: War damage in the Republic of
Croatia. Croatian Government Bulletin 1999 [ />1999/sep-oct/documents.html.], Accessed: March 5, 2002.
36. Arbanas G: Patients with combat-related and war-related posttraumatic
stress disorder 10 years after diagnosis. Croat Med J 2010, 51:209-14.
37. Sledjeski EM, Speisman B, Dierker LC: Does number of lifetime traumas
explain the relationship between PTSD and chronic medical conditions?
Answers from the National Comorbidity Survey-Replication (NCS-R). J
Behav Med 2008, 31:341-9.
38. Mickleborough MJ, Daniels JK, Coupland NJ, Kao R, Williamson PC,
Lanius UF, Hegadoren K, Schore A, Densmore M, Stevens T, Lanius RA:
Effects of trauma-related cues on pain processing in posttraumatic
stress disorder: an fMRI investigation. J Psychiatry Neurosci 2011, , 36: 6-14.
39. Asmundson GJ, Katz J: Understanding the co-occurrence of anxiety
disorders and chronic pain: state-of-the-art. Depress Anxiety 2009, , 26:
888-901.
doi:10.1186/1477-7525-9-56
Cite this article as: Braš et al.: Quality of life in Croatian Homeland war
(1991-1995) veterans who suffer from post-traumatic stress disorder
and chronic pain. Health and Quality of Life Outcomes 2011 9:56.
Submit your next manuscript to BioMed Central
and take full advantage of:
• Convenient online submission
• Thorough peer review
• No space constraints or color figure charges
• Immediate publication on acceptance
• Inclusion in PubMed, CAS, Scopus and Google Scholar
• Research which is freely available for redistribution
Submit your manuscript at
www.biomedcentral.com/submit
Braš et al. Health and Quality of Life Outcomes 2011, 9:56
/>Page 8 of 8