báo cáo hóa học:" The health loss from ischemic stroke and intracerebral hemorrhage: evidence from the North East Melbourne Stroke Incidence Study (NEMESIS)" doc
Bạn đang xem bản rút gọn của tài liệu. Xem và tải ngay bản đầy đủ của tài liệu tại đây (512.03 KB, 8 trang )
Cadilhac et al. Health and Quality of Life Outcomes 2010, 8:49
/>Open Access
RESEARCH
BioMed Central
© 2010 Cadilhac et al; licensee BioMed Central Ltd. This is an Open Access article distributed under the terms of the Creative Commons
Attribution License ( which permits unrestricted use, distribution, and reproduction in
any medium, provided the original work is properly cited.
Research
The health loss from ischemic stroke and
intracerebral hemorrhage: evidence from the
North East Melbourne Stroke Incidence Study
(NEMESIS)
Dominique A Cadilhac*
1,2,3
, Helen M Dewey
1,2,4
, Theo Vos
5
, Rob Carter
3
and Amanda G Thrift
1,6,7
Abstract
Background: People suffering different types of stroke have differing demographic characteristics and survival.
However, current estimates of disease burden are based on the same underlying assumptions irrespective of stroke
type. We hypothesized that average Quality Adjusted Life Years (QALYs) lost from stroke would be different for ischemic
stroke and intracerebral hemorrhage (ICH).
Methods: We used 1 and 5-year data collected from patients with first-ever stroke participating in the North East
Melbourne Stroke Incidence Study (NEMESIS). We calculated case fatality rates, health-adjusted life expectancy, and
quality-of-life (QoL) weights specific to each age and gender category. Lifetime 'health loss' for first-ever ischemic
stroke and ICH surviving 28-days for the 2004 Australian population cohort was then estimated. Multivariable
uncertainty analyses and sensitivity analyses (SA) were used to assess the impact of varying input parameters e.g. case
fatality and QoL weights.
Results: Paired QoL data at 1 and 5 years were available for 237 NEMESIS participants. Extrapolating NEMESIS rates,
31,539 first-ever strokes were expected for Australia in 2004. Average discounted (3%) QALYs lost per first-ever stroke
were estimated to be 5.09 (SD 0.20; SA 5.49) for ischemic stroke (n = 27,660) and 6.17 (SD 0.26; SA 6.45) for ICH (n =
4,291; p < 0.001). QALYs lost also differed according to gender for both subtypes (ischemic stroke: males 4.69 SD 0.38,
females 5.51 SD 0.46; ICH: males 5.82 SD 0.67, females 6.50 SD 0.40).
Discussion: People with ICH incurred greater loss of health over a lifetime than people with ischemic stroke. This is
explained by greater stroke related case fatality at a younger age, but longer life expectancy with disability after the first
12 months for people with ICH. Thus, studies of disease burden in stroke should account for these differences between
subtype and gender. Otherwise, in countries where ICH is more common, health loss for stroke may be
underestimated. Similar to other studies of this type, the generalisability of the results may be limited. Sensitivity and
uncertainty analyses were used to provide a plausible range of variation for Australia. In countries with demographic
and life expectancy characteristics comparable to Australia, our QoL weights may be reasonably applicable.
Background
Worldwide, stroke is a significant contributor to disease
burden. In Australia, stroke is the second leading cause of
death [1]. Of those with first-ever stroke, about 35% die
within 12 months of their stroke [2] and about half of sur-
vivors at 12 months are dependent on others [3]. The cost
of stroke is high, with the present value of lifetime costs
of first-ever stroke in 2004 estimated to cost more than
AUD2 billion (~2% of total annual health expenditure [4])
to the Australian community [5].
In the NEMESIS study, 72.5% of strokes were ischemic
stroke while 14.5% were intracerebral hemorrhage (ICH);
4.3% were subarachnoid hemorrhage and in 8.7% the sub-
type was undetermined [6]. Importantly, these different
types of stroke have different risk factors, treatments and
* Correspondence:
1
National Stroke Research Institute, Heidelberg Heights 3081, Vic, Australia
Full list of author information is available at the end of the article
Cadilhac et al. Health and Quality of Life Outcomes 2010, 8:49
/>Page 2 of 8
outcome. Case-fatality at one year is lower for first-ever
ischemic stroke (reported range from Australian inci-
dence studies 23% to 31%) than for ICH (39% to 50%) and
undetermined stroke (67% to 89%) [6,7]. When assessing
the effect of stroke on society it is important to include
measures of both mortality and morbidity, as stroke
affects both of these outcomes.
Summary measures of population health include
Health Adjusted Life Expectancy (HALE), Disability
Adjusted Life Years (DALYs) and Quality Adjusted Life
Years (QALYs). The HALE value represents the number
of expected years of life equivalent to years lived in full
health adjusted for time spent in poor health based on
current rates of ill-health (e.g. chronic disease) and mor-
tality in a community. The DALY is a health gap measure
and captures the years of life lost (YLL) due to premature
mortality (in this case from stroke) and the years of life
lived with disability (YLD) as a consequence of having
had a stroke. QALYs are based on a similar conceptual
framework (life expectancy plus quality of life [QoL]), but
are often based on different assumptions and methods
[8,9]. DALYS have gained prominence in recent years
with the extensive systematic review of burden of disease
[10].
One of the main differences for DALYs and QALYS is
the way health states (i.e. the physical, social and emo-
tional functioning of individuals) [11], such as stroke, are
weighted. Traditionally, QALYs are based on a heath
related QoL weight that is directly derived from
patients or the general population while DALY weights
have more commonly been elicited from expert pan-
els[8,12]. There are both advantages and disadvantages
for each approach. Regardless, the preference weights
derived for both DALYs and QALYs reflect departures
from good health [8,13]. It has been found that stroke
survivors usually assign themselves higher utilities (i.e. a
value that represents the strength of an individual's pref-
erence for a particular health outcome) than do the gen-
eral community or caregivers of stroke survivors [8].
Current estimates of DALYs for stroke in Australia have
used preference weights directly elicited from patients
[14].
QALYs are usually reported as something society will
want to gain, while DALYs are to be avoided. To keep the
concept similar to a DALY, one can instead report the
QALYs lost. This provides a measure of the health gap
experienced by stroke survivors compared to the normal
population and provides an estimate of the health gain
that could be achieved if a stroke was prevented. Such
information is important when making assessments of
the value of various interventions, such as in cost-effec-
tiveness analysis.
Health-related QoL of stroke patients has been well
documented as part of the North East Melbourne Stroke
Incidence Study (NEMESIS). This provided an opportu-
nity to estimate the health loss attributable to stroke
using prospectively elicited QoL data from individual
stroke patients. In NEMESIS a health state classification
questionnaire, the Assessment of Quality of Life (AQoL)
tool [15], was used whereby a utility score (an index of the
strength of a person's preference for a health state where
death is represented as 0.0 and normal health as 1.0)
can be derived. This utility score can be used to provide
the preference weight in estimating health loss. Because
of the recognized differences between the main stroke
subtypes, we hypothesized that average QALYs lost
would be different for ischemic stroke and ICH.
Methods
We developed a 'Lifetable' model, created in Excel
(Microsoft Corporation, 2003), to accommodate a 'life-
time' perspective for an incident cohort of people with
stroke.
Incidence and case-fatality data obtained from NEME-
SIS were applied to Australian population data to esti-
mate the size of the cohort. The NEMESIS data
constitute 'best available' information. Authors of the
2003 Australian BoD study have used NEMESIS data and
have compared representative Australian hospital admis-
sion rates from 1996/1997 with those in NEMESIS
mapped to the relevant statistical local areas[14]. The
ratios of hospital admissions in NEMESIS catchment
areas to those in all of Australia in 1996/97 ranged from
0.9 to 1.3 by age and sex with an overall ratio close to
unity (personal communication, T. Vos March 2010).
Nonetheless, we included point estimates used from
NEMESIS in the sensitivity and uncertainty analyses as
outlined in the Analysis section below. In addition,
because early mortality in ICH is much greater than in
ischemic stroke and would dominate comparisons with
ischemic stroke, estimates of health loss were based on 28
day survivors. Twenty-eight day survivors were catego-
rized into age-groups according to their starting age
(mid-point ages for < 55, 55 to 64, 65 to 74, 75 to 84 and
85+ years) up to age 100. Deaths attributable to stroke
(not 'all cause' mortality) were calculated for day 28, 12
months and then for each year up to 5 years after stroke
using NEMESIS data. Between 5 and 10 years the proba-
bility of dying each year attributable to stroke was main-
tained at the same year 5 probability since no other data
were available. After 10 years, remaining survivors were
assumed to have the same probability of death as the gen-
eral population for that age band and gender. Although
one may argue that mortality risk may not return to that
of the general population, since risk factors in the general
population will have increased over time, and may be at
similar levels to those of the stroke population, we there-
Cadilhac et al. Health and Quality of Life Outcomes 2010, 8:49
/>Page 3 of 8
fore felt this was a plausible approach given the current
limitations of data.
The QoL weights used to estimate QALYs lost were
derived from the AQoL Mark 1 instrument which has
previously been validated for use in stroke using NEME-
SIS data [16]. We used published 'normal' population val-
ues derived from the AQoL instrument [17] by age band
as a measure of pre-stroke QoL. The QoL (preference)
weight was then calculated as the net difference between
these two scores, and could be described as the utility
loss attributable to stroke. Because it was important
that change in QALYs over time be reported using longi-
tudinal data we used the average of paired utilities
obtained from the same cases at 12 months and 5 years.
In applying these utility values in the 'Lifetable' model a
linear relationship between the 12 month and 5 year val-
ues were assumed. This is because the direction and mag-
nitude of change between the 12 month and 5 year time
points for each age band varied and was usually small
(min 0.006 in < 55 year olds and max 0.12 in 75-84 year
olds). Therefore, a more elaborate approach was consid-
ered unnecessary. After 5 years, we assumed that survi-
vors would have the same utility loss as the 5 year utility
loss in each relevant age band.
To avoid overestimating life expectancy, we used HALE
values calculated for the Australian 2003 BoD study [18]
for life expectancy in our Lifetable model according to
age group. That is, the net difference in health loss due to
stroke was estimated by subtracting the estimated HALE
value for someone without stroke from that estimated for
a person of the same age and gender with stroke to pro-
vide the final QALY loss result. We assumed HALE val-
ues for the 2003 population were applicable to the 2004
population used in this analysis. Thus, results from this
research could be used for economic evaluations using
our redeveloped stroke economic model [5]. Standard
population life expectancies were not used as they were
considered insufficient to address the impact on QoL,
since people with stroke may also have non stroke-related
disability as they get older.
Analysis
T-tests for continuous variables were applied using Inter-
cooled STATA version 8 (Stata Corporation, 2003). The
level of significance was set at p < 0.05 (two-sided).
We used a 3% discount rate to accord with methods
recommended in the Australian BoD study [14]. Since the
issue of discounting QALYs is still debated [19], undis-
counted QALYs were also estimated. We also provide
estimates for different age groups and gender using a 5%
discount rate to accord with other studies. Multivariable
probabilistic uncertainty analyses were undertaken using
@Risk software version 4.5 (Palisade Corporation, 2005).
The sampling variations incorporated for point estimates
were based on triangular distributions (minimum, most
likely and maximum) that approximate a normal distribu-
tion. The minimum and maximum values were obtained
from literature reviews or best available data and applied
as a proportion greater or less than the point estimate.
Variables included incidence (range used -5% to +1%)
[20,21]; survival (-2% to +1%) [22,23]; and average QALYs
lost (ischemic stroke 4%; ICH 2% based on the plausible
variation found using NEMESIS data). Three thousand
'Monte Carlo' simulations were undertaken to ensure
convergence. Convergence was defined as less than 1.5%
variation in primary outcome statistics, such as numbers
of strokes. The 3,000 individually simulated point esti-
mates were used to estimate a mean, median and 95%
uncertainty interval for the results.
To test the sensitivity of the QALY loss estimates we
substituted the NEMESIS QoL weights and case fatality
rates with estimates used in the 2003 BoD study for
stroke. To distinguish between these estimates, we define
these results as DALYs. The results were compared to
describe the potential variation that might occur when
different input parameters (e.g. QoL weights and case-
fatality rates) for Australia are used.
Results
At 12 months and 5 years, 237 first-ever stroke survivors
provided AQoL responses. The sample size was insuffi-
cient to estimate utilities beyond age and gender catego-
ries. We found that the utilities obtained for males and
females were not statistically different (data not shown).
Thus, utility data were disaggregated by age band and the
net difference between published normal Australian pop-
ulation data [17] were then estimated (Table 1). In those
aged < 64 years, differences between the normal popula-
tion and NEMESIS survivors were small, and were similar
at 12 months and 5 years post stroke. This provides evi-
dence that disutility from stroke tends to stabilise after 12
months in people of working or younger ages. In contrast,
in those aged over 64 years, the net difference in utilities
between the normal population and NEMESIS survivors
was large at both 12 months and 5 years. In addition, the
health loss was greater at 5 years than at 12 months and
may be associated with survivors experiencing non-
stroke related disability.
The estimated 'lifetime' health loss attributable to first-ever
strokes
Overall, the average QALYs lost per first-ever stroke case
weighted for age and gender distribution was estimated
to be 5.09 for ischemic stroke and 6.17 for ICH (Table 2).
This means that a person who has a stroke loses 5 or six
years of healthy life when compared to the normal popu-
lation. The equivalent undiscounted weighted average
QALYs lost were 7.24 for ischemic stroke and 8.88 for
Cadilhac et al. Health and Quality of Life Outcomes 2010, 8:49
/>Page 4 of 8
ICH. The effect of a 3% discount rate was to reduce aver-
age QALYs lost per case by about two years for ischemic
stroke and almost three years for ICH. The difference in
average QALYs lost per case was significantly greater for
ICH than ischemic stroke (p < 0.0001) and was signifi-
cantly greater for females than males for each stroke sub-
types (both p < 0.0001; Table 2).
Applying these data to the 2004 Australian population,
we estimated that there would be median 27,344 (95% UI
26,517, 27,831) first-ever ischemic strokes and median
4,247 (95% UI 4,121, 4,322) ICHs in Australia. The total
QALYs lost attributable to these strokes were 139,018
(95% UI 133,311, 144,574) for incident ischemic stroke
and 26,177 (95% UI 25,304, 26,867) for incident ICH
(Table 3).
Sensitivity analysis
When QoL weights and case fatality rates applied in the
2003 BoD study for stroke were substituted for those
used in the primary analysis we found the difference
between the two health loss measures (i.e. reported as
DALYs and QALYs for simplicity) per case ranged from
Table 1: Average and net difference in utility scores between Australian population and first-ever stroke survivors.
Normal population† NEMESIS utility scores* Net difference (QoL
weights)
Age n Mean
utility
n 12
months
SD 5 years SD 12
months
5 years
< 55 578 0.85 27 0.8249 0.2231 0.8189 0.1751 0.0251 0.0311
55-64 378 0.80 33 0.7422 0.2762 0.7553 0.2700 0.0578 0.0447
65-74 301 0.79 85 0.6035 0.2963 0.5485 0.3188 0.1865 0.2415
75-84 263 0.75 74 0.4986 0.3123 0.3722 0.3282 0.2514 0.3778
85+ 96 0.66 18 0.2341 0.2643 0.1465 0.2241 0.4259 0.5135
Total 1 616 237 0.1886‡ 0.2533‡
*Utility scores were obtained using the Assessment of Quality of Life (AQoL) instrument.
†Obtained from AQoL publication [17] and based on equivalent midpoint age used in the model. The normal population for age less than 55
comprises estimates for the 30-39 age group. This is because the midpoint for NEMESIS cases in the < 55 age group was 33 years. Utility
estimates in the other age bands result from normal population for ages 50-59, 60-69, 70-79 and 80+, respectively.
‡summary estimate weighted for age and population size
NEMESIS: North East Melbourne Stroke Incidence Study.
Table 2: Quality Adjusted Life Years lost according to stroke subtype and gender
Ischemic stroke Intracerebral Hemorrhage
Males
N= 14 139
Females
N= 13 521
Males
N = 2 087
Females
N = 2 204
QALY lost per case
Age Group years QALYs with 3% discounting (5% discounting, 0% discounting)
< 55 5.5 (3.7, 11.1) 9.8 (4.7, 20.2) 10.7 (7.3, 21.7) 12.5 (8.6, 25.6)
55-64 6.3 (5.0, 9.7) 7.6 (5.8, 12.1) 7.4 (5.9, 11.0) 10.9 (8.6, 16.3)
65-74 6.6 (5.7, 8.5) 7.6 (6.5, 10.2) 6.6 (5.7, 8.4) 7.6 (6.4, 10.1)
75-84 3.7 (3.3, 4.3) 4.9 (4.4, 5.9) 3.9 (3.5, 4.5) 5.1 (4.6, 6.1)
85+ 2.3 (2.1, 2.5) 2.5 (2.4, 2.8) 2.2 (2.1, 2.4) 2.4 (2.2, 2.6)
Weighted average
(SD)†
4.69 (0.38) 5.51 (0.46)* 5.82 (0.67) 6.50 (0.40)*
Total weighted
average (SD)†
5.09 (0.20) 6.17 (0.26)*
Undiscounted total
weighted average
7.24 8.88
*p value < 0.0001; QALYs: Quality Adjusted Life Years; SD: standard deviation; †3% discount rate used.
Cadilhac et al. Health and Quality of Life Outcomes 2010, 8:49
/>Page 5 of 8
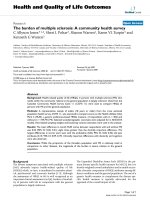
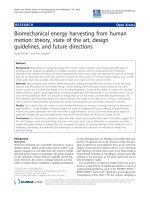
about 0.28 (~3 months) for ICH and 0.40 (~5 months) for
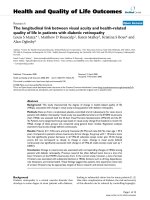
ischemic stroke (Table 4). The greatest differences
between the two outcome measures were seen in those
aged less than 55-years where the DALY estimate was
larger (Figure 1). This difference was observed in both
stroke subtypes, among both males (2.3 years for ICH and
3 years for ischemic stroke) and females (1 year for ICH
and 1.3 years for ischemic stroke). Conversely, in the
older age bands (> 65 years) for males the QALYs lost
were slightly greater (approximately 4 months more) than
the DALYs.
Discussion
We found that people with ICH incurred greater health
losses over a lifetime than those having an ischemic
stroke and that this is explained by greater stroke-related
case fatality in cases with ICH (average over 5 years was
40% greater for ICH). Moreover, since ICH's experience
stroke a younger age, those that survive also have a
greater duration of disability since these survivors will
have a greater life expectancy. We also found that QALY
losses were greater for females than males in both stroke
subtypes. Previous research on QALYs lost from stroke
have been provided for generic stroke or by stroke sever-
ity [8,19]. It is reported that only about half of the vari-
ance in QoL is explained by stroke severity [13]. Because
the QoL weights used were the same for both stroke sub-
types and gender, the differences that we observed in
QALYs between the stroke types reflect differences in the
Table 3: Modelled estimates of stroke subtype and QALYs lost: Results of uncertainty analyses.
Modeled point estimates† 95% Uncertainty interval†
Stroke subtype Mean Median Lower bound (2.5%) Higher bound
(97.5%)
Ischemic stroke
Number of strokes 27,291 27,344 26,517 27,831
Total number of
QALYs lost
(incident cases) *
138,962 139,018 133,311 144,574
Intracerebral
Hemorrhage
Number of strokes 4,239 4,247 4,121 4,322
Total number of
QALYs lost
(incident cases)‡
26,145 26,177 25,304 26,867
QALYs: Quality Adjusted Life Years; *3% discount rate used; †3,000 simulations.
Table 4: Difference in DALYs and QALYs: Sensitivity analyses for average lifetime health loss*.
Stroke subtype DALYs QALYs Difference
Intracerebral hemorrhage
(n = 4 291)
Average per first-ever
stroke event
6.45 6.17 0.28
Total health loss for
cohort
27 696 26 456 1 240
Ischemic stroke (n = 27 660)
Average per first-ever
stroke event
5.49 5.09 0.40
Total health loss for
cohort (years lost)
151 982 140 835 11 147
*Weighted by age and gender distribution of the 2004 reference cohort. DALYs estimated using the Western Australian ' excess' case fatality
rate from the WA hospital morbidity database after 28 days following stroke and disability weights for stroke [14]. DALYs: Disability Adjusted
Life Years; QALYs: Quality Adjusted Life Years.
Cadilhac et al. Health and Quality of Life Outcomes 2010, 8:49
/>Page 6 of 8
age of stroke onset and case fatality between these sub-
types.
There has been considerable discussion about the best
method for deriving the QoL weight. It is important that
this is measured carefully because it comprises a major
component of the QALY and inaccuracies will lead to
inaccurate estimates. The estimates of QoL weights
reported in the literature vary considerably for generic
stroke, ranging from 0.29 to 0.903 in a recent meta-analy-
sis [13]. These large differences have been attributed to
different elicitation methods [19] (e.g. from people with
and without stroke or health experts [8]) including the
type and range of tool used; timing of elicitation between
the event and the assessment; differences in age and gen-
der; and the variance for weights obtained [13]. In our
study, the QoL utility loss varied by age and time since
stroke and ranged between 0.025 and 0.514. Our sum-
mary QoL weight estimate at 12 months was 0.19 and at 5
years 0.25 (adjusted for age and population size). These
preference weights are consistent with the lower bound of
those reported in the literature.
There are a number of strengths in this study. First, we
used comprehensive data obtained from a large commu-
nity-based stroke incidence study (NEMESIS). Impor-
tantly, the QoL weights were directly elicited from the
same patients at 12 months and 5 years using the AQoL
instrument and are appropriate for the reference popula-
tion [16]. Use of QoL weights for survivors for up to 5
years is an added advantage to previous studies that have
been based on 12-month estimates [13]. This provides a
longer-term perspective rarely included in the estimation
of health loss for stroke. Furthermore, because health loss
was estimated separately for ICH and ischemic stroke,
this will enable investigators to evaluate interventions
specific to ICH and ischemic stroke.
Similar to other studies of this type, the generalisability
of the results may be limited. Although NEMESIS esti-
mates are unbiased at a community level as we have
obtained almost every case in a specific population (i.e.
community-based rather than hospital-based) and evi-
dence for the 2003 Australian BoD study provide good
evidence that these data are fairly representative for Aus-
Figure 1 Differences in average health loss (years) when using different case-fatality and preference disease weights for stroke, according
to age group.
0
2
4
6
8
10
12
14
< 55 years 55-64 years 65-74 years 75-84 years 85+ years
Average Health Loss
DALYs males ICH QALYs lost males ICH
DALYs males ischemic stroke QALYs lost males ischemic stroke
DALYs females ICH QALYs lost females ICH
DALYs females ischemic stroke QALYs lost females ischemic stroke
Cadilhac et al. Health and Quality of Life Outcomes 2010, 8:49
/>Page 7 of 8
tralia as a whole, potential differences across Australia in
ethnicity and socioeconomic status may be important.
Therefore, it was necessary to provide detailed sensitivity
and uncertainty analyses for these data which provide a
plausible range of variation for Australia. In countries
with demographic and life expectancy characteristics
comparable to Australia, our QoL weights should, there-
fore, be reasonably applicable.
Other limitations include the assumption that NEME-
SIS incidence rates are applicable for Australia; that use of
the normal population utility values to estimate pre-
stroke utility are applicable to people who experience
stroke when their risk profile may mean they have greater
pre-morbid disability; and longer-term (5 year) disutility
in people with stroke may reflect co-morbidity from
other diseases. Another important limitation was the
assumption that in those surviving beyond 5 years the
QoL weight values that were applied were those of the
next older age band. Because the available longitudinal
data re quality of life in the long-term are limited in
stroke cohorts we adopted this approach as the most fea-
sible. It also ensured that these data were consistent with
those of other studies. Methods used to address this limi-
tation included (1) describing the health loss for stroke
according to stroke subtype since this is one of the major
factors likely to influence health status over time; (2) use
of the 5 year QoL weight values; and (3) multivariable
probabilistic uncertainty analysis to assess the impact of a
range of important variables including survival rates
where evidence is limited but a plausible range of values
could be considered. Lastly, the use of triangular distribu-
tions rather than use of normal distributions for esti-
mates derived from NEMESIS, such as the QoL weight
may have underestimated the uncertainty. It was the con-
sidered view of the author group, that triangular distribu-
tions would enable ranges to be selected that would best
reflect the data we had, as samples size were small when
QoL data were disaggregated by the 5 age groups nomi-
nated.
These identified limitations may provide sources of
over and under estimation of health loss. Inaccurate esti-
mation of health-related QoL can have major implica-
tions when used to undertake cost-effectiveness analysis.
This is because, as a summary measure for population
health which attributes a perceived social value to differ-
ent health states, variance in QALYs may result in inap-
propriate resource allocation decisions [19]. In other
words, use of different QoL weights may over- or under-
estimate the QALY gain for an intervention therefore
producing contradictory cost-effectiveness results. Use of
multivariable probabilistic uncertainty and sensitivity
analyses in this study were used to address such potential
limitations and, overall, the estimates were fairly robust.
Conclusions
Estimates of health loss measured as QALYs were pre-
sented for Australia. Notably, these estimates were based
on patient-level data obtained up to 5 years following
stroke. We provide evidence that the health loss attribut-
able to ICH and ischemic stroke are different; health loss
also varies between males and females. Therefore, when
undertaking studies of disease burden in stroke, investi-
gators should account for these differences between sub-
type and gender. Otherwise, in countries where ICH is
more common, the disease burden for stroke may be
underestimated. Lastly, the estimates provide quantifiable
measures of the average health loss over a lifetime per
first-ever case of stroke that may be applied in economic
evaluations to determine the cost-effectiveness of preven-
tion interventions.
Competing interests
The authors declare that they have no competing interests.
Authors' contributions
DC designed the study, contributed to the development of the lifetable mod-
els, analysed and interpreted the data and drafted the manuscript. HD partici-
pated in the design of the study and helped to draft the manuscript. TV
provided access to Australian Burden of Disease data for use in this study, for-
mulated the lifetable model template used in this study and helped to draft
the manuscript. RC participated in the design of the study and interpretation
of the data and helped to draft the manuscript. AT is the principal investigator
for NEMESIS, she contributed to the design of this study and provided input
data analysed specifically for this study from NEMESIS related to stroke mortal-
ity estimates and paired AQoL utility values at 12 months and 5 years. All
authors read and approved the final manuscript.
Authors' information
All authors have a PhD. DC is the Head of the Public Health Division of the
National Stroke Research Institute and has a clinical background in nursing. HD
is an Associate Professor for the Department of Medicine (The University of
Melbourne) and is the Deputy Director of Neurology at Austin Health (Vic, Aus-
tralia). TV is the Director, Centre for Burden of Disease and Cost-Effectiveness,
School of Population Health at The University of Queensland (Australia) as is
also qualified as a medical practitioner. RC is a Professor and the inaugural
Chair of Health Economics at Deakin University (Burwood, Australia). AT is an
NHMRC Senior Research Fellow, the Head of Stroke Epidemiology at the Baker
IDI Heart and Diabetes Institute, as well as an Associate Professor for Monash
University (Australia).
Acknowledgements
We wish to acknowledge Judith Katzellenbogen for providing details of her
methods used to estimate the stroke burden in the 2003 Australian Burden of
Disease study. We acknowledge the important contribution of the research
nurses who have directly collected the outcome data for NEMESIS.
Helen Dewey, Rob Carter and Amanda Thrift were supported by research fel-
lowships from the National Health and Medical Research Council (NHMRC).
Dominique Cadilhac was supported by an NHMRC postgraduate public health
scholarship and a public health grant from the Victorian Health Promotion
Foundation (VicHealth). The North East Melbourne Stroke Incidence Study was
supported by grants from the NHMRC, VicHealth, the Foundation for High
Blood Pressure Research, and the National Stroke Foundation. None of the
funders contributed to the study design; in the collection, analysis, and inter-
pretation of data; in the writing of the manuscript; and in the decision to sub-
mit the manuscript for publication.
Cadilhac et al. Health and Quality of Life Outcomes 2010, 8:49
/>Page 8 of 8
Author Details
1
National Stroke Research Institute, Heidelberg Heights 3081, Vic, Australia,
2
Department of Medicine, The University of Melbourne 3010, Australia,
3
Deakin Health Economics, Deakin University, Burwood 3125, Australia,
4
Department of Neurology, Austin Health, Heidelberg 3084, Australia,
5
School
of Population Health, University of Queensland, Herston 4006, Australia,
6
Baker
IDI Heart and Diabetes Institute, Melbourne, Australia and
7
Department
Epidemiology & Preventive Medicine, Monash University, Melbourne, Australia
References
1. Australian Bureau of Statistics: 3303.0 Causes of death 2206: Australia.
Canberra: ABS; 2008:88.
2. Thrift AG, Dewey HM, Sturm JW, Srikanth VK, Gilligan AK, Gall SL,
Macdonell RA, McNeil JJ, Donnan GA: Incidence of stroke subtypes in
the North East Melbourne Stroke Incidence Study (NEMESIS):
differences between men and women. Neuroepidemiology 2009,
32(1):11-18.
3. Sturm JW, Dewey HM, Donnan GA, Macdonell RA, McNeil JJ, Thrift AG:
Handicap after stroke: how does it relate to disability, perception of
recovery, and stroke subtype?: the North East Melbourne Stroke
Incidence Study (NEMESIS). Stroke 2002, 33(3):762-768.
4. Australian Institute of Health and Welfare: Health expenditure Australia
2006-07. Health and Welfare Expenditure Series no. 35. Cat. no. HWE
42. Canberra: AIHW; 2008:186.
5. Cadilhac DA, Carter R, Thrift AG, Dewey HM: Estimating the long-term
costs of ischemic (IS) and hemorrhagic (ICH) stroke for Australia: new
evidence derived from the North East Melbourne Stroke Incidence
Study (NEMESIS). Stroke 2009, 40:915-921.
6. Thrift AG, Dewey HM, Macdonell RA, McNeil JJ, Donnan GA: Incidence of
the major stroke subtypes: initial findings from the North East
Melbourne stroke incidence study (NEMESIS). Stroke 2001,
32(8):1732-1738.
7. Sudlow CL, Warlow CP: Comparable studies of the incidence of stroke
and its pathological types: results from an international collaboration.
International Stroke Incidence Collaboration. Stroke 1997,
28(3):491-499.
8. Post PN, Stiggelbout AM, Wakker PP: The utility of health states after
stroke: a systematic review of the literature. Stroke 2001,
32(6):1425-1429.
9. Sassi F: Calculating QALYs, comparing QALY and DALY calculations.
Health Policy Plan 2006, 21(5):402-408.
10. Mathers C, Bernard C, Iburg K, Inoue M, Ma Fat D, Shibuya K, Stein C,
Tomijima N: The Global Burden of Disease in 2002: data sources,
methods and results. Organization WH. Geneva: World Health
Organization; 2003.
11. Drummond M, O'Brien B, Stoddart GL, Torrance GW, eds: Methods for the
Economic Evaluation of Health Care Programmes. Second edition. New
York Oxford University Press; 1997.
12. Gold MR, Stevenson D, Fryback DG: HALYS and QALYS and DALYS, Oh
My: similarities and differences in summary measures of population
Health. Annu Rev Public Health 2002, 23:115-134.
13. Tengs TO, Yu M, Luistro E: Health-related quality of life after stroke a
comprehensive review. Stroke 2001, 32(4):964-972.
14. Begg SJ, Vos ET, Barker B, Stevenson CE, Stanley L, Lopez AD: The burden
of disease and injury in Australia 2003. PHE 82. Canberra: Australian
Institute of Health and Welfare; 2007.
15. Hawthorne G, Richardson J, Osborne R, McNeil H: The Australian Quality
of Life Instrument: Construction, Initial Validation & Utility Scaling.
Melbourne: Centre for Health Program Evaluation; 1997.
16. Sturm JW, Osborne RH, Dewey HM, Donnan GA, Macdonell RA, Thrift AG:
Brief comprehensive quality of life assessment after stroke: the
assessment of quality of life instrument in the North East Melbourne
Stroke Incidence Study (NEMESIS). Stroke 2002, 33(12):2888-2894.
17. Hawthorne G, Osborne R: Population norms and meaningful differences
for the Assessment of Quality of Life (AQoL) measure. Aust N Z J Public
Health 2005, 29(2):136-142.
18. Begg SJ, Vos T, Barker B, Stanley L, Lopez AD: Burden of disease and
injury in Australia in the new millennium: measuring health loss from
diseases, injuries and risk factors. Med J Aust 2008, 188(1):36-40.
19. Bosworth HB: Health-related quality of life after stroke a
comprehensive review: Editorial comment. Stroke 2001, 32(4):972.
20. Islam MS, Anderson CS, Hankey GJ, Hardie K, Carter K, Broadhurst R,
Jamrozik K: Trends in Incidence and Outcome of Stroke in Perth,
Western Australia During 1989 to 2001. The Perth Community Stroke
Study. Stroke 2008, 39(3):776-82.
21. Anderson CS, Carter KN, Hackett ML, Feigin V, Barber PA, Broad JB, Bonita
R: Trends in stroke incidence in Auckland, New Zealand, during 1981 to
2003. Stroke 2005, 36(10):2087-2093.
22. Carter KN, Anderson CS, Hackett ML, Barber PA, Bonita R: Improved
survival after stroke: is admission to hospital the major explanation?
Trend analyses of the Auckland regional community stroke studies.
Cerebrovasc Dis 2007, 23(2-3):162-168.
23. Dunn C, Sadkowsky K, Jelfs P: Trends in deaths: Analysis of Australian
data 1987-1998 with updates to 2000. Canberra: Australian Institute of
Health and Welfare; 2002:198.
doi: 10.1186/1477-7525-8-49
Cite this article as: Cadilhac et al., The health loss from ischemic stroke and
intracerebral hemorrhage: evidence from the North East Melbourne Stroke
Incidence Study (NEMESIS) Health and Quality of Life Outcomes 2010, 8:49
Received: 4 September 2009 Accepted: 14 May 2010
Published: 14 May 2010
This article is available from: 2010 Cadilhac et al; licensee BioMed Central Ltd. This is an Open Access article distributed under the terms of the Creative Commons Attribution License ( ), which permits unrestricted use, distribution, and reproduction in any medium, provided the original work is properly cited.Health and Quality of Life Outcomes 2010, 8:49