báo cáo hóa học:" Response shift, recall bias and their effect on measuring change in health-related quality of life amongst older hospital patients" pdf
Bạn đang xem bản rút gọn của tài liệu. Xem và tải ngay bản đầy đủ của tài liệu tại đây (599.9 KB, 9 trang )
McPhail and Haines Health and Quality of Life Outcomes 2010, 8:65
/>Open Access
RESEARCH
© 2010 McPhail and Haines; licensee BioMed Central Ltd. This is an Open Access article distributed under the terms of the Creative Com-
mons Attribution License ( which permits unrestricted use, distribution, and reproduc-
tion in any medium, provided the original work is properly cited.
Research
Response shift, recall bias and their effect on
measuring change in health-related quality of life
amongst older hospital patients
Steven McPhail*
1,2,3
and Terry Haines
3,4,5
Abstract
Background: Assessments of change in subjective patient reported outcomes such as health-related quality of life
(HRQoL) are a key component of many clinical and research evaluations. However, conventional longitudinal
evaluation of change may not agree with patient perceived change if patients' understanding of the subjective
construct under evaluation changes over time (response shift) or if patients' have inaccurate recollection (recall bias).
This study examined whether older adults' perception of change is in agreement with conventional longitudinal
evaluation of change in their HRQoL over the duration of their hospital stay. It also investigated this level of agreement
after adjusting patient perceived change for recall bias that patients may have experienced.
Methods: A prospective longitudinal cohort design nested within a larger randomised controlled trial was
implemented. 103 hospitalised older adults participated in this investigation at a tertiary hospital facility. The EQ-5D
utility and Visual Analogue Scale (VAS) scores were used to evaluate HRQoL. Participants completed EQ-5D reports as
soon as they were medically stable (within three days of admission) then again immediately prior to discharge. Three
methods of change score calculation were used (conventional change, patient perceived change and patient
perceived change adjusted for recall bias). Agreement was primarily investigated using intraclass correlation
coefficients (ICC) and limits of agreement.
Results: Overall 101 (98%) participants completed both admission and discharge assessments. The mean (SD) age was
73.3 (11.2). The median (IQR) length of stay was 38 (20-60) days. For agreement between conventional longitudinal
change and patient perceived change: ICCs were 0.34 and 0.40 for EQ-5D utility and VAS respectively. For agreement
between conventional longitudinal change and patient perceived change adjusted for recall bias: ICCs were 0.98 and
0.90 respectively. Discrepancy between conventional longitudinal change and patient perceived change was
considered clinically meaningful for 84 (83.2%) of participants, after adjusting for recall bias this reduced to 8 (7.9%).
Conclusions: Agreement between conventional change and patient perceived change was not strong. A large
proportion of this disagreement could be attributed to recall bias. To overcome the invalidating effect of response shift
(on conventional change) and recall bias (on patient perceived change) a method of adjusting patient perceived
change for recall bias has been described.
Background
Measurement of change in patient outcomes is important
when evaluating the effect of health interventions or dis-
ease processes on an individual or group[1]. Objective
tests of patient body, structure or function can be simple
(e.g. blood pressure) or complex (e.g. positron emission
tomography). These are widely used, and can provide
insights essential for ongoing patient management. How-
ever, not all health constructs of importance can be mea-
sured using objective measures such as these[2].
Constructs such as pain, fatigue, depression and ulti-
mately health-related quality of life can be just as impor-
tant (if not more so) for evaluating treatment effect in
some conditions. However, these constructs generally
need to be measured using more subjective
* Correspondence:
1
Centre for Functioning, Disability and Health Research, Queensland Health,
Buranda Plaza, Corner of Ipswich Road and Cornwall Street, Brisbane, Australia
Full list of author information is available at the end of the article
McPhail and Haines Health and Quality of Life Outcomes 2010, 8:65
/>Page 2 of 9
approaches[2,3]. Increasingly, funding decisions in health
care are being based upon whether particular health pro-
grams or diseases impact upon subjectively measured
outcomes such as these[2-4].
A conventional approach to evaluation of change in
self-reported outcomes involves completion of a stan-
dardised measurement instrument at a certain time point
(e.g. pre-treatment) and then again at a later time point
(e.g. post treatment)[3,5]. Conventional measurement of
change in the self-reported outcome involves subtracting
the pre-treatment from the post-treatment assessment.
While this approach seems logical, a momentous con-
founding factor may exist. If through any number of
mechanisms and internal processes, a patients' under-
standing or perception of the construct under evaluation
changes over time then comparison of two longitudinal
assessments may be analogous to comparison of the pro-
verbial apple and orange. This change in perception has
been given the term 'response shift'[6-9]. If response shift
occurs between assessments it is entirely likely, that
patients will disagree with the magnitude and possibly
the direction of conventional change score calcula-
tions[6,8,9]. The scenario presented below (Scenario 1)
illustrates a change in perception that a patient may have
experienced when reporting their health-related quality
of life using a simple zero to ten scale.
Scenario 1 - A patient visits his doctor six months after
undergoing a prostate resection
Dr: "Tell me Bill (patient), how are you? Tell me on a
scale from zero to ten where zero is the worst health
you can imagine and ten is the best."
Patient: "Well I'm having a lot of trouble so I would
give myself five out of ten."
Dr: "Are you better or worse than how you were six
months ago?"
Patient: "When I think back about how I was feeling
six months ago, I would give myself a nine out of ten
because I wasn't this bad."
Dr: "What did you think at the time? Can you remem-
ber what you told me six months ago?"
Patient: "I'm not sure, I remember you asking me, I
think I said six out of ten but I didn't know then how
bad the symptoms could get."
Dr: "Let me check your file. Here, when I asked you
six months ago you actually gave yourself a three out
of ten. I made notes here about your pain, your diffi-
culty urinating, and how anxious this was making you
feel."
Patient: "Oh, yes, now I remember. I had forgotten
about how anxious I was before, but the other symp-
toms are worse now. So, doctor, are you saying I'm
better now than I was back then?"
Dr: "You tell me?"
Conflicting change scores may be calculated from this
patients' report. Conventional change score calculation
would compare the patients' current report (5/10) to their
previous report (3/10) and infer an improvement of two
points. Philosophically, if we use this calculation as the
measure of change, we imply that the most appropriate
perspective from which to rate a health state is the per-
spective held at the time of the assessment. However, this
does not consider how an individual's perception of the
construct under evaluation, in this case health-related
quality of life, might have changed between measurement
points (i.e. response shift). It is also possible to calculate
patient perceived change by comparison of the current
report (5/10) with their current perception of how they
would rate how they were feeling previously (9/10) and
infers a reduction of four points. If we use this calculation
as the measure of change, we imply that the most appro-
priate perspective from which to rate a health state is the
perspective held at one point in time. An advantage of
adopting this view is that changing standards of self-
assessment over time are eliminated from the calculation
of change. Retrospective reporting of a construct such as
this from the patient's current perspective has been
termed a 'then test.'[10,11] Then tests are the most com-
monly reported method of assessing patient perceived
change in self-reported outcomes such as health-related
quality of life and fatigue to indicate whether response
shift has occurred[10-12].
While the 'then test' is useful in revealing the patient's
current perception of change and is amenable to use in
clinical assessments, it is potentially confounded by recall
bias[12]. A patient may not be able to accurately recall
their health in relation to the evaluation process at a pre-
vious assessment and may remember rating their health
as being better or worse than they previously did. Again
consider Scenario 1. The patient recalled previously rat-
ing their health-related quality of life as 6/10, despite
actually rating it as 3/10 at the initial assessment as the
patient had forgotten how anxious they were feeling at
the time. This three point difference due to imperfect
recall would bias a patient's currently perceived change.
Thus a third approach to calculating change would be to
adjust the patient's currently perceived change for their
recall bias. For our scenario in Scenario 1, the patient's
recall bias was +3 and the patient perceived change was -
4, resulting in a final change score of -1.
The three potential change scores are represented by
the following equations:
Conventional change follow up baseline
Patient perceived ch
=−
aange follow up then test
Patient perceived change adjusted
=−
for recall bias follow up then test recall bias
Where rec
=−+
aall bias recall test baseline =−
McPhail and Haines Health and Quality of Life Outcomes 2010, 8:65
/>Page 3 of 9
Despite the potentially invalidating consequences of
inaccurate representations of change in patient reported
outcomes, there have been few empirical investigations
providing evidence to inform discussion around this
issue. Evidence supporting the existence of response shift
amongst various individual patient groups has been
reported,[6,10,13,14] although it has been concluded that
recall bias may have influenced retrospective assessments
of change, such as use of the then-test, to evaluate the
magnitude and direction of response shift
observed[12,13,15]. Along this line of investigation, a
recently study reported poor agreement between conven-
tional change and patient perceived change in health-
related quality of life amongst a population of older
adults[16]. This investigation highlighted the need to take
recall bias into account during investigations of patients'
perception of change in their health-related quality of
life[16]. No investigation has been made to examine the
potential impact of response shift and recall bias simulta-
neously. This study aims to investigate agreement and
systematic differences between conventional change and
patient perceived change as well as between conventional
change and patient perceived change adjusted for recall
bias in health-related quality of life amongst a group of
older patients accessing healthcare resources.
Methods
Design
Prospective cohort investigation.
Participants and setting
This investigation included a sample of 103 participants
taking part in larger randomised controlled trial at a ter-
tiary hospital in Brisbane, Australia. The larger trial
investigated a multi-media patient education program
aimed to prevent in-hospital falls amongst hospitalised
older adults[17]. The participants in this investigation
included a convenience sample of those who were consid-
ered by clinical staff to be likely to require a period of
subacute in-hospital rehabilitation prior to discharge
(with a length of stay greater than two weeks). Patients
with moderate to severe cognitive deficits (e.g. Mini-
Mental State Examination[18] < 24/30 or any patient in
post-traumatic amnesia) were excluded as were partici-
pants with moderate or severe language deficits (e.g.
aphasic stroke patients).
This patient group was selected for this investigation
for several reasons. First, inpatient rehabilitation amongst
hospitalised older adult groups is often focused on
improving function to maximise health-related quality of
life (rather than a curative effect). Therefore, meaningful
evaluation of health-related quality of life is very impor-
tant amongst this patient group. Additionally, due to the
nature of inpatient, multi-faceted and multi disciplinary
clinical interventions required, healthcare for this group
is resource intensive further heightening the need for
accurate and meaningful evaluation of effect. Lastly, due
to health events, social changes, peer comparisons and
the hospitalisation experience, patients in this group are
likely to have experienced adaptation and changes in
internal value systems which have lead to a response shift,
particularly in regard to reporting their health-related
quality of life at the beginning in comparison to the end
of their hospitalisation experience.
Measures
Health-related quality of life was evaluated using the EQ-
5D instrument[19]. The first 5 questions from the EQ-5D
investigate the domains of mobility, usual activities, per-
sonal care, pain/discomfort and anxiety/depression. For
each of these questions the respondent may choose one
of three statements indicating they either have no prob-
lems, some problems or extreme problems in that
domain. A multi-attribute utility score (utility) where
death and perfect health are represented by 0 and 1
respectively was calculated from these five questions by
applying the Dolan tariff system[20]. Scores less than 0
are considered worse than death and 1 is the maximum
score possible. The sixth and final question is an overall
health state visual analogue scale (VAS) where worst
imaginable and best imaginable health are represented by
0 and 100 respectively[19]. Both the utility and VAS
scores were used in this investigation.
For the purpose of calculating conventional change in
health-related quality of life over the length of admission,
patients completed the EQ-5D on two occasions; after
admission (baseline) and immediately prior to discharge
(discharge). The difference between these two scores was
considered conventional change in health-related quality
of life.
For the purpose of calculating patient perceived change
in health-related quality of life a 'then test' was also imple-
mented using the EQ-5D instrument at the assessment
immediately prior to discharge. This involved the patient
reporting how they believe their HRQoL was at the base-
line assessment using the EQ-5D instrument. At the dis-
charge assessment after completing the standard EQ-5D,
patients were asked to report (from their current per-
spective) how they believed their health-related quality of
life was at the baseline assessment (using the EQ-5D
instrument).
For the purpose of calculating patient recall bias, a
recall test was also completed at the discharge assess-
ment. When completing the recall test, the patient was
asked to indicate what they believed they actually
reported on the EQ-5D instrument at the baseline assess-
ment. Patients were asked to complete the recall test after
completing the standard EQ-5D and the EQ-5D then test.
McPhail and Haines Health and Quality of Life Outcomes 2010, 8:65
/>Page 4 of 9
This was the third and final time the EQ-5D instrument
was used at the discharge assessment (standard EQ-5D,
EQ-5D then test and EQ-5D recall test).
Procedure
All participants completed a baseline assessment that
included the standard EQ-5D as soon as they were
deemed medically stable by clinical staff and were able to
provide written informed consent (within 72 hours of
admission). Participants then completed the standard
EQ-5D, EQ-5D then test and EQ-5D recall test at their
discharge assessment immediately prior to discharge
from the hospital. Length of stay in hospital and hence
length of time between assessments was different for
each patient. However, 'then test' and 'recall tests' were
completed at the discharge assessment with the reference
point always being their initial baseline assessment. Par-
ticipants provided written informed consent prior to par-
ticipation. Ethical approvals were granted by the Princess
Alexandra Hospital Human Research Ethics Committee
and The University of Queensland Medical Research Eth-
ics Committee.
Data Analysis
Demographic information including mean age, baseline
and discharge health-related quality of life reports were
tabulated (Table 1). Change scores were calculated for
both EQ-5D utility and VAS. Conventional change scores
were calculated by subtracting the baseline assessment
from the discharge assessment. Patient perceived change
scores were calculated by subtracting 'then test' scores
from the baseline assessment. Patient perceived change
adjusted for recall bias was calculated by first calculating
the recall bias, then adjusting the patient perceived
change by the recall bias amount. To calculate recall bias
the baseline assessment was subtracted from the recall
test score.
Agreement between conventional change and patient
perceived change as well between conventional change
and patient perceived change adjusted for recall bias were
calculated using intraclass-correlation coefficients and
limits of agreement (separately for utility and VAS). To
evaluate whether any systematic difference existed (i.e.
whether conventional change was consistently higher or
lower than patient perceived change or patient perceived
change adjusted for recall bias), paired t-tests were
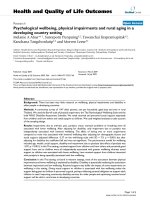
employed (Table 2). Bland-Altman plots with limits of
agreement [21] were also prepared (Figure 1) to visually
represent agreement levels between conventional change
and patient perceived change as well as for conventional
change and patient perceived change adjusted for recall
bias (for EQ-5D utility and VAS).
To examine the magnitude of discrepancy between
change scores within individuals, the absolute difference
between conventional change and patient perceived
change was calculated for each participant (regardless of
direction). To assist interpretation of whether the magni-
tude of difference between these change scores within
individuals was clinically meaningful, the number of par-
ticipants with a discrepancy between utility change
scores greater than a minimal clinically important differ-
ence of 0.081 was calculated (Table 3). This value (0.081)
was previously reported as the median value for EQ-5D
utility minimal clinically important difference from a
review of 8 investigations incorporating 11 popula-
tions[22]. In the same way the absolute difference
between conventional change and patient perceived
change adjusted for recall bias was also calculated for
Table 1: Demographic information for participants
included in analysis.
Hospitalised older adults
(n = 103)
Datasets complete and
included in analysis (% of
total)
101 (98.1%)
Length of stay in days -
median (IQR)
38 (20-60)
Age - mean (sd) 73.3 (11.2)
Female - number (% of those
patients included in analysis)
48 (47.5%)
Baseline health-related
quality of life (EQ-5D utility) -
mean (sd)
0.368 (0.338)
Baseline health-related
quality of life (EQ-5D VAS) -
mean (sd)
63.2 (17.1)
Perception of baseline at
discharge (EQ-5D utility then
test) - mean (sd)*
0.215 (0.406)
Perception of baseline at
discharge (EQ-5D VAS then
test) - mean (sd)*
45.7 (21.0)
Recall of baseline response
(EQ-5D utility recall test) -
mean (sd)*
0.231 (0.405)
Recall of baseline response
(EQ-5D VAS recall test) -
mean (sd)*
47.5 (20.3)
Discharge health-related
quality of life (EQ-5D utility) -
mean (sd)*
0.656 (0.240)
Discharge health-related
quality of life (EQ-5D VAS) -
mean (sd)*
72.5 (16.7)
* Collected at the discharge assessment
McPhail and Haines Health and Quality of Life Outcomes 2010, 8:65
/>Page 5 of 9
each participant, and the number with a discrepancy in
utility greater than 0.081 was also calculated (Table 3).
To specifically investigate the effect of recall bias on
patient perceived change, agreement between patient
perceived change with and without adjustment for recall
bias was also calculated using intraclass-correlation coef-
ficients and limits of agreement (Table 4). To evaluate
whether any systematic difference existed (i.e. whether
adjusting for recall bias resulted in consistently higher or
lower patient perceived change scores), paired t-tests
were employed (Table 4).
Results
Demographic and health-related quality of life reports are
presented in Table 1. Two datasets were incomplete due
to the unexpected discharge of two patients from hospital
(without reassessment); these two datasets were excluded
from all analysis. From the baseline assessment it can be
seen that health-related quality of life was low amongst
this elderly, hospitalised patient group[23]. The median
(inter-quartile range) for length of stay was 38 (20-60)
days.
Mean change scores and agreement statistics between
conventional change and patient perceived change as well
as between conventional change and patient perceived
change adjusted for recall bias are presented in Table 2.
Intraclass correlation coefficient (ICC) statistics indi-
cated that agreement between conventional change and
patient perceived change was not strong (EQ-5D utility =
0.34, EQ-5D VAS = 0.40). This was consistent with the
limits of agreement statistics and Bland-Altman plots
(Figure 1a and 1c) which covered a large proportion of
the possible change scores. After adjusting patient per-
ceived change for recall bias, ICC statistics (EQ-5D utility
= 0.98, EQ-5D VAS = 0.90), limits of agreement and
Bland-Altman plots (Figure 1b and 1d) indicated that
agreement with conventional change was much stronger.
The mean patient perceived change was greater than
mean conventional change scores for both utility and
VAS. Although this mean difference was statistically sig-
nificant with and without adjustment for recall bias, the
magnitude of the mean difference only exceeded reported
minimal values for clinically important difference when
no adjustment for recall bias was made (Table 2)[22].
The absolute difference between conventional change
scores and patient perceived change score (with and
without adjustment for recall bias) are presented in Table
3. Within individuals, discrepancy between conventional
longitudinal change and patient perceived change was
considered clinically meaningful for 84 (83.2%) of partici-
pants, after adjusting for recall bias this reduced to 8
(7.9%).
Agreement between patient perceived change scores
with and without adjustment for recall bias was not
strong. Agreement statistics for this relationship are pre-
sented in Table 4. Intraclass correlation coefficients did
not indicate strong agreement for either EQ-5D utility
(ICC = 0.36) or EQ-5D VAS (ICC = 0.50). This was con-
sistent with the limits of agreement, which covered a
large proportion of possible responses (Table 4). Mean
Table 2: Mean change, intraclass correlation coefficient (ICC), and limits of agreement (LOA) between change scores
calculated from conventional longitudinal assessments and the patients' perspective (with and without adjustment for
recall bias).
Measure Patient
perspective
adjusted for
recall bias
Conventional
change
mean (95%
CI)
Patient
perspective
change
mean (95%CI)
ICC
(95% CI)
Limits of agreement p-value*
Lower LOA
(95% CI)
Mean
difference
(95% CI)
Upper LOA
(95% CI)
EQ-5D Utility No 0.287
(0.216,0.359)
0.441
(0.367,0.518)
0.34
(0.16,0.50)
-1.007
(-1.092,-0.922)
-0.150
(-0.239,-0.069)
0.700
(0.616,0.785)
< 0.001*
EQ-5D Utility Yes 0.287
(0.216,0.359)
0.303
(0.232,0.375)
0.98
(0.97,0.99)
-0.150
(-0.163,-0.136)
-0.016
(-0.116,-0.084)
0.118
(0.105,0.131)
0.019*
EQ-5D VAS No 9.3
(5.4,13.2)
26.7
(22.8,30.7)
0.40
(0.22,0.55)
-60.7
(-65.0,-56.4)
-17.4
(-21.7,-13.1)
25.8
(21.5,30.1)
< 0.001*
EQ-5D VAS Yes 9.3
(5.4,13.2)
11.0
(6.7,15.3)
0.90
(0.86,0.93)
-19.9
(-21.8,-18.1)
-1.7
(-3.5,0.1)
16.5
(14.7,18.3)
0.060
* A p-value < 0.05 indicates that a systematic difference exists (i.e. change from patient perspective was either consistently higher or consistently
lower than conventional change scores.
McPhail and Haines Health and Quality of Life Outcomes 2010, 8:65
/>Page 6 of 9
patient perceived change in EQ-5D utility and VAS was
less positive after adjustment for recall bias (p = 0.002 and
p < 0.001 respectively) with the size of this difference
large enough to be considered clinically meaningful
(Table 4)[22].
Discussion
Main findings
Serious undesirable consequences may result from inac-
curate representation of change in self-reported patient
health states. This investigation has indicated that agree-
ment between conventional change and patient perceived
change in health-related quality of life, as evaluated with
the 'then test,' was not strong (agreement coefficient lev-
els below 0.40 are considered indicative of poor agree-
ment)[24-26]. Additionally, mean conventional change
scores were significantly lower than patient perceived
change scores (Table 2 and Figure 1), this difference was
large enough to be considered clinically meaningful[22].
Within individuals the disagreement between conven-
tional longitudinal change and patient perceived change
was substantial with 83.2% of individuals reporting a dis-
Figure 1 Bland-Altman plots (with limits of agreement) for change calculated from conventional longitudinal assessments and patient
perceived change in utility without (1a) and with (1b) adjustment for recall bias as well as for change in EQ-5D VAS without (1c) and with
(1d) adjustment for recall bias.
Table 3: Absolute differences between conventional and patient perceived change (with and without adjustment for
recall bias) and the number of patients with this difference greater than a minimal clinically important difference (MCID)
in utility of 0.081.
Utility
mean (sd)
VAS
mean (sd)
> MCID
number (%)
No adjustment for recall bias 0.363 (0.273) 22.3 (16.6) 84 (83.2%)
With adjustment for recall bias 0.021 (0.066) 3.5 (8.6) 8 (7.9%)
McPhail and Haines Health and Quality of Life Outcomes 2010, 8:65
/>Page 7 of 9
crepancy great enough to be considered clinically mean-
ingful (Table 3).
After adjusting patient perceived change for recall bias
the agreement with conventional change was much
stronger (Table 2 and Figure 1). The mean difference also
diminished to a level below that which is likely to be con-
sidered clinically meaningful difference[22]. Furthermore
after adjustment for recall bias, agreement between
patient perceived change and conventional change was
much stronger within individuals, with only 7.9% report-
ing a discrepancy large enough to be considered clinically
meaningful (Table 3). Adjusting patient perceived change
for recall bias resulted in less positive reports of change in
both EQ-5D utility and VAS (Table 4).
The pattern of main findings described above indicate
that amongst this patient sample over the duration of
their hospital stay, a large proportion of the disagreement
between patient perceived change and conventional lon-
gitudinal change could be attributed to recall bias rather
than response shift. While this was the case during the
investigation at hand, the relative contribution of
response shift and recall bias may vary across other
patient groups and amongst this type of population in
other circumstances (such as the transition from hospital
to the community). Response shift has the potential to
invalidate conventional change scores while recall bias
has the potential to invalidate patient perceived change
measured using retrospective reports, such as the then-
test. This investigation has been the first to incorporate a
method of adjusting patient perceived change for patient
recall bias.
Wider implications
For an individual patient, inappropriate implementation,
continuation or cessation of a health intervention may
occur if a decision is reached based on clinical reasoning
flawed by inaccurate representations of change in a rele-
vant self-reported outcome. Perhaps of even greater con-
sequence, evaluation of the effectiveness of a certain
health intervention during a randomised trial may be
compromised if one group experiences a systematic
response shift[27]. In this investigation the mean conven-
tional change was statistically lower and than the mean
patient perceived change (even after adjustment for recall
bias) implying that a systematic response shift (albeit very
small in this case) had occurred. If during a randomised
trial, a systematic response shift of a clinically important
magnitude occurred due to the nature of an intervention,
inappropriate conclusions regarding effect on health-
related quality of life may be drawn. Furthermore other
clinically important patient reported outcomes such as
pain, fatigue and anxiety, may be affected.
Consider a trial examining a certain experimental sur-
gery designed to reduce rheumatic pain in comparison to
conventional conservative management. It is possible that
patients in the surgery group may experience a very pain-
ful and prolonged post-operative recovery period, which
could result in a response shift in relation to their pain
rating. If this were to occur, conventional post - pre evalu-
ation of pain ratings may imply a reduction in pain
despite individuals not actually feeling any less pain then
they did prior to the surgery. A false positive result such
as this is likely to lead to further investigations of the
technique that may also report similar results and ulti-
mately superfluous adoption of a potentially harmful
intervention[27]. Economic evaluation of health inter-
ventions may also be invalidated if a similar effect
resulted in an inaccurate representation of change in
health-related quality of life that was subsequently used
in a cost-utility analysis.
The method of adjustment reported in this investiga-
tion has the potential to highlight invalidating effects of
Table 4: Mean change, intraclass correlation coefficient (ICC), and limits of agreement (LOA) between change scores
calculated from the patients' perspective with adjustment for recall bias and from the patients' perspective without
adjustment for recall bias.
Measure Patient perspective of change ICC
(95% CI)
Limits of agreement p-value*
With recall bias
adjustment
mean (95% CI)
Without recall
bias adjustment
mean (95% CI)
Lower LOA
(95% CI)
Mean difference
(95% CI)
Upper LOA
(95% CI)
EQ-5D Utility 0.303
(0.232,0.375)
0.441
(0.367,0.518)
0.36
(0.18,0.52)
-0.979
(-1.063,-0.895)
-0.138
(-0.221,-0.054)
0.704
(0.620,0.787)
0.002*
EQ-5D VAS 11.0
(6.7,15.3)
26.7
(22.8,30.7)
0.50
(0.34,0.64)
-57.1
(-61.2,-53.0)
-15.7
(-19.8,-11.6)
25.7
(21.6,29.8)
< 0.001*
*A p-value < 0.05 indicates that a systematic difference exists (i.e. patient perspective of change adjusted for recall bias was consistently higher
or consistently lower than when no adjustment for recall bias was made.
McPhail and Haines Health and Quality of Life Outcomes 2010, 8:65
/>Page 8 of 9
response shift and recall bias as well as offering an alter-
nate method for change score calculation. A response
shift and recall bias sensitivity analysis could be con-
ducted to examine whether the different methods of
change score calculation affects conclusions drawn in
clinical trials. If the same conclusions would be drawn
regardless of whether conventional or adjusted change
scores were used, this may indicate that results were
robust against response shift and recall bias. However,
further investigation and discussion regarding this pro-
posed adjustment technique is warranted before adop-
tion into wider use.
Comparison to previous research
This investigation has employed a novel approach allow-
ing for adjustment to self-reported outcomes to be made
using a retrospective report (then test) adjusted for recall
bias which may be replicated in both clinical and research
settings in an effort to reduce the invalidating effects of
response shift and recall bias. Comparison to prior
research is difficult as this is the first investigation to
employ an adjustment for patient recall bias when utilis-
ing a then-test approach. However, empirical evidence
from this investigation is in line with conceptual models
surrounding the response shift phenomenon[7,8]. Results
from the then test without adjustment for recall bias
reported in this investigation are also congruent with pre-
vious investigations of response shift that have not
adjusted for recall bias[10,11,13,17]. The results from this
investigation suggest that recall bias is likely to affect ret-
rospective reports amongst patient groups similar to
those in this sample and this should be taken into account
in future investigations utilising retrospective reporting
techniques such as the then test approach.
Limitations and future directions
Direct extrapolation of these results may be limited to
patient populations similar to those included in this
study. Other patient groups and older adults in differing
circumstances may not have responded in the same way
as participants in this investigation. Furthermore, health-
related quality of life was the only construct under inves-
tigation in this study and only one generic instrument
(EQ-5D) was used to evaluate this construct. However, a
method of adjusting patient perceived change for recall
bias has been described in this investigation that may be
applied amongst other population groups and clinical set-
tings. Further empirical research along this line of investi-
gation is warranted, as is further discussion regarding the
best way for clinicians and researchers alike to discern
'real change' amongst patient reported outcomes of a sub-
jective nature. Particularly amongst patient groups where
improvement in these subjective constructs is often the
ultimate aim of health interventions rather than a
straightforward curative effect on a known pathology.
Another important area for future investigation and
discussion is in regard to which perspective of change is
the most important to various stakeholders (meaningful
change as perceived by patients, their family/carers,
health experts or organisations, other members of society
who fund health interventions through taxes and insur-
ance premiums etc.). Future investigation and discussion
of these issues are required to maximise health outcomes
for all members of society.
Conclusions
Agreement between conventional change and patient
perceived change was not strong. A large proportion of
this disagreement may be attributable to recall bias. To
overcome the invalidating effect of response shift (on
conventional change) and recall bias (on patient per-
ceived change) a method of adjusting patient perceived
change for recall bias has been described.
Acknowledgements
Terry Haines is supported by a National Health and Med-
ical Research Council (Australia) Career Development
Award (606732).
This project was supported by a National Health and
Medical Research Council (Australia) Project Grant
(456097).
Competing interests
The authors declare that they have no competing interests.
Authors' contributions
SM contributed to research idea conception, planning of research processes,
data analysis and manuscript preparation, as well as manuscript review,
appraisal and editing. TH contributed to research idea conception, planning of
research processes as well as manuscript review, appraisal and editing. Both
authors read and approved the final manuscript.
Author Details
1
Centre for Functioning, Disability and Health Research, Queensland Health,
Buranda Plaza, Corner of Ipswich Road and Cornwall Street, Brisbane, Australia,
2
School of Public Health and Institute of Health and Biomedical Innovation,
Queensland University of Technology, Kelvin Grove, Australia,
3
The University
of Queensland, School of Health and Rehabilitation Sciences, St Lucia, Australia
,
4
Southern Health, Allied Health Clinical Research Unit, Kingston Centre, Cnr
Warrigal and Kingston Roads, Cheltenham, Australia and
5
Monash University,
Physiotherapy Department, School of Primary Health Care, Monash University
Peninsular Campus, Victoria, Australia
References
1. Crosby RD, Kolotkin RL, Williams GR: Defining clinically meaningful
change in health-related quality of life. J Clin Epidemiol 2003,
56(5):395-407.
2. Sullivan M: The new subjective medicine: taking the patient's point of
view on health care and health. Soc Sci Med 2003, 56(7):1595-1604.
3. Wiklund I: Assessment of patient-reported outcomes in clinical trials:
the example of health-related quality of life. Fundam Clin Pharmacol
2004, 18(3):351-363.
Received: 8 April 2010 Accepted: 10 July 2010
Published: 10 July 2010
This article is available from: 2010 McPhail and Haines; licensee BioMed Central Ltd. This is an Open Access article distributed under the terms of the Creative Commons Attribution License ( which permits unrestricted use, distribution, and reproduction in any medium, provided the original work is properly cited.Health and Qu ality of Life Out comes 2010, 8:65
McPhail and Haines Health and Quality of Life Outcomes 2010, 8:65
/>Page 9 of 9
4. Drummond MF, Iglesias CP, Cooper NJ: Systematic reviews and
economic evaluations conducted for the National Institute for Health
and Clinical Excellence in the United Kingdom: a game of two halves?
Int J Technol Assess Health Care 2008, 24(2):146-150.
5. Bullinger M: Assessing health related quality of life in medicine. An
overview over concepts, methods and applications in international
research. Restor Neurol Neurosci 2002, 20(3-4):93-101.
6. Schwartz CE, Andresen EM, Nosek MA, Krahn GL: Response shift theory:
important implications for measuring quality of life in people with
disability. Arch Phys Med Rehabil 2007, 88(4):529-536.
7. Schwartz CE, Rapkin BD: Reconsidering the psychometrics of quality of
life assessment in light of response shift and appraisal. Health Qual Life
Outcomes 2004, 2:16.
8. Sprangers M, Schwartz C: Integrating response shift into health-related
quality of life research: a theoretical model. Social Science and Medicine
1999, 48(11):1507-1515.
9. Visser MR, Smets EM, Sprangers MA, de Haes HJ: How response shift may
affect the measurement of change in fatigue. J Pain Symptom Manage
2000, 20(1):12-18.
10. Sprangers MA, Van Dam FS, Broersen J, Lodder L, Wever L, Visser MR,
Oosterveld P, Smets EM: Revealing response shift in longitudinal
research on fatigue the use of the thentest approach. Acta Oncol
1999, 38(6):709-718.
11. Visser MR, Oort FJ, Sprangers MA: Methods to detect response shift in
quality of life data: a convergent validity study. Qual Life Res 2005,
14(3):629-639.
12. Schwartz C, Sprangers M: Methodological approaches for assessing
response shift in longitudinal health-related quality-of-life research.
Social Science and Medicine 1999, 48:1531-1548.
13. Ahmed S, Mayo NE, Wood-Dauphinee S, Hanley JA, Cohen SR: The
structural equation modeling technique did not show a response shift,
contrary to the results of the then test and the individualized
approaches. J Clin Epidemiol 2005, 58(11):1125-1133.
14. Oort FJ, Visser MR, Sprangers MA: An application of structural equation
modeling to detect response shifts and true change in quality of life
data from cancer patients undergoing invasive surgery. Qual Life Res
2005, 14(3):599-609.
15. Ahmed S, Mayo NE, Wood-Dauphinee S, Hanley JA, Cohen SR: Response
shift influenced estimates of change in health-related quality of life
poststroke. J Clin Epidemiol 2004, 57(6):561-570.
16. McPhail S, Comans T, Haines T: Evidence of disagreement between
patient perceived change and conventional longitudinal evaluation of
change in health-related quality of life amongst older adults. Clin
Rehabil 2010 in press.
17. Hill AM, Hill K, Brauer S, Oliver D, Hoffmann T, Beer C, McPhail S, Haines TP:
Evaluation of the effect of patient education on rates of falls in older
hospital patients: description of a randomised controlled trial. BMC
Geriatr 2009, 9:14.
18. Folstein MF, Folstein SE, McHugh PR: "Mini-mental state". A practical
method for grading the cognitive state of patients for the clinician. J
Psychiatr Res 1975, 12(3):189-198.
19. Rabin R, de Charro F: EQ-5D: a measure of health status from the
EuroQol Group. Ann Med 2001, 33(5):337-343.
20. Dolan P, Roberts J: Modelling valuations for Eq-5d health states: an
alternative model using differences in valuations. Med Care 2002,
40(5):442-446.
21. Bland JM, Altman DG: Statistical methods for assessing agreement
between two methods of clinical measurement. Lancet 1986,
1(8476):307-310.
22. Walters SJ, Brazier JE: Comparison of the minimally important difference
for two health state utility measures: EQ-5D and SF-6D. Qual Life Res
2005, 14(6):1523-1532.
23. Kind P, Dolan P, Gudex C, Williams A: Variations in population health
status: results from a United Kingdom national questionnaire survey.
BMJ (Clinical research ed) 1998, 316(7133):736-741.
24. Shrout PE, Fleiss JL: Intraclass correlations: uses in assessing rater
reliability. Psychological bulletin 1979, 86(2):420-428.
25. Cicchetti DV, Sparrow SA: Developing criteria for establishing interrater
reliability of specific items: applications to assessment of adaptive
behavior. American journal of mental deficiency 1981, 86(2):127-137.
26. Pickard AS, Johnson JA, Feeny DH, Shuaib A, Carriere KC, Nasser AM:
Agreement between patient and proxy assessments of health-related
quality of life after stroke using the EQ-5D and Health Utilities Index.
Stroke 2004, 35(2):607-612.
27. McPhail S, Haines T: The Response Shift Phenomenon in Clinical Trials.
Journal of Clinical Research Best Practices 2009, 5(12):.
doi: 10.1186/1477-7525-8-65
Cite this article as: McPhail and Haines, Response shift, recall bias and their
effect on measuring change in health-related quality of life amongst older
hospital patients Health and Quality of Life Outcomes 2010, 8:65